visualize cnn feature maps with tiny-tensorrt
Let's start with the classic MNIST example, I use the famous LeNet-5, you can visualize it by caffe network visualization tool, and the model structure look like this.

you need to compile the project at the beginning.
# make sure you install cuda and tensorrt 5.x, opencv is not necessary for this sample.
# you can just comment relative line in CMakeLists.txt if you don't want to run yolov3
git clone --recursive https://github.com/zerollzeng/tensorrt-zoo
mkdir build
cd build && cmake .. && make && cd ..
and after install some site-packages and run vis.py, you're done!
pip install -r requirements.txt
python vis.py -i 6.png --prototxt models/mnist/deploy.prototxt --caffemodel models/mnist/mnist.caffemodel --engine_file models/mnist/mnist.trt --mark_type 'convolution' 'pooling' 'innerproduct' 'softmax' --normalize_factor 1 --normalize_bias 0
in ./activation you will see a bunch of sub-folders
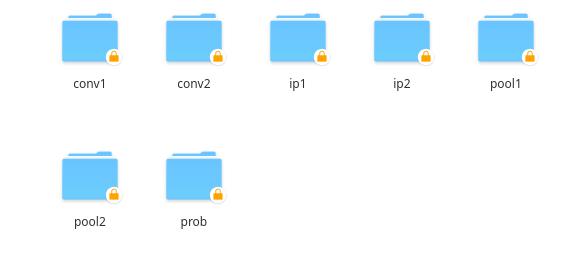
and you can see each activation visualization in those sub-folders.

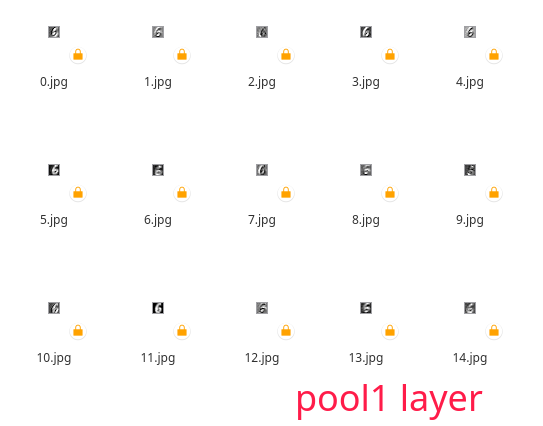


I am gonna show you how to use tiny-tensorrt to visualize a model layer activation, hope it will give you an intuitive understanding of tiny-tensorrt and convolutional neural network.
you need to prepare caffe model for openpose and install some python packages
# download model, you can also download it via browser
wget -P ./models/openpose http://posefs1.perception.cs.cmu.edu/OpenPose/models/pose/body_25/pose_iter_584000.caffemodel
wget -P ./models/openpose https://raw.githubusercontent.com/CMU-Perceptual-Computing-Lab/openpose/master/models/pose/body_25/pose_deploy.prototxt
cd activation-visualization
pip install -r requirements.txt
after compile and data prepare, you can run sample now
python vis.pyand you can see output activation images in activation folder, it contain all of the convolution layer of openpose and it should look like this.

for more intuitive understanding, I recommend you visualize prototxt with this online caffe network visualization tool, you can browse the network architecture like this

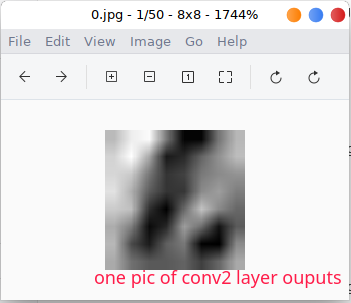
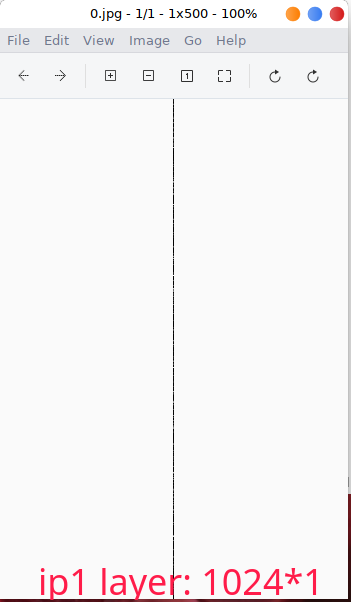
you can see details activation images in those sub-folders. like this feature map in first convolution layer

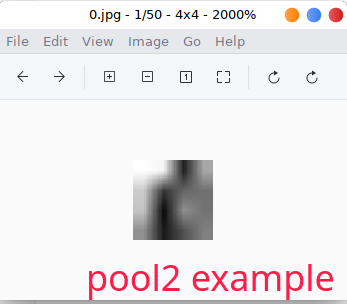
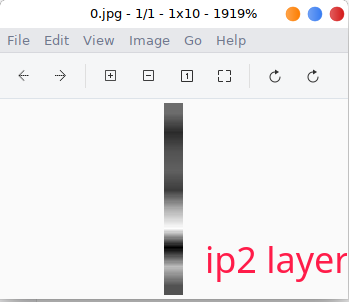
and it's just a channel of the fisrt convolution layer, while the other looks like

if you see other activation map, you might see some activation in the middle of the model layers like Mconv3_stage0_L2_1, you know this layer get some keypoints and pose informaion.

or activation near the end of the model which looks like Mconv6_stage1_L2, which output activation is very close to pose and keypoints.

you can test with your own model, maybe need some change in vis.py because of different pre-processing. see
python vis.py --help