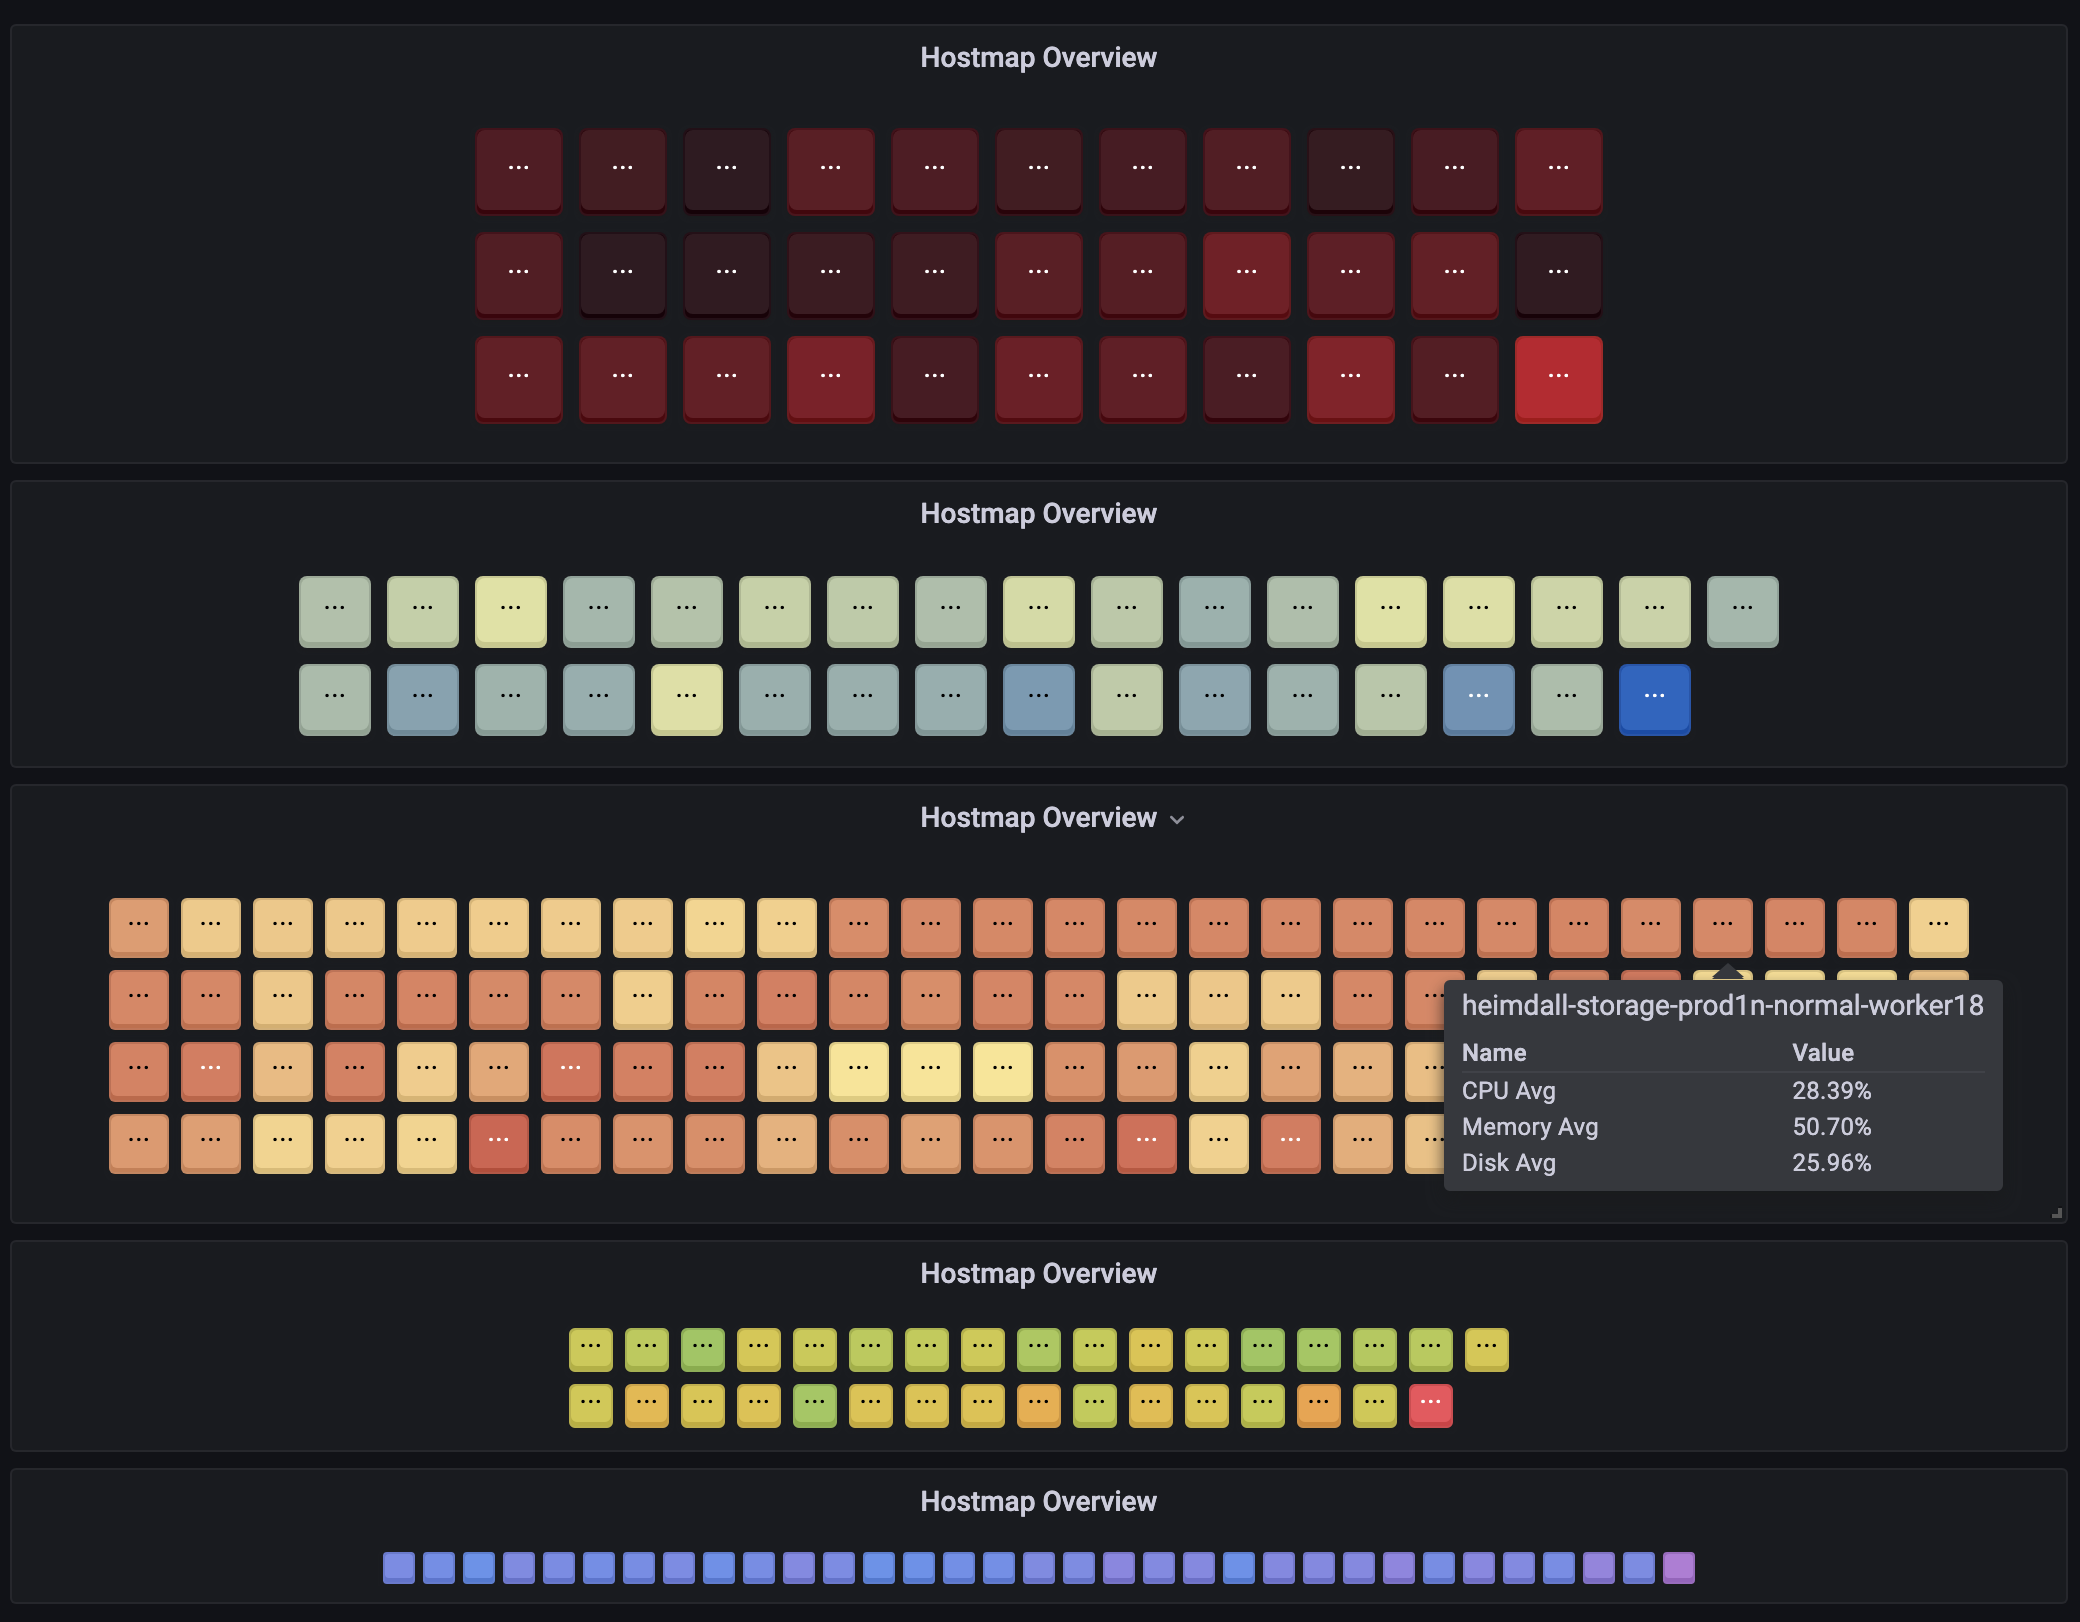
Grafana Panel Plugin to easily understand the host's system metric at a glance
- promethues
- elasticsearch
tested.
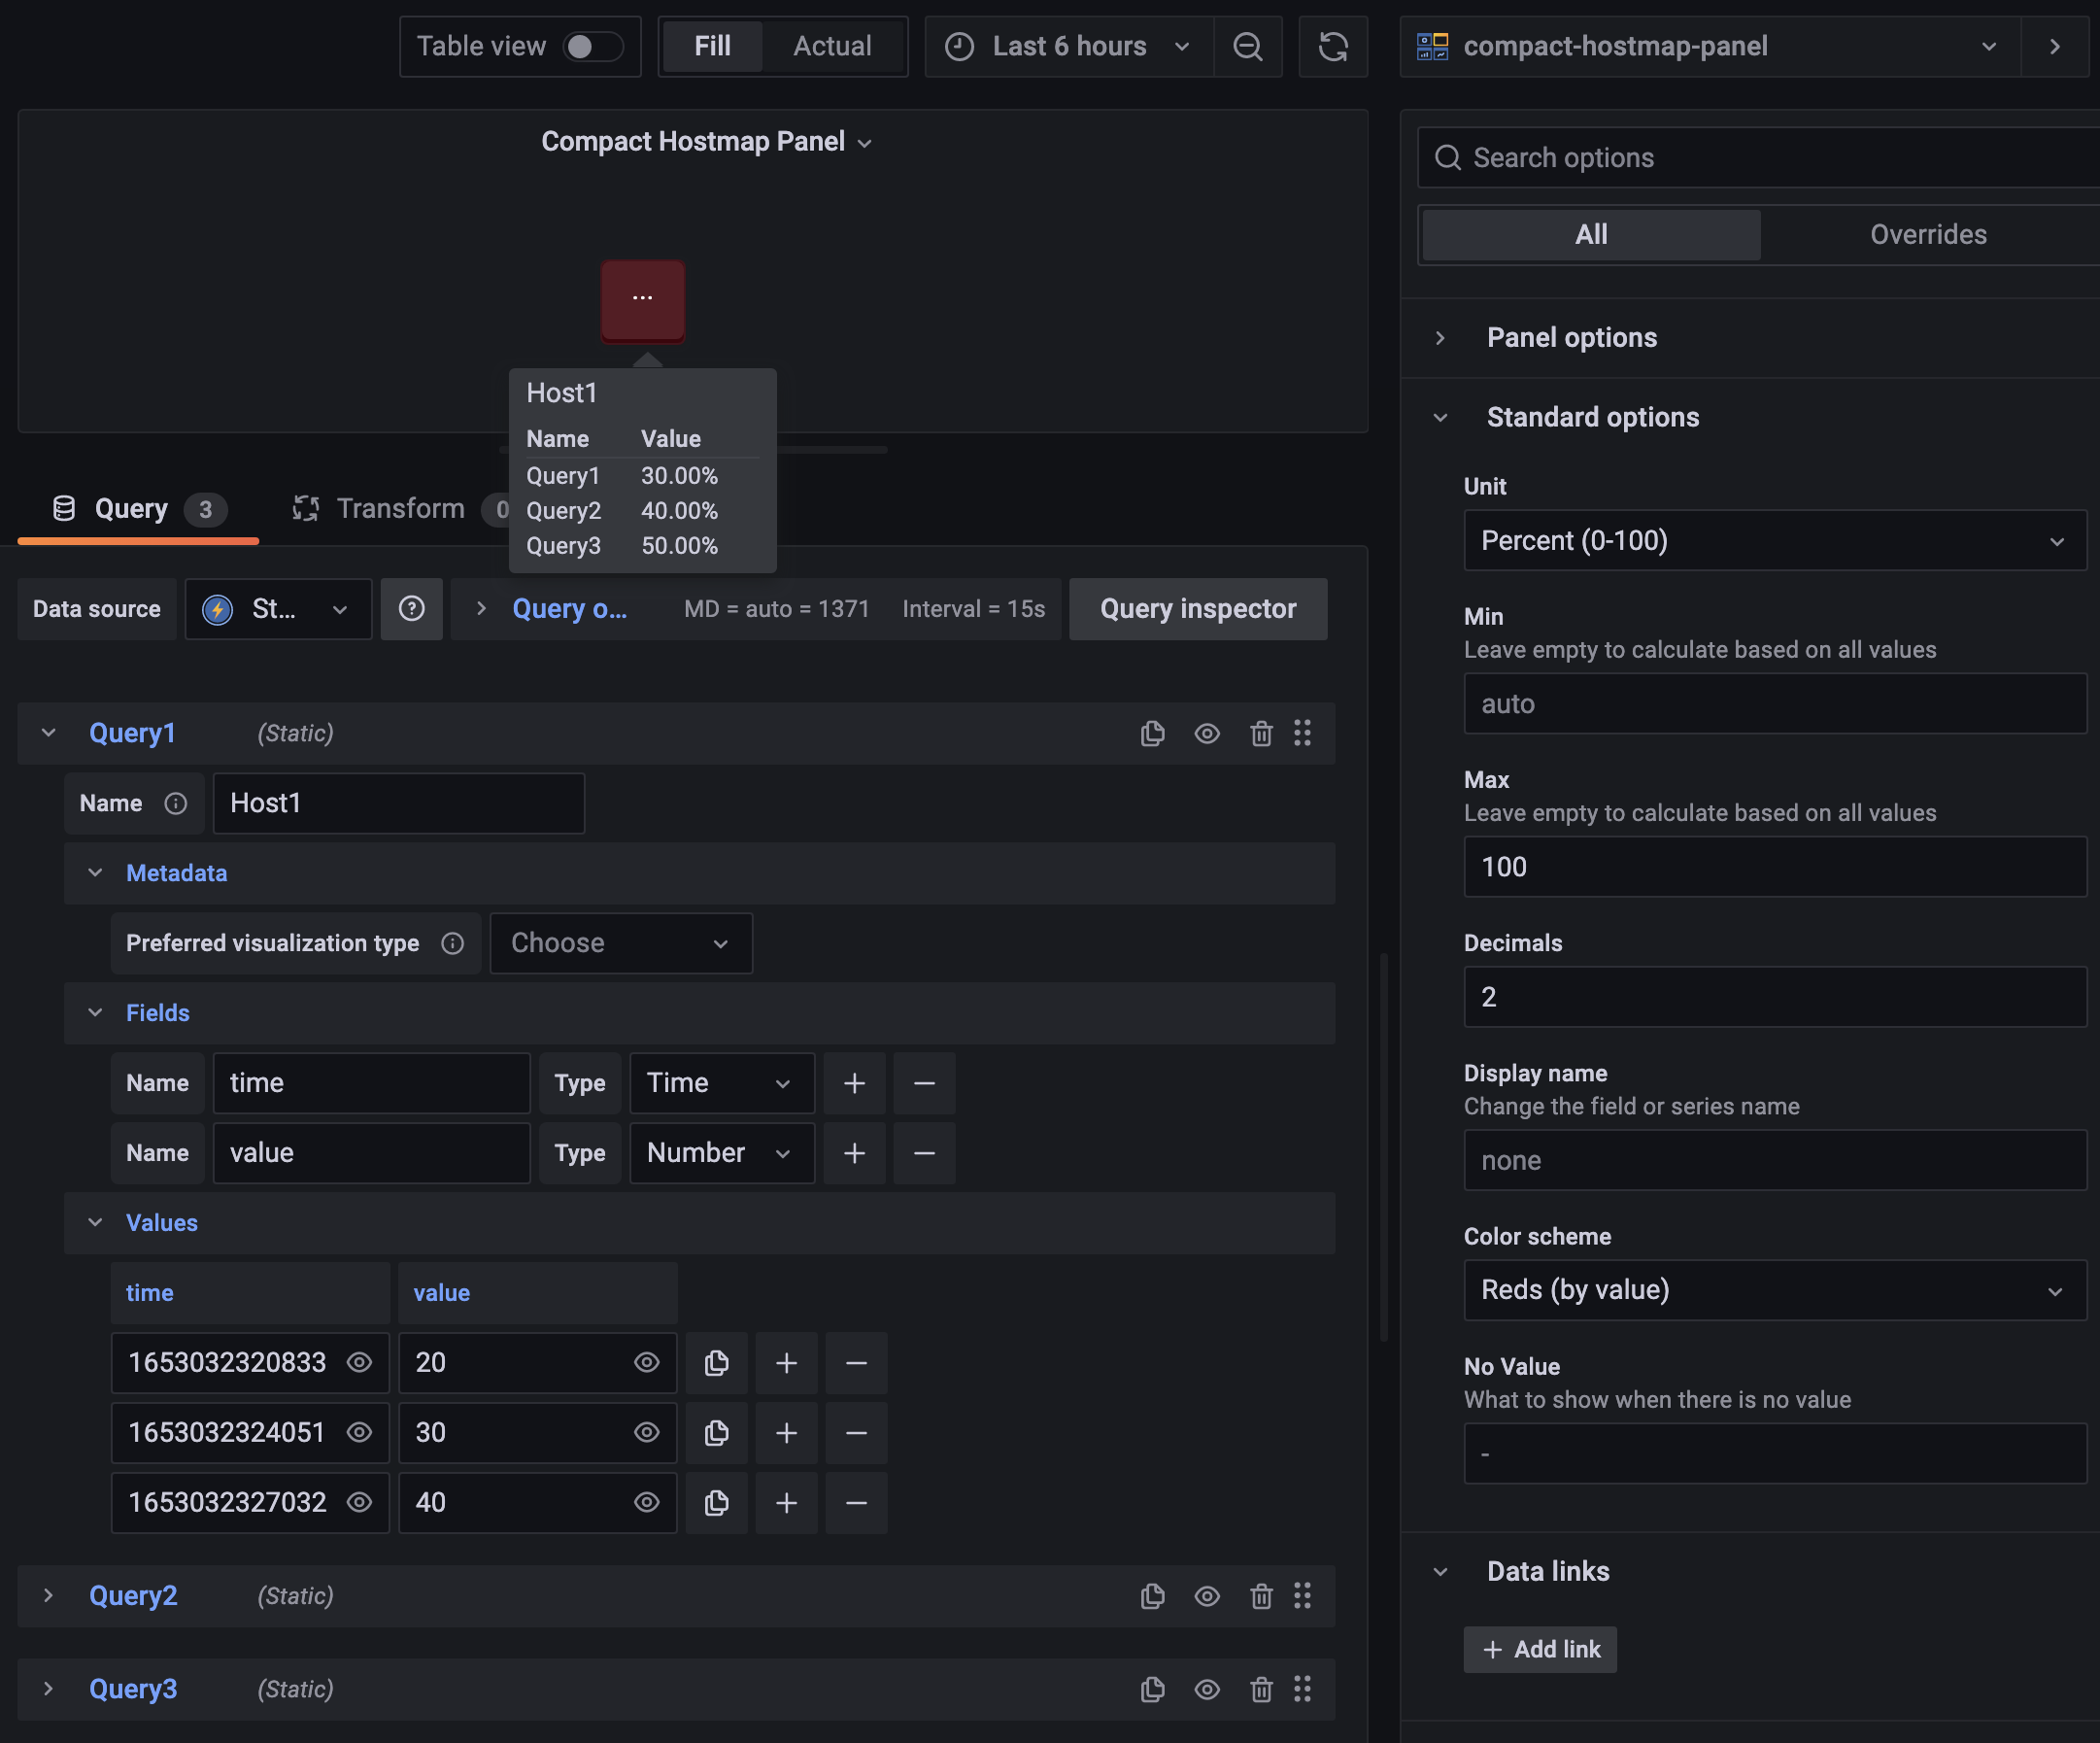
Supports Grafana plugin interface data frames, groupBy each frame based on name || field's config.displayName || config.displayNameFromDS field's key.
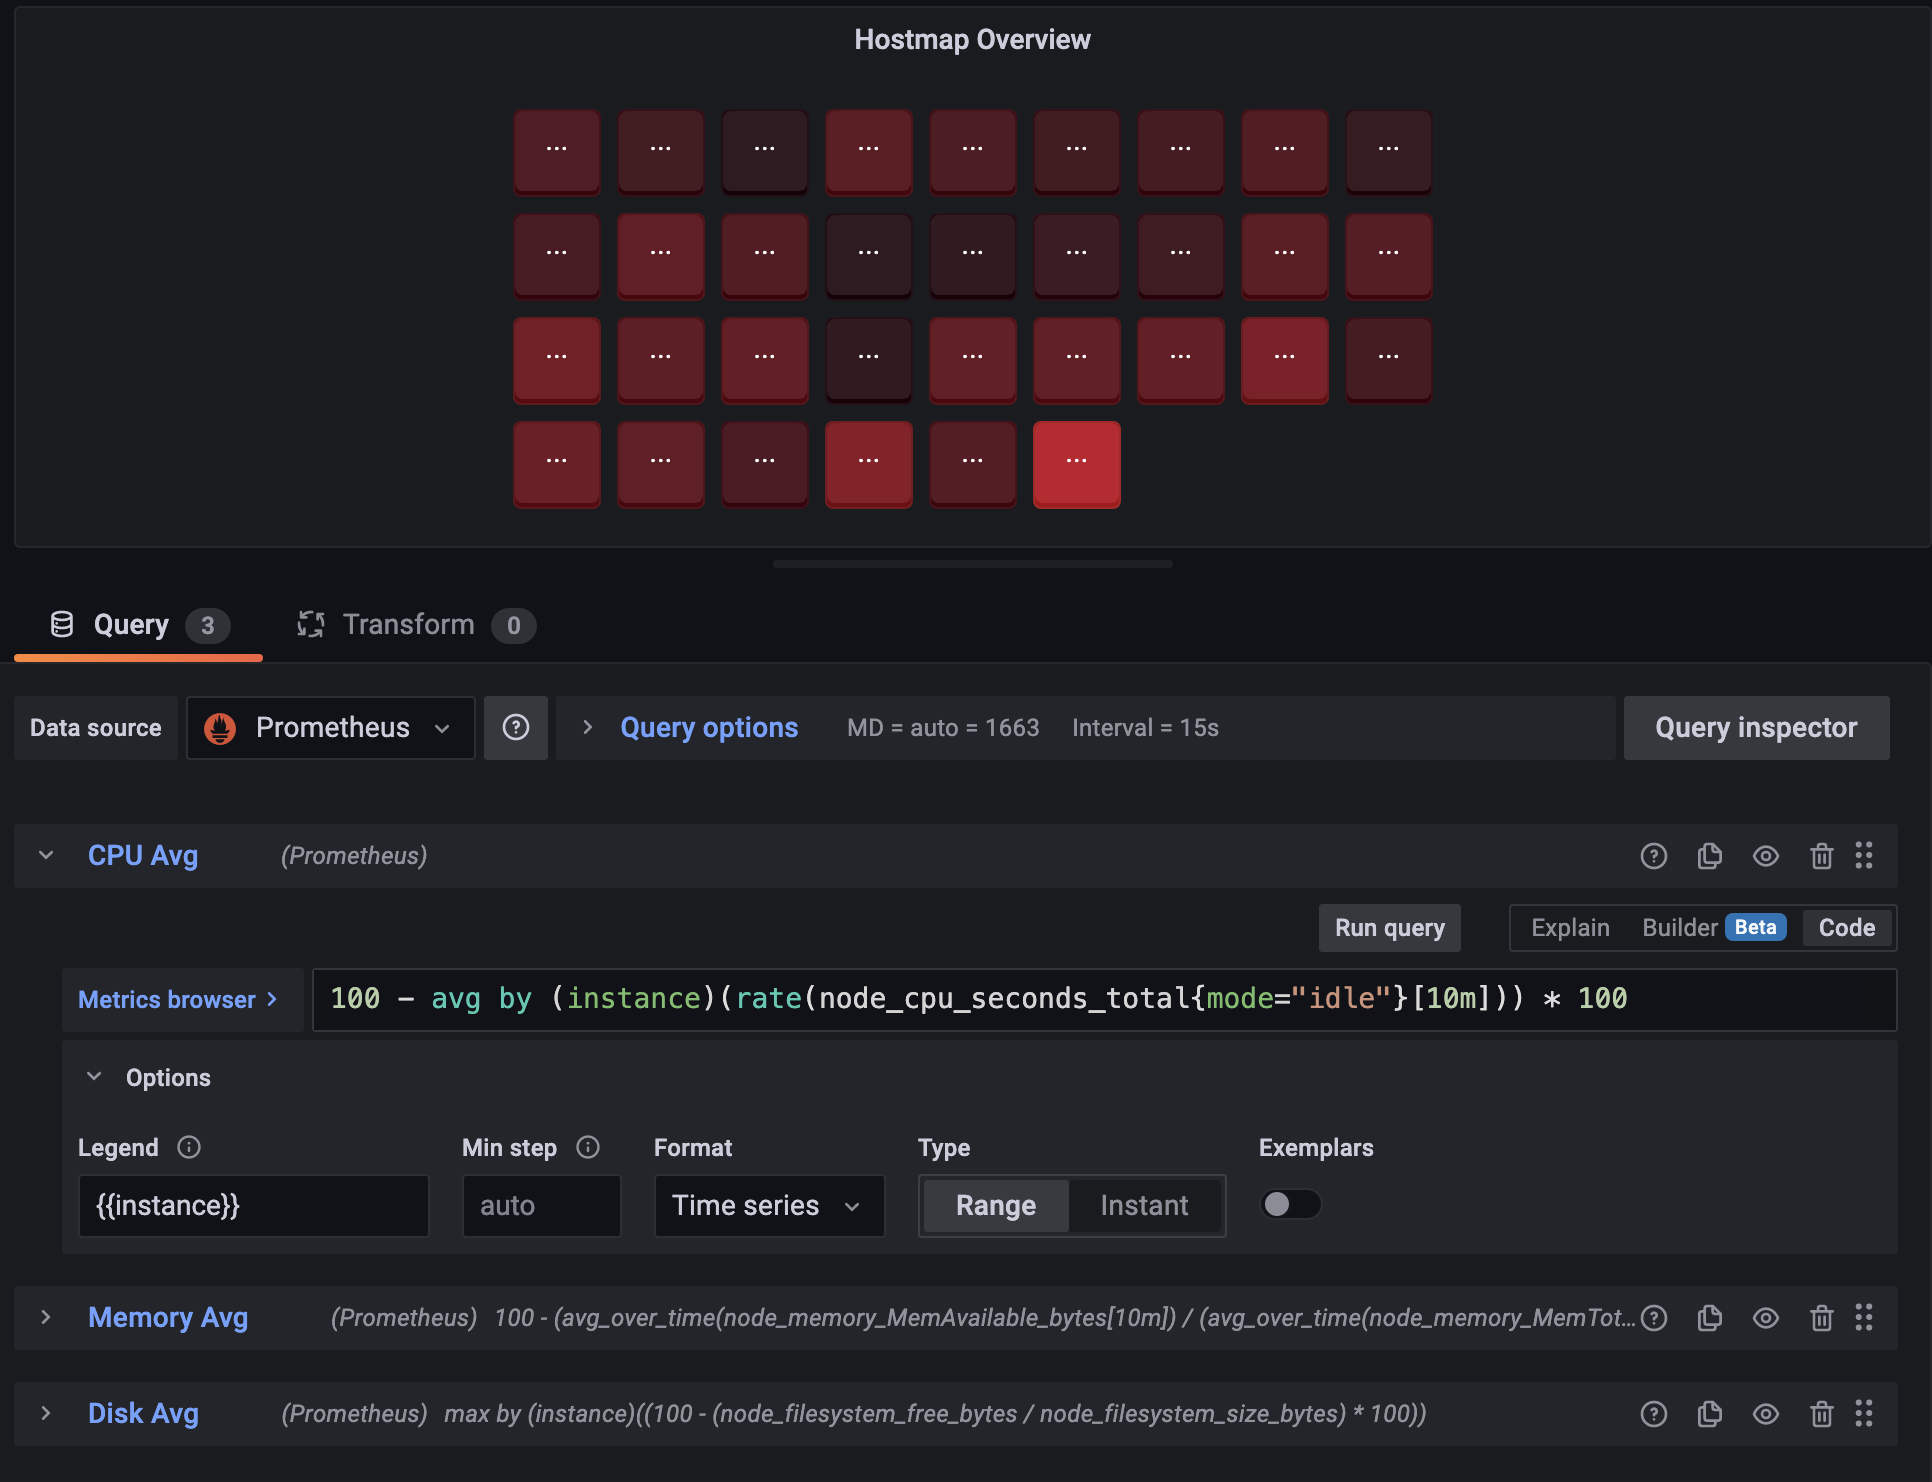
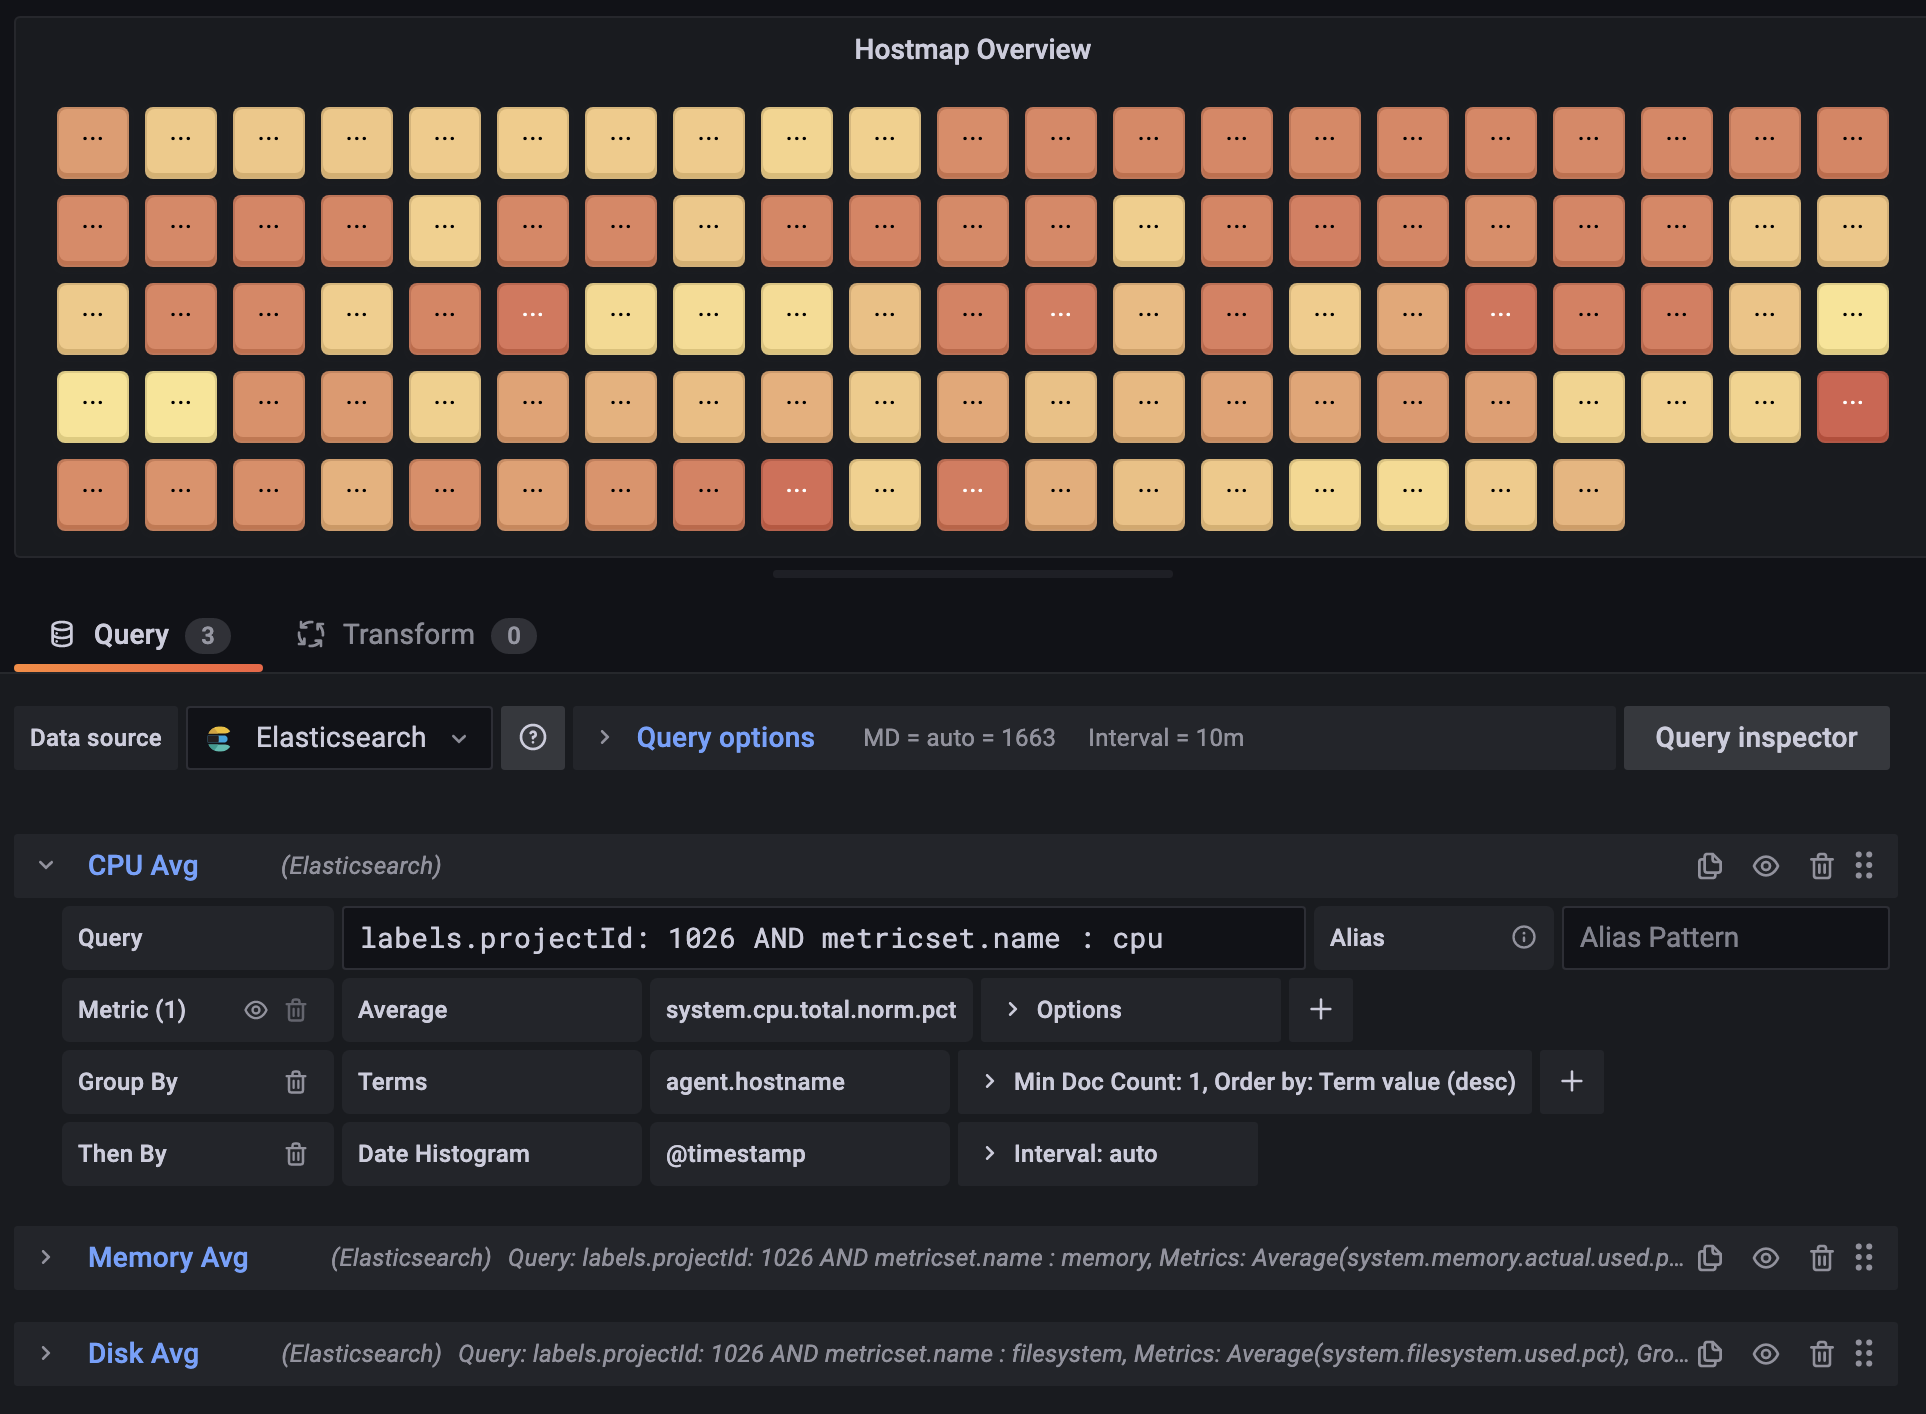
HostItem is rendered in response to panel size, and Color Threshold is mapped to the largest value.