This repository holds the backend services for the Never Expires app, available on the App Store. The app is helping to track when saved food gets bad and reminds to use it before the expiration date. You can download Never Expires from the App Store.
The entire project was built using Go and standard net/http package, avoiding any frameworks. This choice was made to manually implement server aspects like auth and other middlewares, allowing a deeper understanding of their internal workings and learning on how each component operates and interacts within the system.
- Go
- Docker Compose
- Nginx: For routing and managing HTTP requests
- PostgreSQL & Redis: Employed as databases
- RabbitMQ: Managing the email queue
- Grafana & Prometheus: Utilized for system monitoring
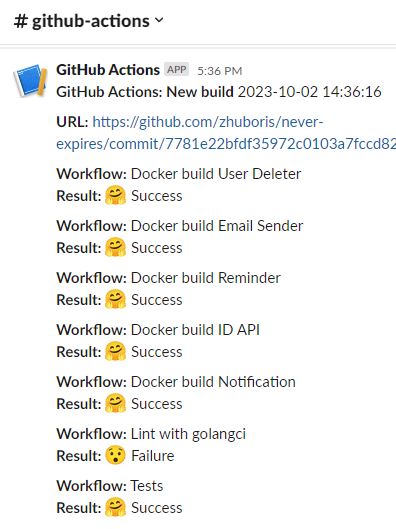
- GitHub Actions: Implementing CI/CD
- Swagger: For documenting the APIs
-
Authentication API: Manages user authentication and sessions. Detailed Swagger documentation is available here.
-
App Logic API: Manages the core logic for handling products' information. Swagger documentation can be viewed here.
This component reads messages from a RabbitMQ queue that other services can add. The message contains recipient and email raw email to send email out.
Operates on a schedule, processing data from the database and sending out push notifications accordingly.
When a user deletes an account, Authentication API immediately deletes them from its controlled database.
This service purpose is to notify other services that using Authentication API about deleted users and let them do with this information everything they want.
Also operates on a schedule.
The monitoring system is implemented using Grafana and Prometheus. It is using standard dashboards for routine exporters and
a customized dashboard to monitor the APIs within this project.
This dashboard tracks distinct custom metrics like count of processed bad requests with internal error statuses.
- Name: Boris Zhuravel
- Email: borisjuravel@gmail.com
- Telegram: https://t.me/zhuboris


