Skip to content

zmoon/vorts

Repository files navigation

vorts

Integrate a system of N point vortices.

Tests status Project Status: Suspended – Initial development has started, but there has not yet been a stable, usable release; work has been stopped for the time being but the author(s) intend on resuming work.

  • pdoc3 documentation: zmoon.github.io/vorts
  • GitHub: zmoon/vorts
  • Examples:
    • Launch Binder – JupyterLab interface (need to right click on a *.py to open as notebook)
    • Launch Binder – Jupyter Notebook interface (just double click on a *.py to open as notebook)

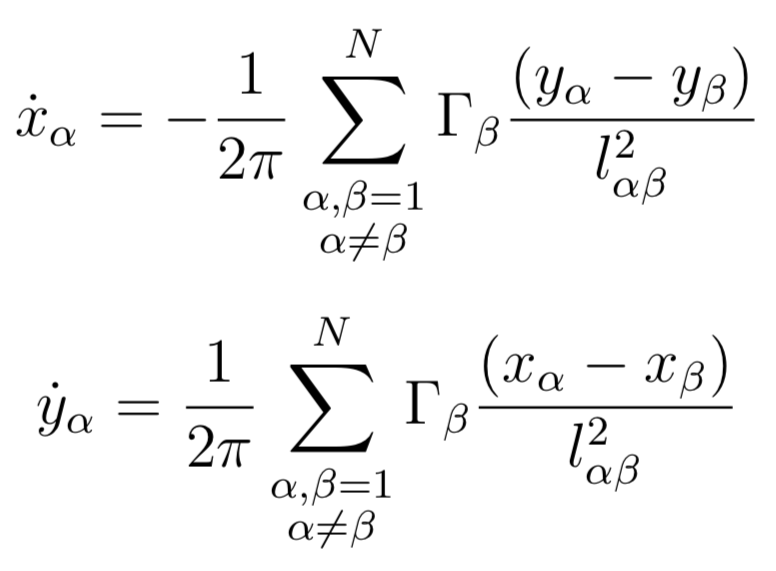
Equations

Point vortex equations

Example visualizations

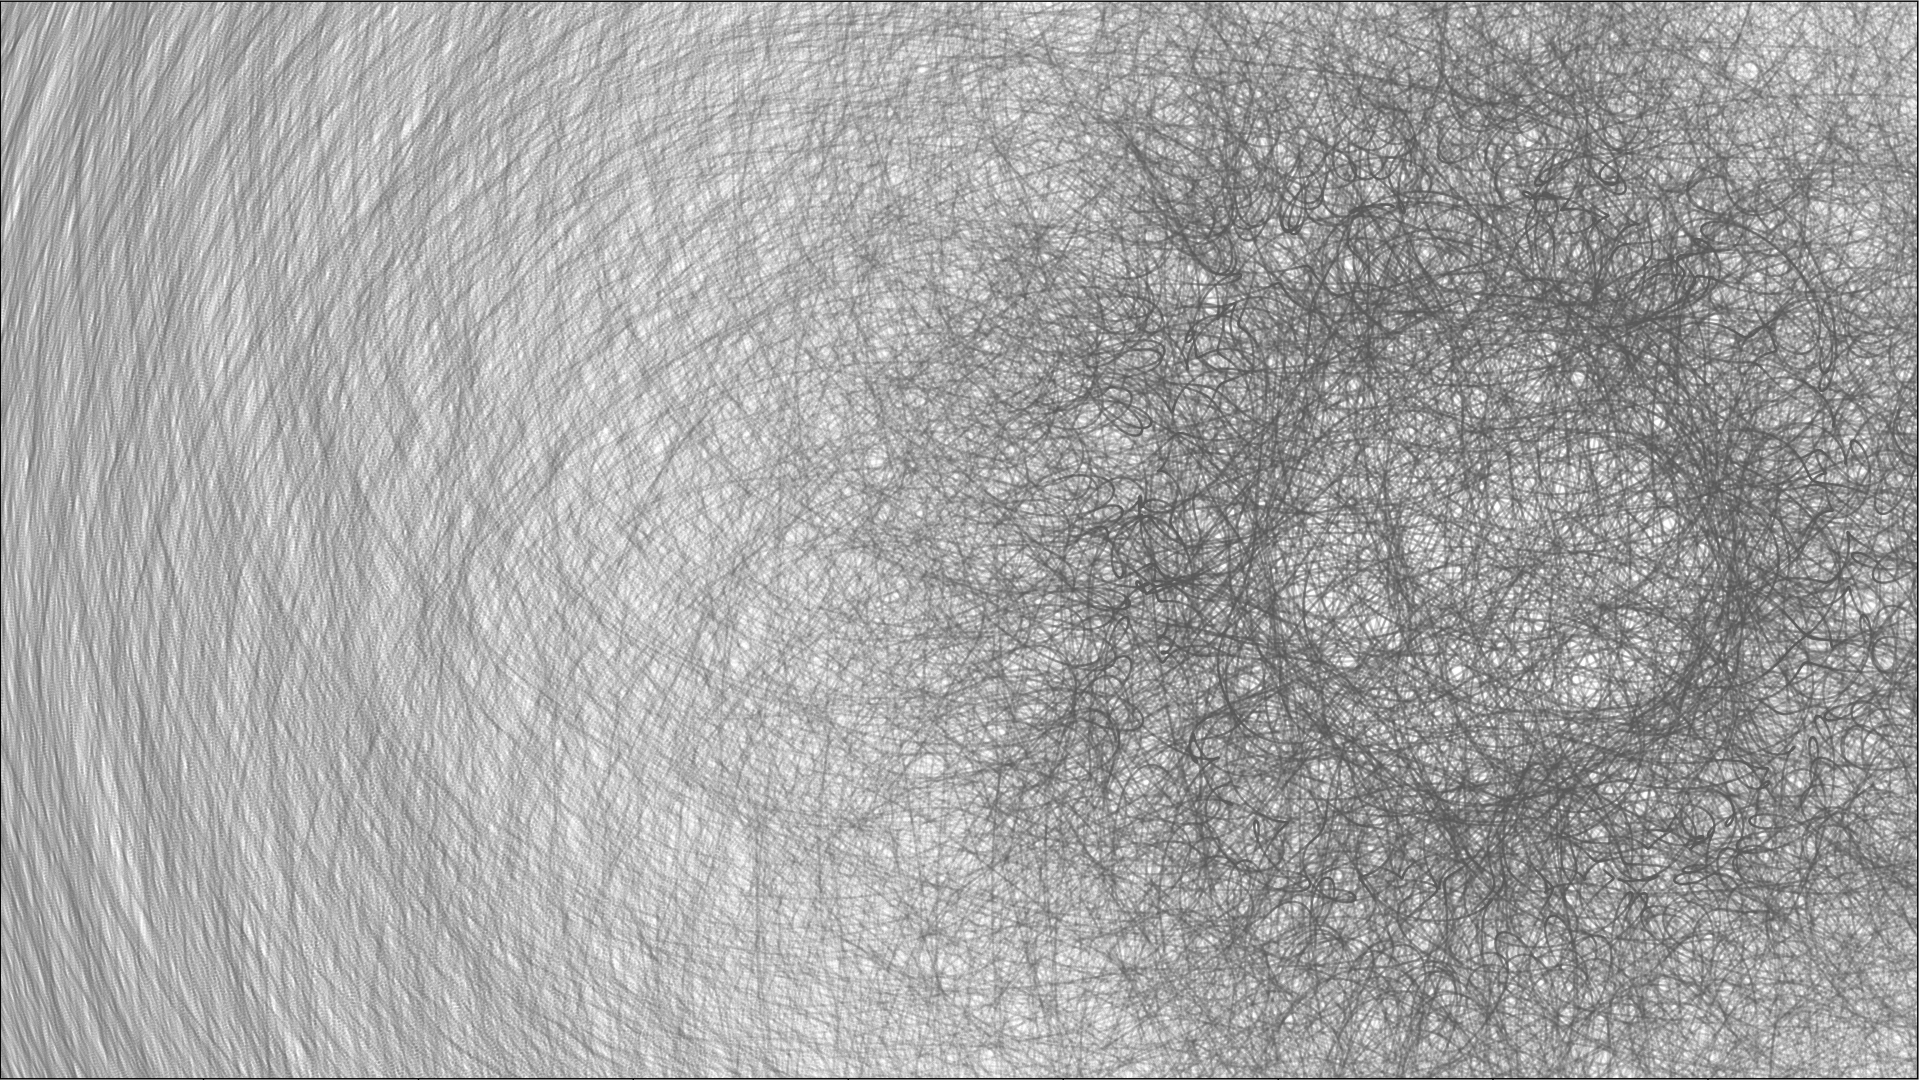
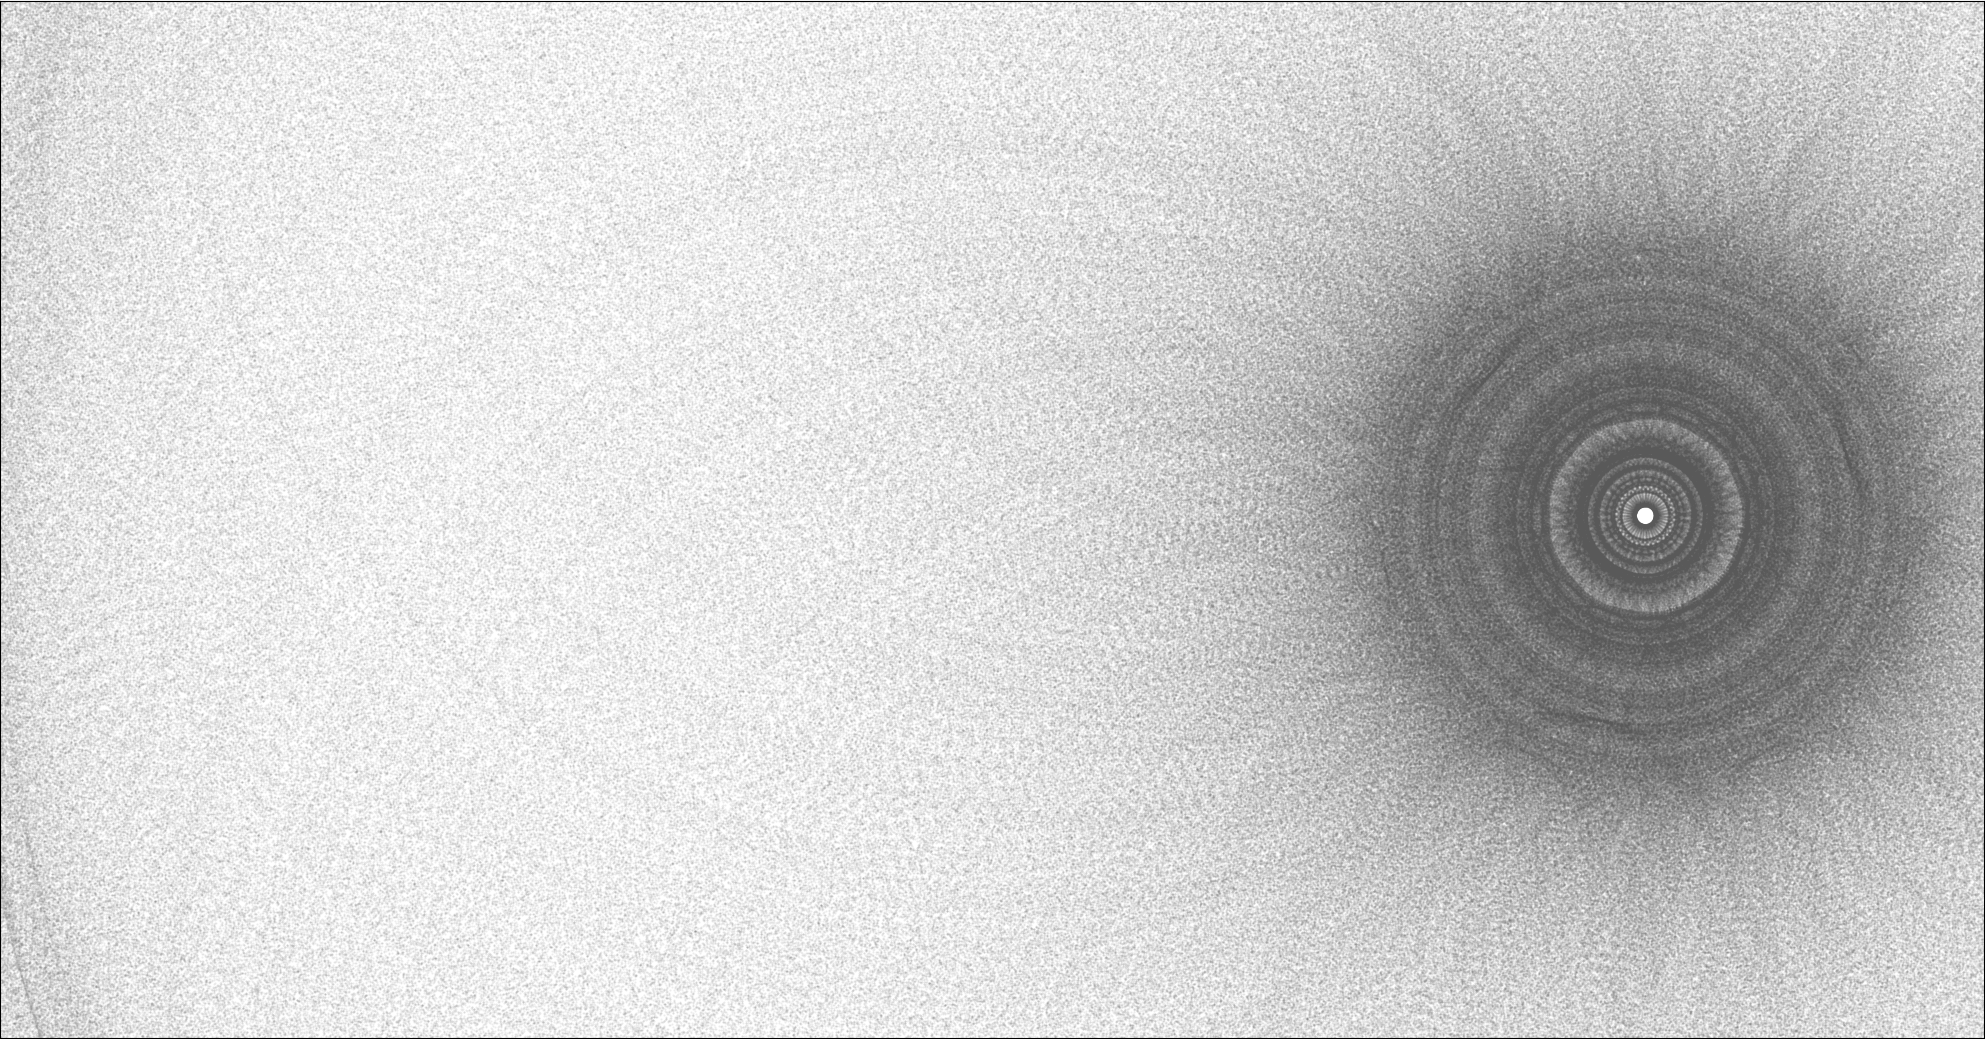
Releasing tracers into the rotating N-vortex system:

Tracer art example 1
Tracer art example 2

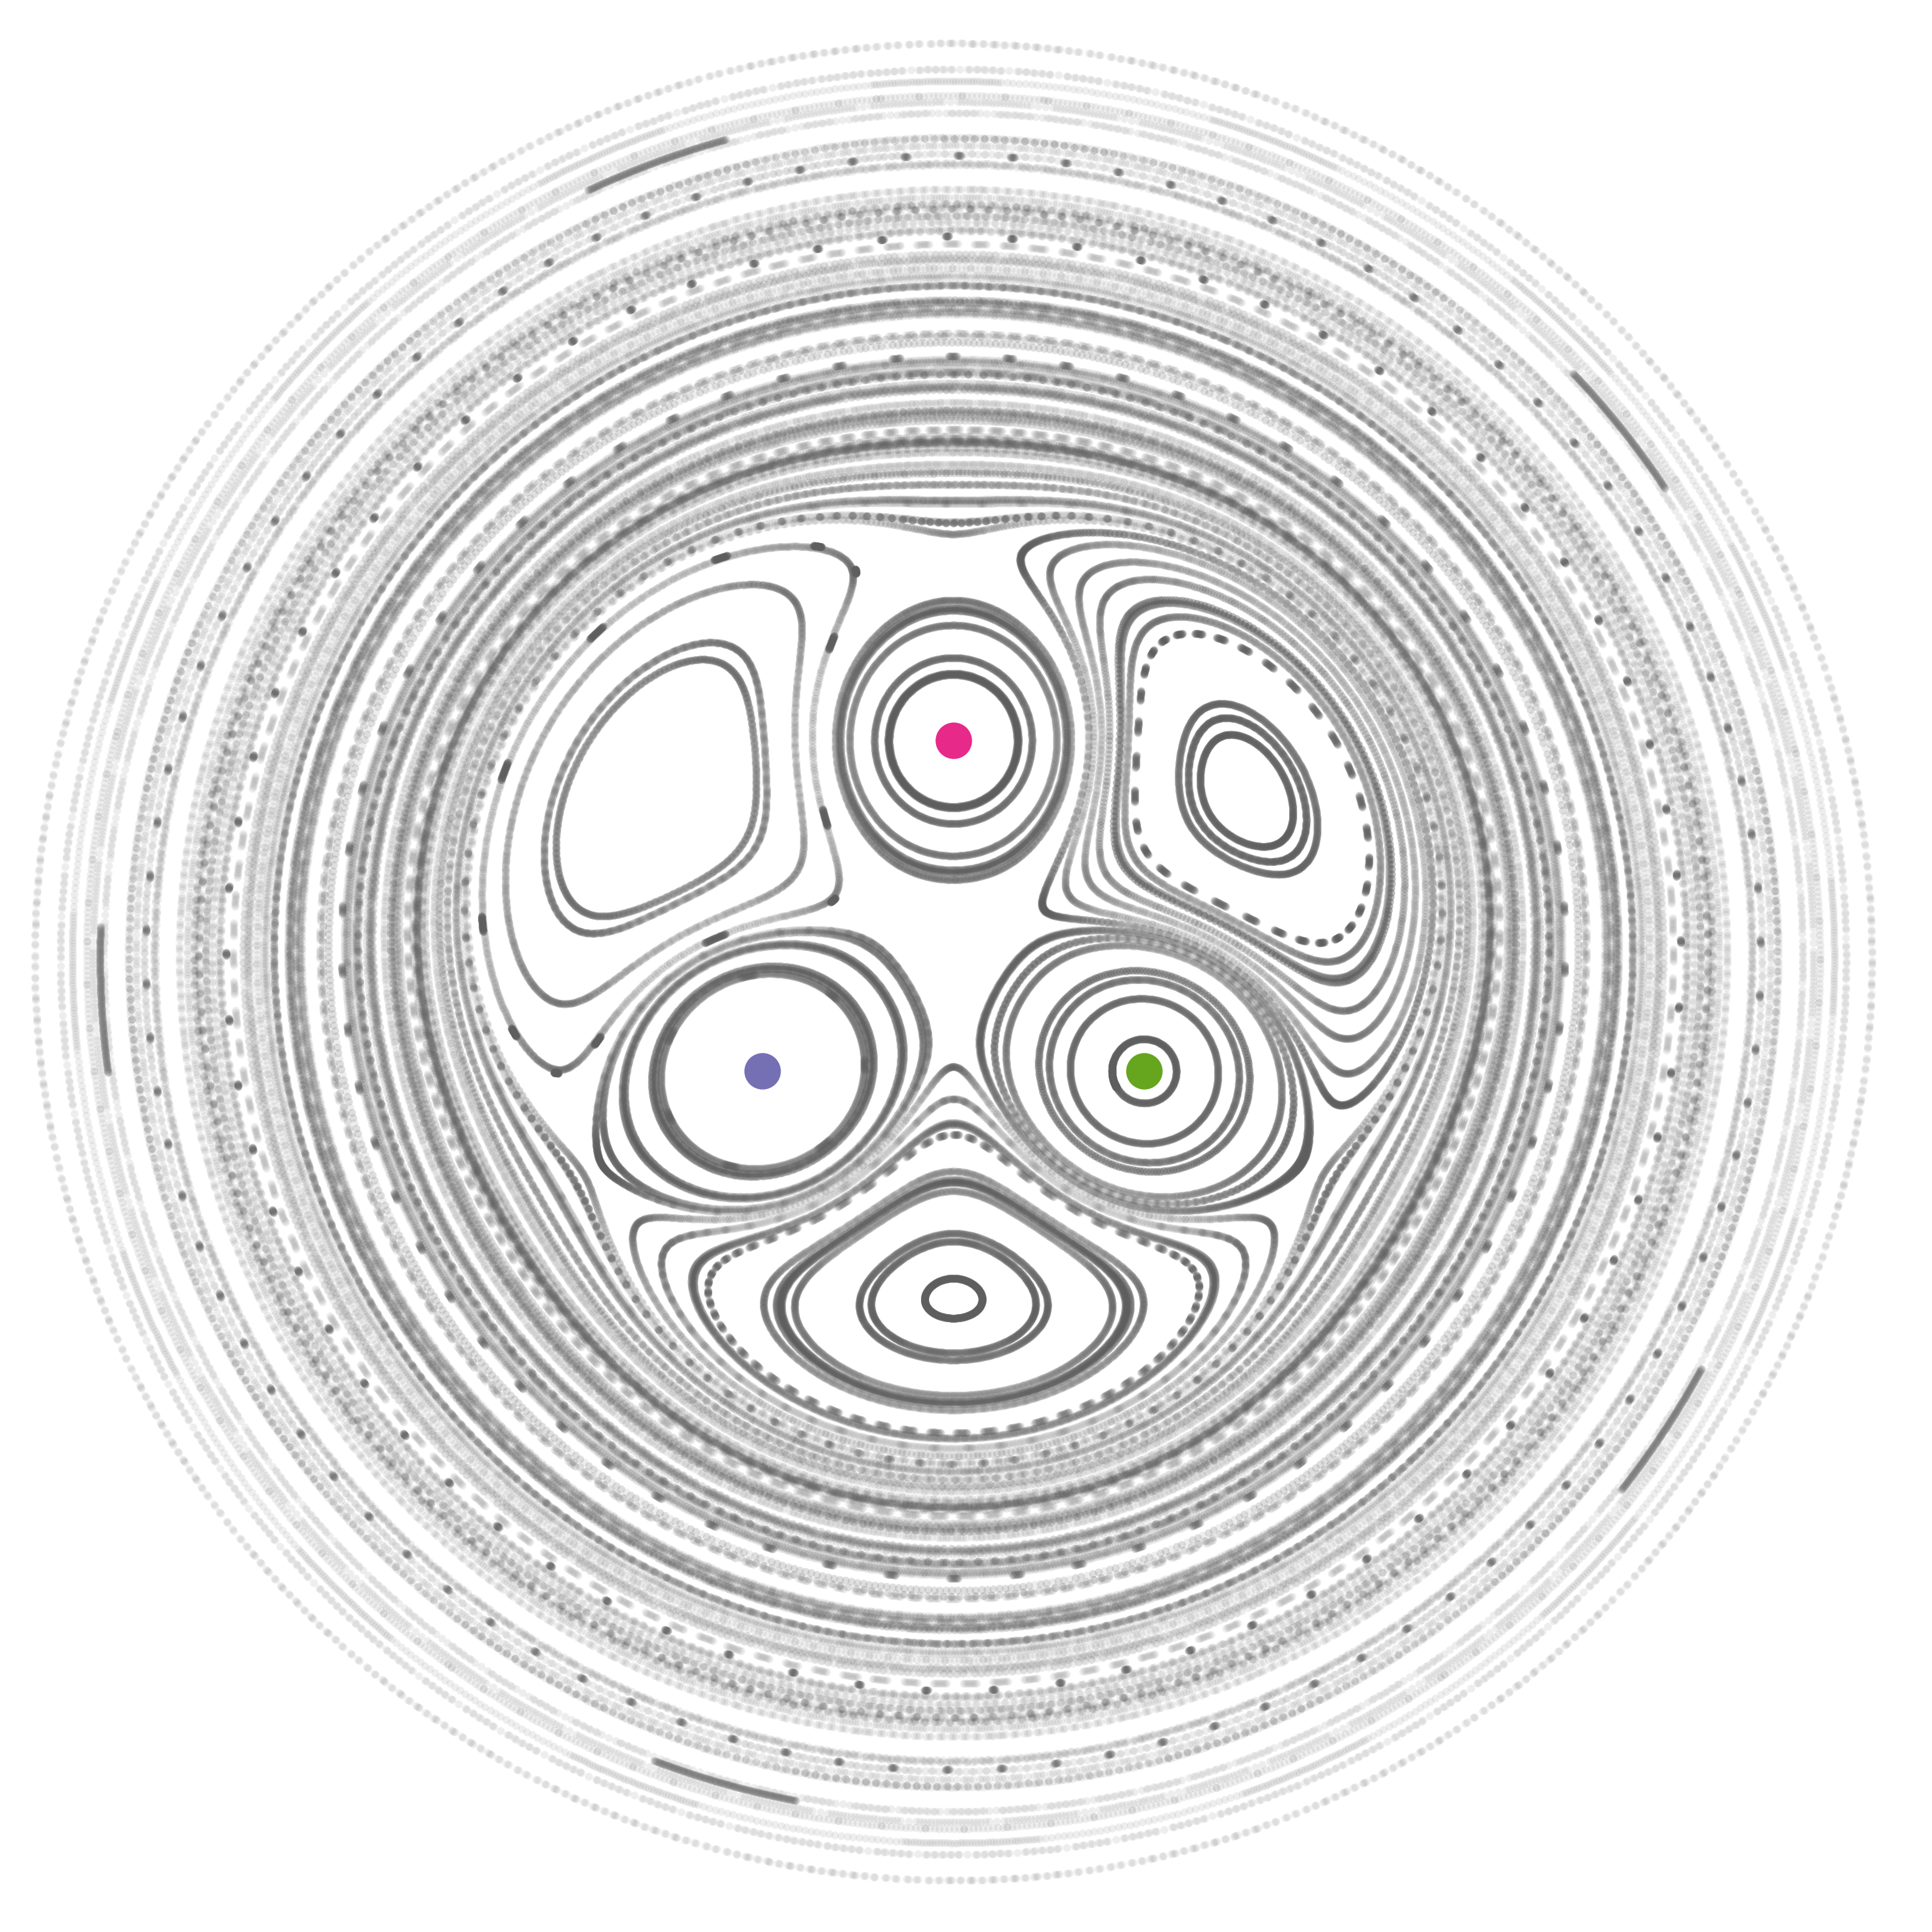
Poincaré plots. Given a sufficiently long run with a large number (e.g. 100) of tracers, you can make pretty pictures like this:

Example Poincaré section plot

Notes

Originally created for the PSU class METEO 523 – Modeling the climate system.
About

Integrate and visualize a system of point vortices

Resources

Stars

Watchers

Forks

Releases

No releases published

Packages

No packages published

Contributors 4

  •  
  •  
  •  
  •