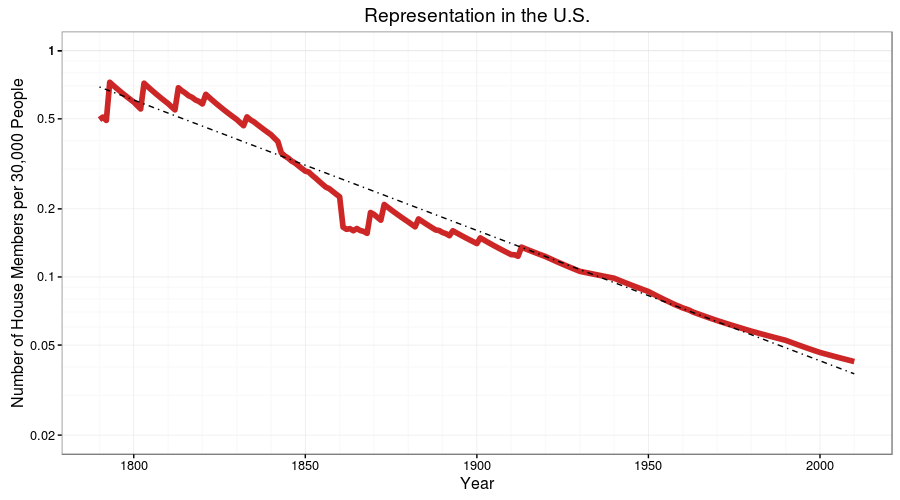
The Congress froze the number of House members at 435 with the Reapportionment Act of 1911. The house reached 435 representatives in 1912. Since then, the U.S. population has increased from 92.2 million in 1910 to 309 million in 2010, more than tripling in size without any increase in the number of representatives.
In the US Constitution, it states that the number of House Representatives shall not exceed one in 30,000. While the 2010 value of 1 in 709,760 technically qualifies as "not exceeding 1 in 30,000", it seems to be a far-cry from the original framers' intents. The House member's average Constituency from 1789 to 1825 was about 48,700. If we were to follow that precedent, we would have 6,300 House members.
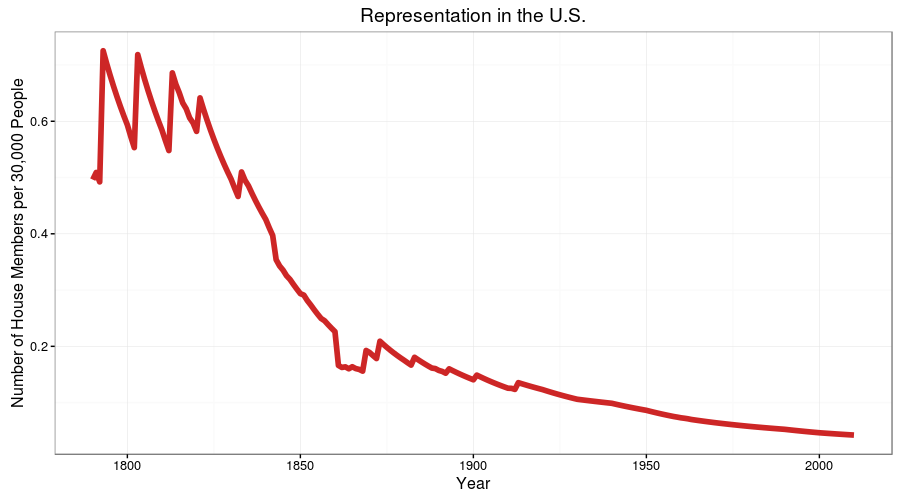
Listed below is a plot of the rapid decline in the voter's power of representation. I used a semilog Y-axis on the first plot, because a linear Y-axis resulted in the voter's representation after 1900 as being relatively microscopic.
- https://en.wikipedia.org/wiki/History_of_the_United_States_House_of_Representatives#Number_of_Representatives
- http://www.census-charts.com/Population/pop-us-1790-2000.html
- http://www.census.gov/prod/cen2010/briefs/c2010br-01.pdf
- R
- ggplot2