Home
Welcome to Expression Tree Visualizer. This is a Visual Studio debugging visualizer for inspecting expression trees (and related types):
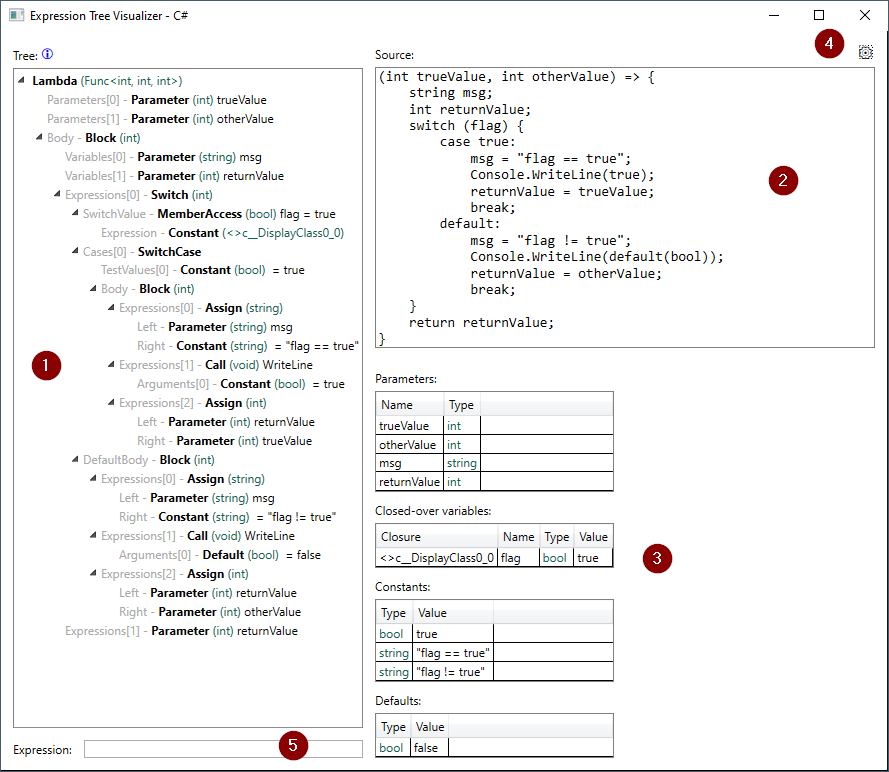
The UI consists of the following parts:
- Treeview showing the structure of the expression tree
- Source code representation of the tree, using the string rendering library
-
End nodes -- expressions that aren't composed of other expressions:
- Parameters of lambda expressions
- Closed-over variables from an outside scope
- Constant values
- Default values of the specified type
- Settings
- Debugged expression, used by the Copy watch expression command
Each end node type has various properties, but not all properties are relevant to all end node types, e.g. parameters don't have a value, because the value is passed into the function call:
| Name | Type | Value | Closure | |
|---|---|---|---|---|
| Description | CLR type of the expression which the node represents |
CLR type of closure container/sup> | ||
| Parameters | y | y | ||
| Closed-over variables | y | y | y | y |
| Constants | y | y | ||
| Defaults | y | y |
Note that even though closed-over variables are technically member-access expressions (on a compiler-generated hidden class instance), it's more useful to treat them as end nodes.
Click the gear:
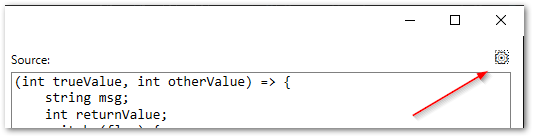
to open the settings popup:
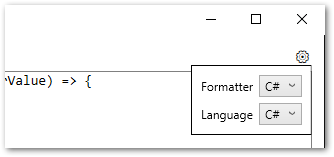
The Renderer and Language settings correspond to the renderer and language parameters used by the string rendering library.
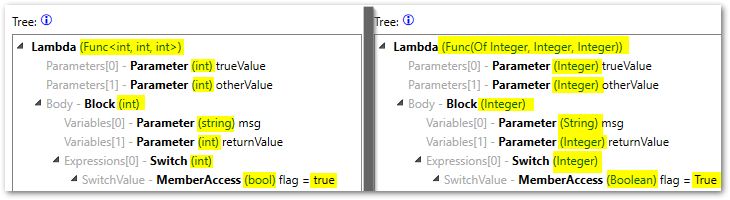
Note that the Language setting also affects how types and literals are shown in the rest of the visualizer, e.g. (int vs. Integer, and true vs. True):