
- First of all, thanks a lot for wesnolte's great work:blush: -- jOrgChart. The thought that using nested tables to build out the tree-like orgonization chart is amazing. This idea is more simple and direct than its counterparts based on svg.
- Unfortunately, it's long time not to see the update of jOrgChart. on the other hand, I got some interesting ideas to add, so I choose to create a new repo.
- Font Awesome provides us with administration icon, second level menu icon and loading spinner.
- Supports both local data and remote data (JSON).
- Smooth expand/collapse effects based on CSS3 transitions.
- Align the chart in 4 orientations.
- Allows user to change orgchart structure by drag/drop nodes.
- Allows user to edit orgchart dynamically and save the final hierarchy as a JSON object.
- Supports exporting chart as a picture.
- Supports pan and zoom
- Users can adopt multiple solutions to build up a huge organization chart(please refer to multiple-layers or hybrid layout sections)
- touch-enabled plugin for mobile divice
npm install
gulp build
gulp serve
Now, you can try out all the demos on http://localhost:3000.
Note: your nodejs version should be 4+.
- using ul datasource(this feature comes from Tobyee's good idea:blush:)
<!-- wrap the text node with <a href="#"> , <span>, blabla is also OK. Note:text node must immediately follow the <li> tag, with no intervening characters of any kind.  -->
<ul id="ul-data">
  <li>Lao Lao
    <ul>
      <li>Bo Miao</li>
      <li>Su Miao
        <ul>
          <li>Tie Hua</li>
          <li>Hei Hei
            <ul>
              <li>Pang Pang</li>
              <li>Xiang Xiang</li>
            </ul>
          </li>
        </ul>
      </li>
    </ul>
  </li>
</ul>
let orgchart = new OrgChart({
'data' : '#ul-data'
});
document.querySelector('#chart-container').appendChild(orgchart);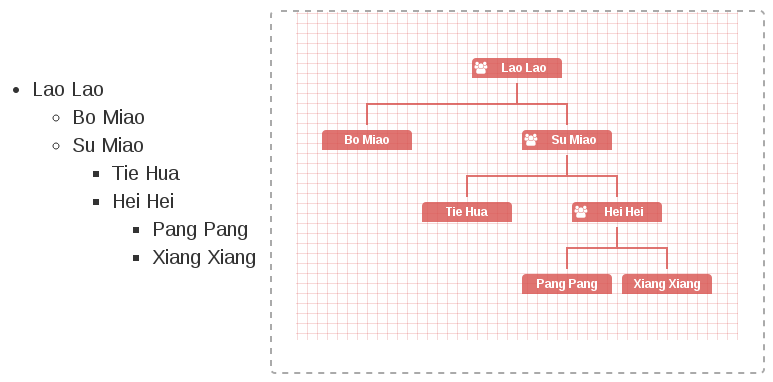
let datascource = {
  'name': 'Lao Lao',
  'title': 'general manager',
  'children': [
    { 'name': 'Bo Miao', 'title': 'department manager' },
    { 'name': 'Su Miao', 'title': 'department manager',
      'children': [
        { 'name': 'Tie Hua', 'title': 'senior engineer' },
        { 'name': 'Hei Hei', 'title': 'senior engineer',
          'children': [
            { 'name': 'Pang Pang', 'title': 'engineer' },
            { 'name': 'Xiang Xiang', 'title': 'UE engineer' }
          ]
        }
      ]
    },
    { 'name': 'Yu Jie', 'title': 'department manager' },
    { 'name': 'Yu Li', 'title': 'department manager' },
    { 'name': 'Hong Miao', 'title': 'department manager' },
    { 'name': 'Yu Wei', 'title': 'department manager' },
    { 'name': 'Chun Miao', 'title': 'department manager' },
    { 'name': 'Yu Tie', 'title': 'department manager' }
  ]
},
orgchart = new OrgChart({
  'data' : datascource,
  'depth': 2,
  'nodeContent': 'title'
});
document.querySelector('#chart-container').appendChild(orgchart);
-
I wanna align orgchart with different orientation(this feature comes from the good idea of fvlima and badulesia 😊)
Top to Bottom -- default direction, as you can see all other examples on this page.
// sample of core source code
let orgchart = new OrgChart({
  'data' : datascource,
  'nodeContent': 'title',
  'direction': 'b2t'
});
document.querySelector('#chart-container').appendChild(orgchart);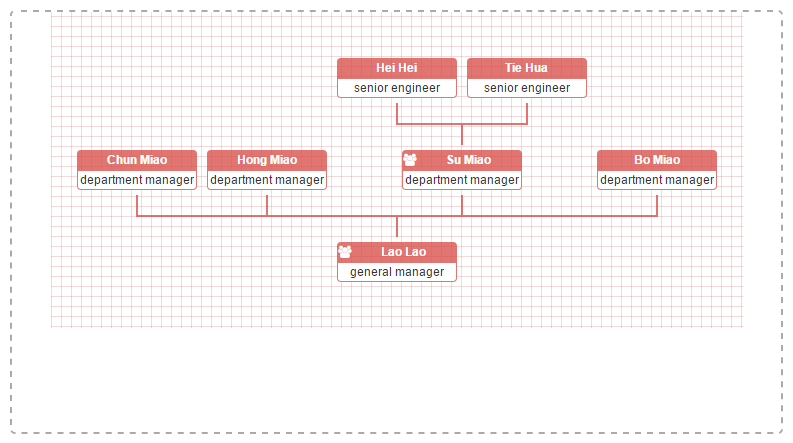
// sample of core source code
let orgchart = new OrgChart({
  'data' : datascource,
  'nodeContent': 'title',
  'direction': 'l2r'
});
document.querySelector('#chart-container').appendChild(orgchart);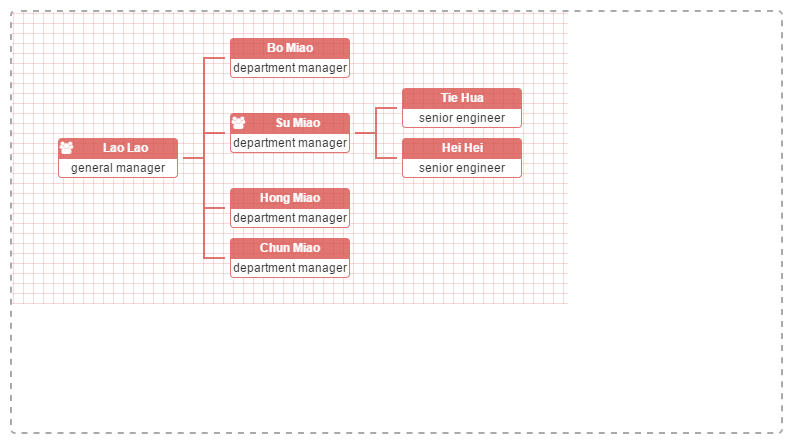
// sample of core source code
let orgchart = new OrgChart({
  'data' : datascource,
  'nodeContent': 'title',
  'direction': 'r2l'
});
document.querySelector('#chart-container').appendChild(orgchart);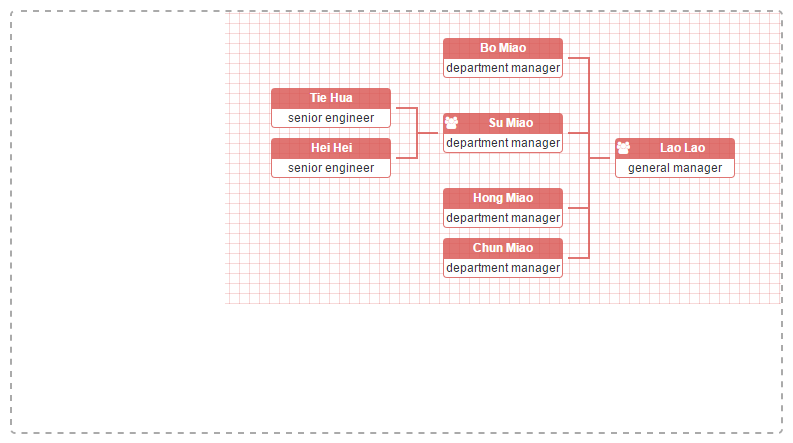
// sample of core source code
let orgchart = new OrgChart({
  'data' : datascource,
  'nodeContent': 'title',
  'toggleSiblingsResp': true
});
document.querySelector('#chart-container').appendChild(orgchart);
// sample of core source code
let orgchart = new OrgChart({
  'data' : '/orgchart/initdata',
  'depth': 2,
  'nodeContent': 'title'
});
document.querySelector('#chart-container').appendChild(orgchart);
Note: when users use ajaxURL option to build orghchart, they must use json datasource(both local and remote are OK) and set the relationship property of datasource by themselves. All of these staff are used to generate the correct expanding/collapsing arrows for nodes.
// sample of core source code
let datascource = {
  'id': '1',
  'name': 'Su Miao',
  'title': 'department manager',
  'relationship': '111',
  'children': [
    { 'id': '2','name': 'Tie Hua', 'title': 'senior engineer', 'relationship': '110' },
    { 'id': '3','name': 'Hei Hei', 'title': 'senior engineer', 'relationship': '111' }
  ]
},
ajaxURLs = {
  'children': '/orgchart/children/',
  'parent': '/orgchart/parent/',
  'siblings': function(nodeData) {
    return '/orgchart/siblings/' + nodeData.id;
  },
  'families': function(nodeData) {
    return '/orgchart/families/' + nodeData.id;
  }
},
orgchart = new OrgChart({
  'data' : datascource,
  'ajaxURL': ajaxURLs,
  'nodeContent': 'title',
  'nodeId': 'id'
});
document.querySelector('#chart-container').appendChild(orgchart);
// sample of core source code
let orgchart = new OrgChart({
  'data' : datascource,
  'depth': 2,
  'nodeContent': 'title',
  'nodeID': 'id',
  'createNode': function(node, data) {
    let secondMenuIcon = document.createElement('i'),
      secondMenu = document.createElement('div');

    secondMenuIcon.setAttribute('class', 'fa fa-info-circle second-menu-icon');
    secondMenuIcon.addEventListener('click', (event) => {
      event.target.nextElementSibling.classList.toggle('hidden');
    });
    secondMenu.setAttribute('class', 'second-menu hidden');
    secondMenu.innerHTML = `<img class="avatar" src="../img/avatar/${data.id}.jpg">`;
    node.appendChild(secondMenuIcon)
    node.appendChild(secondMenu);
  }
});
document.querySelector('#chart-container').appendChild(orgchart);
Here, we need the help from html2canvas.
// sample of core source code
function clickExportButton() {
  let chartContainer = document.querySelector('#chart-container'),
    mask = chartContainer.querySelector(':scope > .mask'),
    sourceChart = chartContainer.querySelector('org-chart:not(.hidden)'),
    flag = sourceChart.classList.contains('l2r') || sourceChart.classList.contains('r2l');

  if (!mask) {
    mask = document.createElement('div');
    mask.setAttribute('class', 'mask');
    mask.innerHTML = `<i class="fa fa-circle-o-notch fa-spin spinner"></i>`;
    chartContainer.appendChild(mask);
  } else {
    mask.classList.remove('hidden');
  }
  chartContainer.classList.add('canvasContainer');
  window.html2canvas(sourceChart, {
    'width': flag ? sourceChart.clientHeight : sourceChart.clientWidth,
    'height': flag ? sourceChart.clientWidth : sourceChart.clientHeight,
    'onclone': function (cloneDoc) {
      let canvasContainer = cloneDoc.querySelector('.canvasContainer');

      canvasContainer.style.overflow = 'visible';
      canvasContainer.querySelector('org-chart:not(.hidden)').transform = '';
    }
  })
  .then((canvas) => {
    let downloadBtn = chartContainer.querySelector('.oc-download-btn');

    chartContainer.querySelector('.mask').classList.add('hidden');
    downloadBtn.setAttribute('href', canvas.toDataURL());
    downloadBtn.click();
  })
  .catch((err) => {
    console.error('Failed to export the curent orgchart!', err);
  })
  .finally(() => {
    chartContainer.classList.remove('canvasContainer');
  });
}

document.addEventListener('DOMContentLoaded', function () {

  let orgchart = new OrgChart({
    'data' : datascource,
    'depth': 2,
    'nodeContent': 'title'
  }),
  chartContainer = document.querySelector('#chart-container');

  chartContainer.appendChild(orgchart);
  // append the export button to the chart-container
  let exportBtn = document.createElement('button'),
    downloadBtn = document.createElement('a');

  exportBtn.setAttribute('class', 'oc-export-btn');
  exportBtn.innerHTML = 'Export';
  exportBtn.addEventListener('click', clickExportButton);
  downloadBtn.setAttribute('class', 'oc-download-btn');
  downloadBtn.setAttribute('download', 'MyOrgChart.png');
  chartContainer.appendChild(exportBtn);
  chartContainer.appendChild(downloadBtn);
});
Here, we fall back on OpenLayers. It's the most aewsome open-source js library for Web GIS you sholdn't miss.
// sample of core source code
let map = new ol.Map({
  layers: [
    new ol.layer.Tile({
      source: new ol.source.Stamen({
        layer: 'watercolor'
      }),
      preload: 4
    }),
    new ol.layer.Tile({
      source: new ol.source.Stamen({
        layer: 'terrain-labels'
      }),
      preload: 1
    })
  ],
  target: 'pageBody',
  view: new ol.View({
    center: ol.proj.transform([-87.6297980, 41.8781140], 'EPSG:4326', 'EPSG:3857'),
    zoom: 10
  })
});

document.body.insertBefore(document.querySelector('#chart-container'), map.getViewport());

let datascource = {
  'name': 'Lao Lao',
  'title': 'President Office',
  'position': [-87.6297980, 41.8781140],
  'children': [
    { 'name': 'Bo Miao', 'title': 'Administration  Dept.', 'position': [-83.0457540, 42.3314270]},
        { 'name': 'Su Miao', 'title': 'R & D Dept.', 'position': [-81.6943610, 41.4993200]},
        { 'name': 'Yu Jie', 'title': 'Product Dept.', 'position': [-71.0588800, 42.3600820]},
        { 'name': 'Yu Li', 'title': 'Legal Dept.', 'position': [-74.0059410, 40.7127840]},
        { 'name': 'Hong Miao', 'title': 'Finance Dept.', 'position': [-80.8431270, 35.2270870]},
        { 'name': 'Yu Wei', 'title': 'Security Dept.', 'position': [-81.6556510, 30.3321840]},
        { 'name': 'Chun Miao', 'title': 'HR Dept. ', 'position': [-81.3792360, 28.5383350]},
        { 'name': 'Yu Tie', 'title': 'Marketing Dept.', 'position': [-80.1917900, 25.7616800] }
  ]
},
orgchart = new OrgChart({
  'data' : datascource,
  'nodeContent': 'title',
  'createNode': function(node, data) {
    node.addEventListener('click', () => {
      let view = map.getView(),
        duration = 2000,
        start = +new Date(),
        pan = ol.animation.pan({
          'duration': duration,
          'source':  view.getCenter(),
          'start': start
        }),
        bounce = ol.animation.bounce({
          'duration': duration,
          'resolution': 4 * view.getResolution(),
          'start': start
        });

      map.beforeRender(pan, bounce);
      view.setCenter(ol.proj.transform(data.position, 'EPSG:4326', 'EPSG:3857'));
    });
  }
});
document.querySelector('#chart-container').appendChild(orgchart);
With the help of exposed core methods(addParent(), addSiblings(), addChildren(), removeNodes()) of orgchart plugin, we can finish this task easily.
function addNodes(orgchart) {
  let nodeVals = [];

  Array.from(document.getElementById('new-nodelist').querySelectorAll('.new-node'))
    .forEach(item => {
      let validVal = item.value.trim();

      if (validVal) {
        nodeVals.push(validVal);
      }
    });
  let selectedNode = document.getElementById(document.getElementById('selected-node').dataset.node);

  if (!nodeVals.length) {
    alert('Please input value for new node');
    return;
  }
  let nodeType = document.querySelector('input[name="node-type"]:checked');

  if (!nodeType) {
    alert('Please select a node type');
    return;
  }
  if (nodeType.value !== 'parent' && !document.querySelector('.orgchart')) {
    alert('Please creat the root node firstly when you want to build up the orgchart from the scratch');
    return;
  }
  if (nodeType.value !== 'parent' && !selectedNode) {
    alert('Please select one node in orgchart');
    return;
  }

  if (nodeType.value === 'parent') {
    if (!document.querySelector('#chart-container').children.length) {// if the original chart has been deleted
      orgchart = new OrgChart({
        'data' : { 'name': nodeVals[0] },
        'exportButton': true,
        'exportFilename': 'SportsChart',
        'parentNodeSymbol': 'fa-th-large',
        'createNode': function(node, data) {
          node.id = getId();
        }
      });
      orgchart.chart.classList.add('view-state');
    } else {
      orgchart.addParent(orgchart.querySelector('.node'), { 'name': nodeVals[0], 'Id': getId() });
    }
  } else if (nodeType.value === 'siblings') {
    orgchart.addSiblings(selectedNode, {
      'siblings': nodeVals.map(item => {
        return { 'name': item, 'relationship': '110', 'Id': getId() };
      })
    });
  } else {
    let hasChild = selectedNode.parentNode.colSpan > 1;

    if (!hasChild) {
      let rel = nodeVals.length > 1 ? '110' : '100';

      orgchart.addChildren(selectedNode, {
        'children': nodeVals.map(item => {
          return { 'name': item, 'relationship': rel, 'Id': getId() };
        })
      });
    } else {
      orgchart.addSiblings(closest(selectedNode, el => el.nodeName === 'TABLE').querySelector('.nodes').querySelector('.node'),
        { 'siblings': nodeVals.map(function(item) { return { 'name': item, 'relationship': '110', 'Id': getId() }; })
      });
    }
  }
}

document.addEventListener('DOMContentLoaded', function () {
  let orgchart,
    datascource = {
      'name': 'Ball game',
      'children': [
        { 'name': 'Football' },
        { 'name': 'Basketball' },
        { 'name': 'Volleyball' }
      ]
    };

  orgchart = new OrgChart({
    'data' : datascource,
    'exportButton': true,
    'exportFilename': 'SportsChart',
    'parentNodeSymbol': 'fa-th-large',
    'createNode': function(node, data) {
      node.id = getId();
    }
  });
  document.querySelector('#chart-container').appendChild(orgchart);

  bindEventHandler('.node', 'click', clickNode, '#chart-container');
  bindEventHandler('org-chart', 'click', clickChart, '#chart-container');
  bindEventHandler('input[name="chart-state"]', 'click', toggleViewState);
  bindEventHandler('input[name="node-type"]', 'click', toggleNodeType);
  document.getElementById('btn-add-input').addEventListener('click', addInputs);
  document.getElementById('btn-remove-input').addEventListener('click', removeInputs);
  document.getElementById('btn-add-nodes').addEventListener('click', () => addNodes(orgchart));
  document.getElementById('btn-delete-nodes').addEventListener('click', () => deleteNodes(orgchart));
  document.getElementById('btn-reset').addEventListener('click', resetPanel);

});
Users are allowed to drag & drop the nodes of orgchart when option "draggable" is assigned to true(Note: this feature doesn't work on IE due to its poor support for HTML5 drag & drop API).
Furthermore, users can make use of option dropCriteria to inject their custom limitations on drag & drop. As shown below, we don't want an manager employee to be under a engineer under no circumstance.
// sample of core source code
let orgchart = new OrgChart({
  'data' : datascource,
  'nodeContent': 'title',
  'draggable': true,
  'dropCriteria': function(draggedNode, dragZone, dropZone) {
    if(draggedNode.querySelector(':scope > .content').textContent.includes('manager') &&
      dropZone.querySelector(':scope > .content').textContent.includes('engineer')) {
      return false;
    }
    return true;
  }
});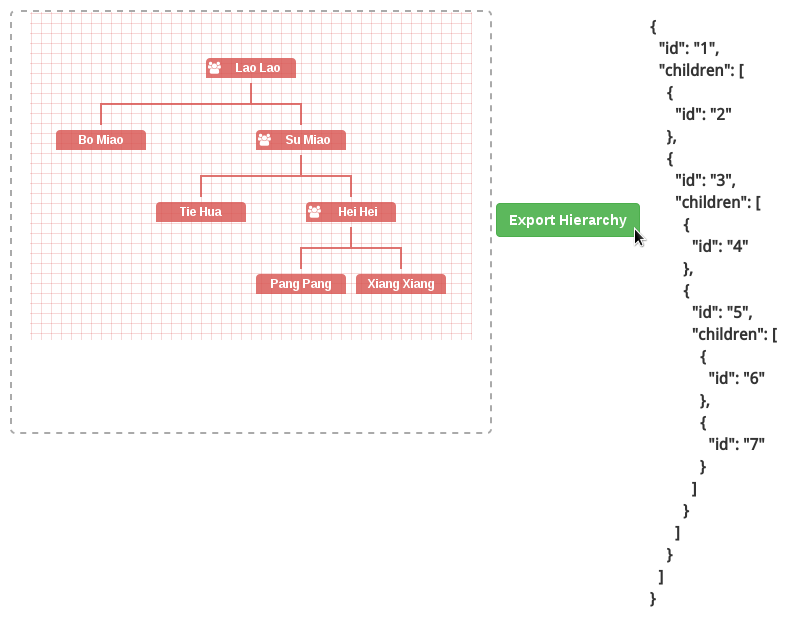
document.querySelector('#chart-container').appendChild(orgchart);That's where getHierarchy() comes in.
<ul id="ul-data">
  <li id="1">Lao Lao
    <ul>
      <li id="2">Bo Miao</li>
      <li id="3">Su Miao
        <ul>
          <li id="4">Tie Hua</li>
          <li id="5">Hei Hei
            <ul>
              <li id="6">Pang Pang</li>
              <li id="7">Xiang Xiang</li>
            </ul>
          </li>
        </ul>
      </li>
    </ul>
  </li>
</ul>
let orgchart = new OrgChart({
'chartContainer': '#chart-container',
'data' : '#ul-data'
});
document.querySelector('#chart-container').appendChild(orgchart);
document.querySelector('#btn-export-hier').addEventListener('click', () => {
if (!document.querySelector('pre')) {
let pre = document.createElement('pre'),
hierarchy = orgchart.getHierarchy();
pre.innerHTML = JSON.stringify(hierarchy, null, 2);
document.querySelector('body').insertBefore(pre, document.querySelector('.home-link'));
}
});
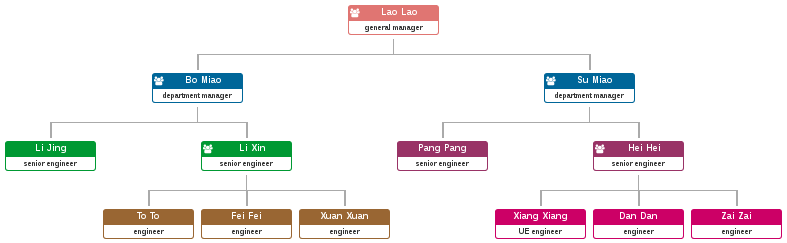
It's a so easy task, we just need to append id or className property to node data.
let datasource = {
  'name': 'Lao Lao',
  'title': 'general manager',
  'className': 'top-level',
  'children': [
    { 'name': 'Bo Miao', 'title': 'department manager', 'className': 'middle-level',
      'children': [
        { 'name': 'Li Jing', 'title': 'senior engineer', 'className': 'bottom-level' },
        { 'name': 'Li Xin', 'title': 'senior engineer', 'className': 'bottom-level' }
      ]
    }
};.orgchart .top-level .title {
background-color: #006699;
}
.orgchart .top-level .content {
border-color: #006699;
}
.orgchart .middle-level .title {
background-color: #009933;
}
.orgchart .middle-level .content {
border-color: #009933;
}
.orgchart .bottom-level .title {
background-color: #993366;
}
.orgchart .bottom-level .content {
border-color: #993366;
}
In fact, this is a wonderful solution to display a orgchart which includes a huge number of node data.
This feature is inspired by the issues(Aligning Children Vertical, Hybrid(horizontal + vertical) OrgChart). Thank mfahadi and Destructrix for their constructive suggestions:blush:
From now on, users never have to worry about how to align a huge of nodes in one screen of browser. The option "verticalDepth" allows users to align child nodes vertically from the given depth.
Note: currently, this option is incompatible with many other options or methods, like direction, drag&drop, addChildren(), removeNodes(), getHierarchy() and so on. These conflicts will be solved one by one in the later versions.
let orgchart = new OrgChart({
  'data' : datascource,
  'nodeContent': 'title',
  'verticalDepth': 3, // From the 3th level of orgchart, nodes will be aligned vertically.
  'depth': 4
});
document.querySelector('#chart-container').appendChild(orgchart);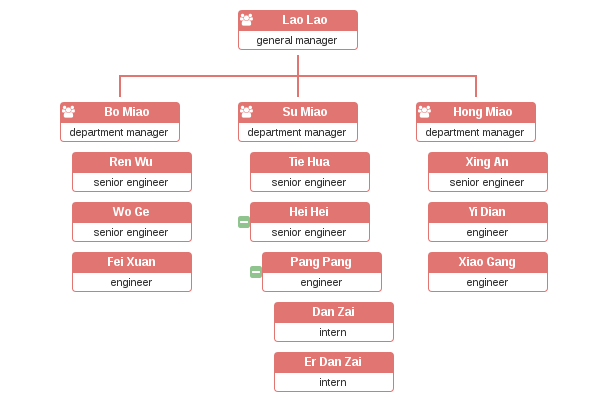
let orgchart = new OrgChart(options);{
'id': 'rootNode', // It's a optional property which will be used as id attribute of node
// and data-parent attribute, which contains the id of the parent node
'className': 'top-level', // It's a optional property which will be used as className attribute of node.
'nodeTitlePro': 'Lao Lao',
'nodeContentPro': 'general manager',
'relationship': relationshipValue, // Note: when you activate ondemand loading nodes feature,
// you should use json datsource (local or remote) and set this property.
// This property implies that whether this node has parent node, siblings nodes or children nodes.
// relationshipValue is a string composed of three "0/1" identifier.
// First character stands for wether current node has parent node;
// Scond character stands for wether current node has siblings nodes;
// Third character stands for wether current node has children node.
'children': [ // The property stands for nested nodes. "children" is just default name you can override.
{ 'nodeTitlePro': 'Bo Miao', 'nodeContentPro': 'department manager', 'relationship': '110' },
{ 'nodeTitlePro': 'Su Miao', 'nodeContentPro': 'department manager', 'relationship': '111',
'children': [
{ 'nodeTitlePro': 'Tie Hua', 'nodeContentPro': 'senior engineer', 'relationship': '110' },
{ 'nodeTitlePro': 'Hei Hei', 'nodeContentPro': 'senior engineer', 'relationship': '110' }
]
},
{ 'nodeTitlePro': 'Yu Jie', 'nodeContentPro': 'department manager', 'relationship': '110' }
],
'otherPro': anyValue
};| Name | Type | Required | Default | Description |
|---|---|---|---|---|
| chartContainer | string | no | selector usded to query the wrapper element of orgchart. It could be an id or an unique className. Note: when you want to enable pan&zoom option, you must set "chartContainer" option at the same time. | |
| data | json or string | yes | datasource usded to build out structure of orgchart. It could be a json object or a string containing the URL to which the ajax request is sent. | |
| pan | boolean | no | false | Users could pan the orgchart by mouse drag&drop if they enable this option. |
| zoom | boolean | no | false | Users could zoomin/zoomout the orgchart by mouse wheel if they enable this option. |
| direction | string | no | "t2b" | The available values are t2b(implies "top to bottom", it's default value), b2t(implies "bottom to top"), l2r(implies "left to right"), r2l(implies "right to left"). |
| verticalDepth | integer | no | Users can make use of this option to align the nodes vertically from the specified depth. | |
| toggleSiblingsResp | boolean | no | false | Once enable this option, users can show/hide left/right sibling nodes respectively by clicking left/right arrow. |
| ajaxURL | json | no | It inclueds four properites -- parent, children, siblings, families(ask for parent node and siblings nodes). As their names imply, different propety provides the URL to which ajax request for different nodes is sent. | |
| depth | positive integer | no | 999 | It indicates the level that at the very beginning orgchart is expanded to. |
| nodeTitle | string | no | "name" | It sets one property of datasource as text content of title section of orgchart node. In fact, users can create a simple orghcart with only nodeTitle option. |
| parentNodeSymbol | string | no | "fa-users" | Using font awesome icon to imply that the node has child nodes. |
| nodeContent | string | no | It sets one property of datasource as text content of content section of orgchart node. | |
| nodeId | string | no | "id" | It sets one property of datasource as unique identifier of every orgchart node. |
| createNode | function | no | It's a callback function used to customize every orgchart node. It recieves two parament: "$node" stands for jquery object of single node div; "data" stands for datasource of single node. | |
| exportButton | boolean | no | false | It enable the export button for orgchart. |
| exportFilename | string | no | "Orgchart" | It's filename when you export current orgchart as a picture. |
| chartClass | string | no | "" | when you wanna instantiate multiple orgcharts on one page, you should add diffent classname to them in order to distinguish them. |
| draggable | boolean | no | false | Users can drag & drop the nodes of orgchart if they enable this option. **Note**: this feature doesn't work on IE due to its poor support for HTML5 drag & drop API. |
| dropCriteria | function | no | Users can construct their own criteria to limit the relationships between dragged node and drop zone. Furtherly, this function accept three arguments(draggedNode, dragZone, dropZone) and just only return boolen values. |
I'm sure that you can grasp the key points of the methods below after you try out demo -- edit orgchart.
Embeds an organization chart in designated container. Accepts an options object and you can go through the "options" section to find which options are required.
Adds parent node(actullay it's always root node) for current orgchart.
| Name | Type | Required | Default | Description |
|---|---|---|---|---|
| root | dom node | yes | root node of designated orgchart | options used for overriding initial options |
| data | json object | yes | datasource for building root node |
| Name | Type | Required | Default | Description |
|---|---|---|---|---|
| node | dom node | yes | we'll add sibling nodes based on this node | |
| data | json object | yes | datasource for building sibling nodes |
| Name | Type | Required | Default | Description |
|---|---|---|---|---|
| node | dom node | yes | we'll add child nodes based on this node | |
| data | json object | yes | datasource for building child nodes |
| Name | Type | Required | Default | Description |
|---|---|---|---|---|
| node | dom node | yes | node to be removed |
| Name | Type | Required | Default | Description |
|---|---|---|---|---|
| node | dom node | Yes | None | It's the desired dom node that we'll hide its children nodes |
| Name | Type | Required | Default | Description |
|---|---|---|---|---|
| node | dom node | Yes | None | It's the desired dom node that we'll show its children nodes |
| Name | Type | Required | Default | Description |
|---|---|---|---|---|
| node | dom node | Yes | None | It's the desired dom node that we'll hide its siblings nodes |
| direction | string | No | None | Possible values:"left","rigth". Specifies if hide the siblings at left or rigth. If not defined hide both of them. |
| Name | Type | Required | Default | Description |
|---|---|---|---|---|
| node | dom node | Yes | None | It's the desired dom node that we'll show its siblings nodes |
| direction | string | No | None | Possible values:"left","rigth". Specifies if hide the siblings at left or rigth. If not defined hide both of them. |
| Name | Type | Required | Default | Description |
|---|---|---|---|---|
| node | dom node | Yes | None | It's the desired dom node that we wanna know its related nodes' display state. |
| relation | String | Yes | None | Possible values: "parent", "children" and "siblings". Specifies the desired relation to return. |
| Name | Type | Required | Default | Description |
|---|---|---|---|---|
| node | dom node | Yes | None | It's the desired that we wanna get its related nodes |
| relation | String | Yes | None | Possible values: "parent", "children" and "siblings". Specifies the desired relation to return. |
| Event Type | Attached Data | Description |
|---|---|---|
| nodedropped.orgchart | draggedNode, dragZone, dropZone | The event's handler is where you can place your customized function after node drop over. For more details, please refer to example drag & drop. |