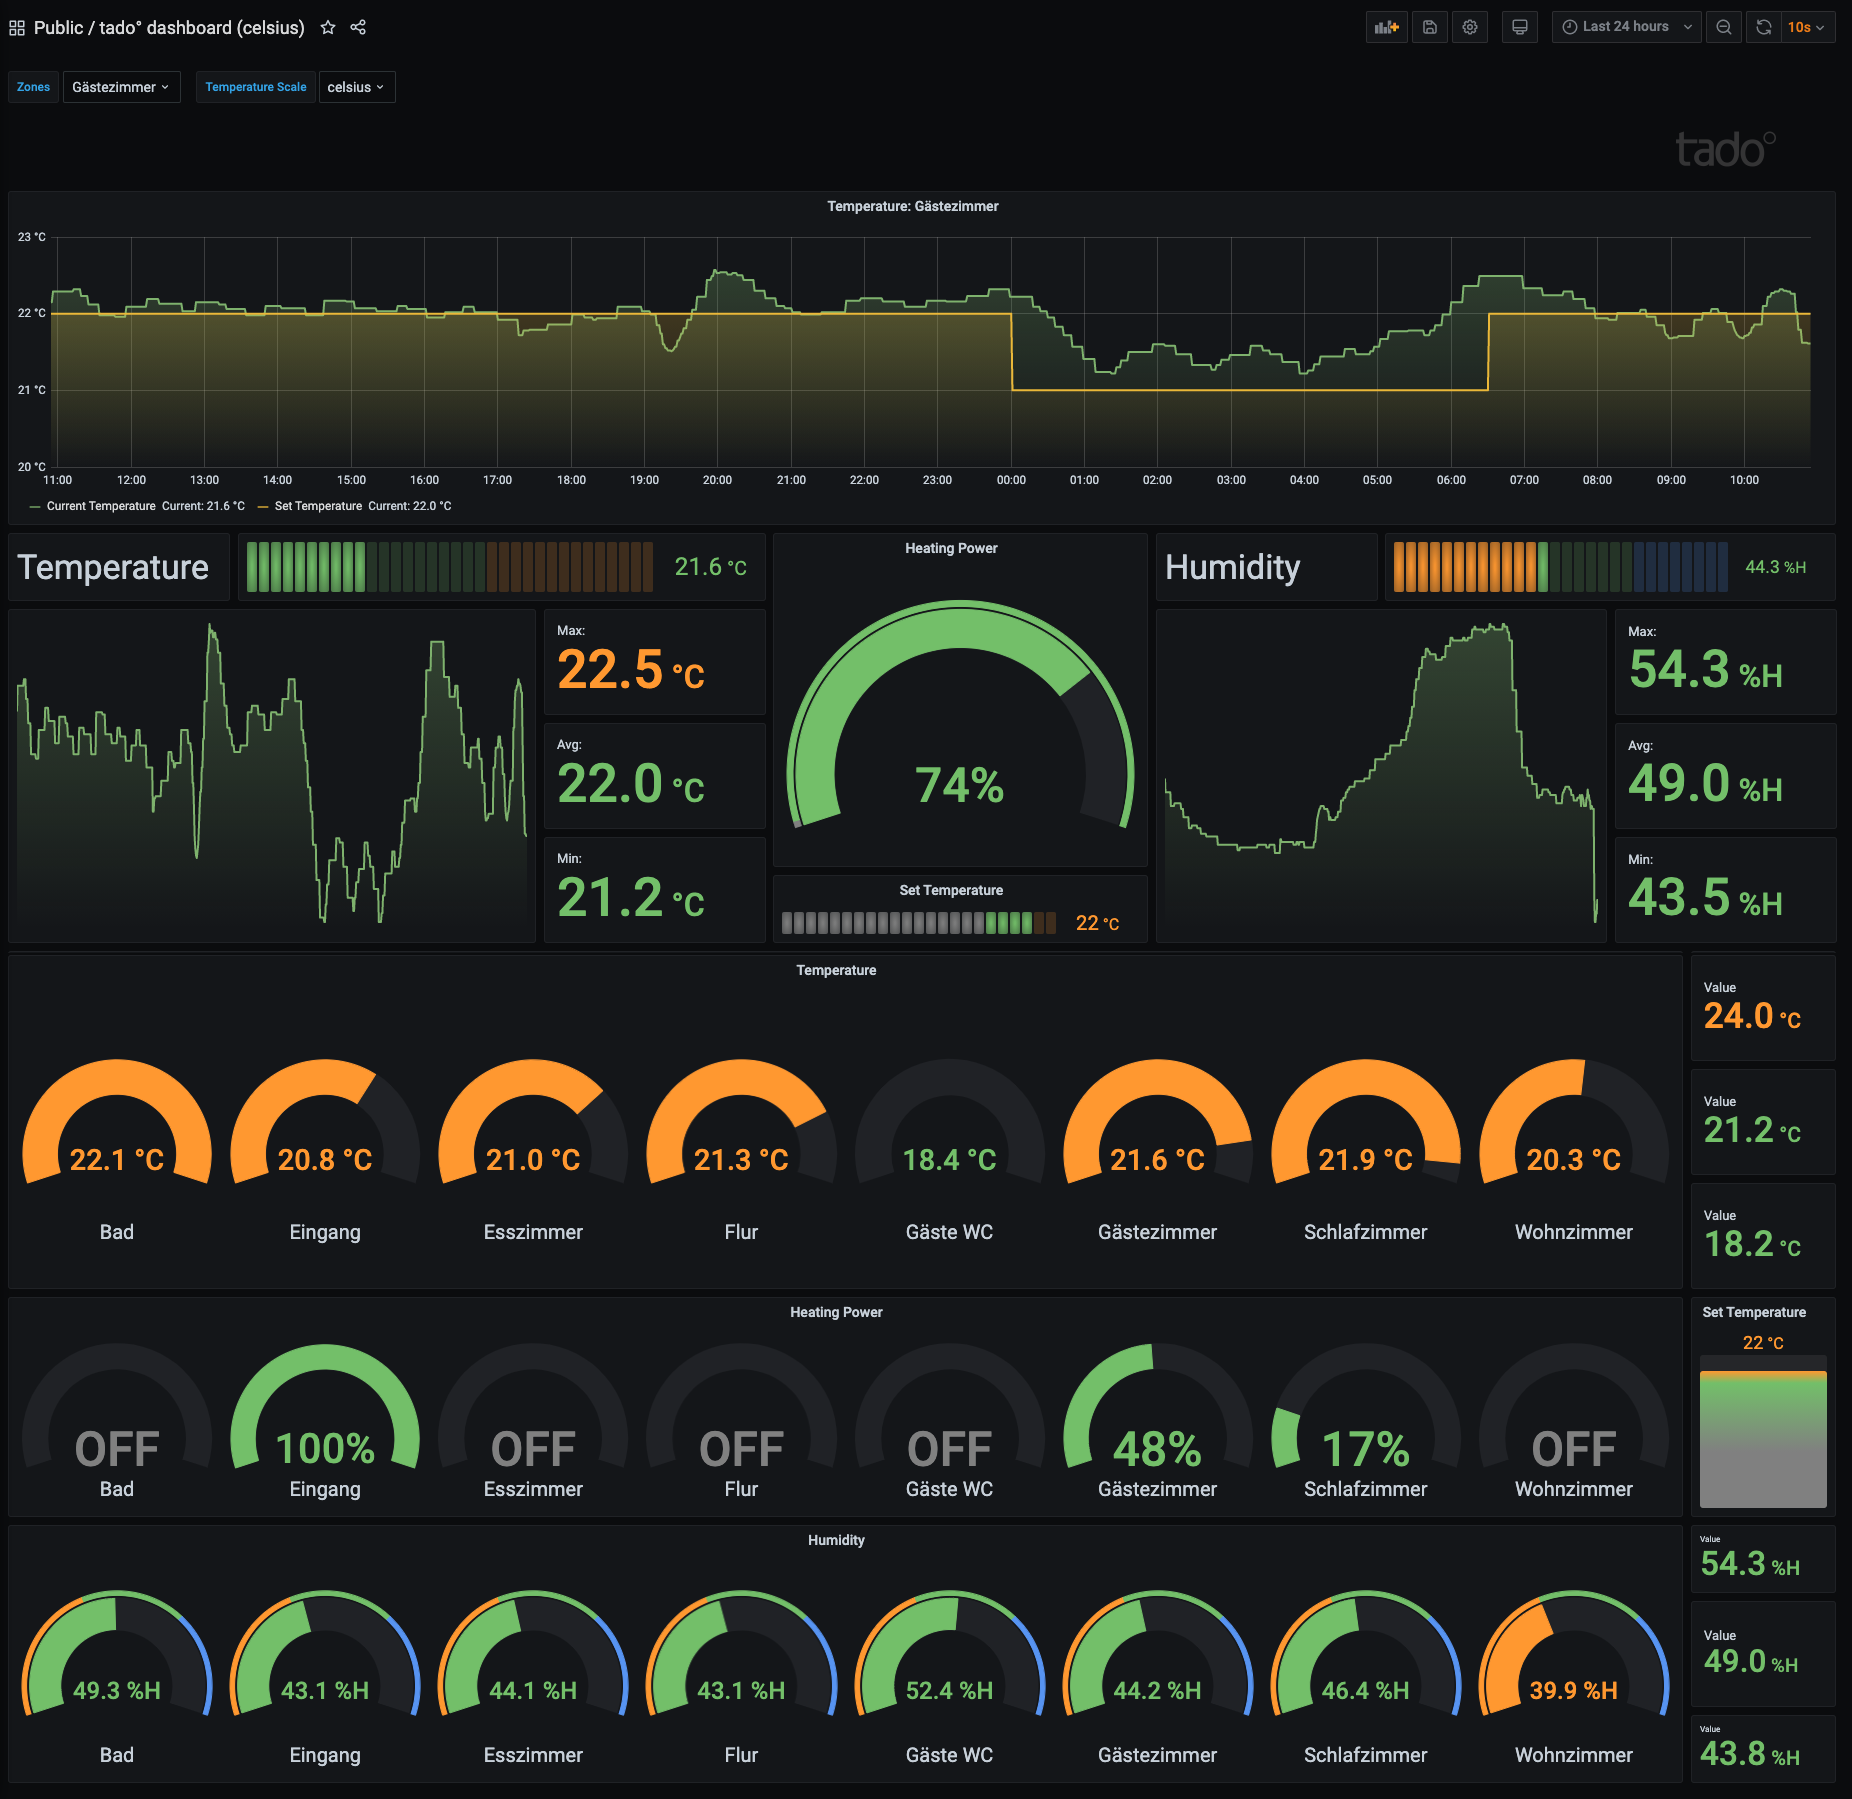
Grafana dashboard for Prometheus tado-exporter
Monitor your tado° Smart Radiator Thermostat and Temperature Sensor
Grafana dashboard for Prometheus eko/tado-exporter that shows the temperature setting, current temperature, humidity and activity for all rooms equipped with tado° Smart Radiator Thermostat and/or Temperature Sensor.
- tado° Smart Radiator Thermostat / Temperature Sensor
- Grafana instance (v7.3 or higher)
- Prometheus
- eko/tado-exporter by Vincent Composieux
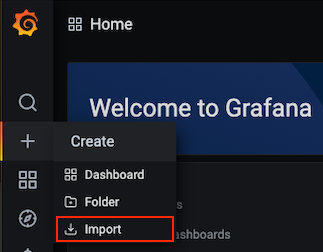
- To import a dashboard click the
+icon in the side menu of Grafana, and then click Import.
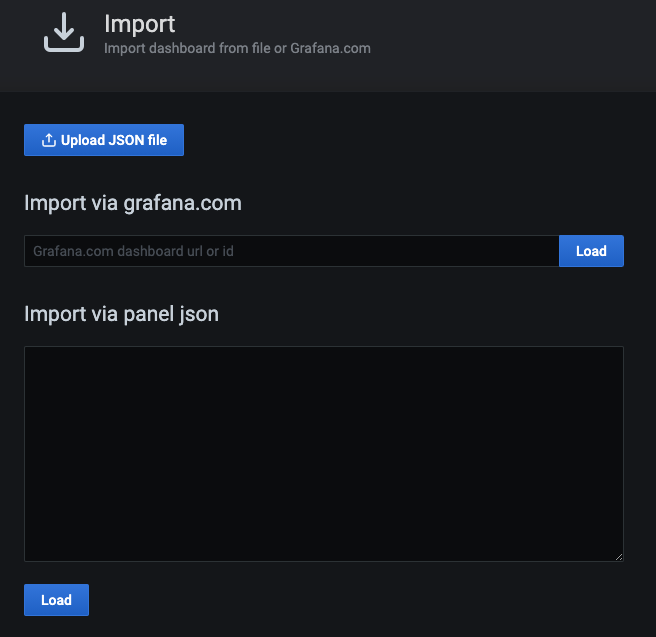
- From here you can upload the dahboard JSON file, paste a Grafana.com dashboard URL or ID or paste dashboard JSON text directly into the text area.
There are two identical dashboards that only differ in the display of the temperature scale. If the default temperature scale is changed, the unit symbol and the threshold are not automatically adjusted, which is why two independent dashboards were created for this scenario. Choose the dashboard with the desired default temperature scale for your needs.
| Temperature scale | ID | URL | JSON |
|---|---|---|---|
| Celsius | 13699 |
https://grafana.com/grafana/dashboards/13699 |
Download JSON |
| Fahrenheit | 13700 |
https://grafana.com/grafana/dashboards/13700 |
Download JSON |
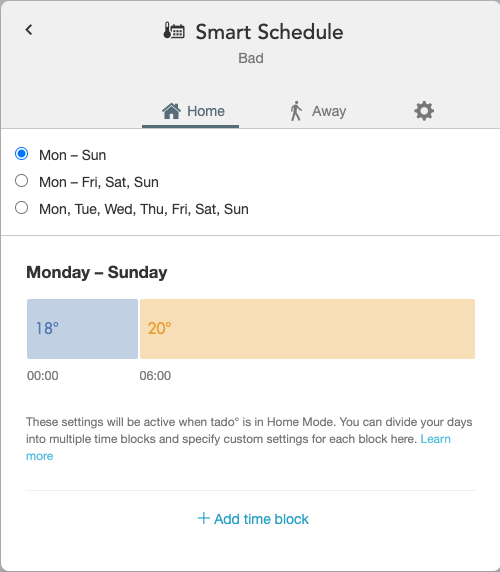
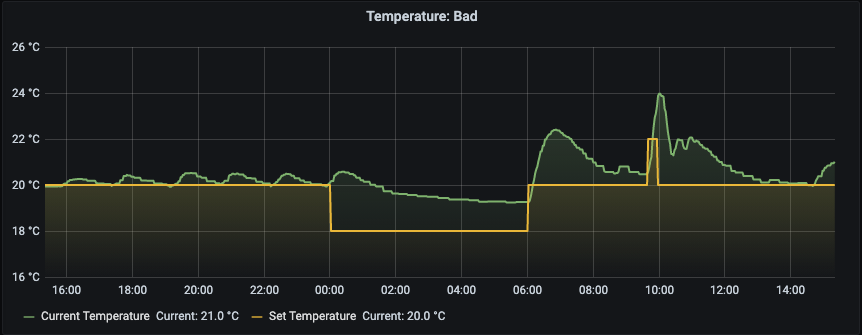
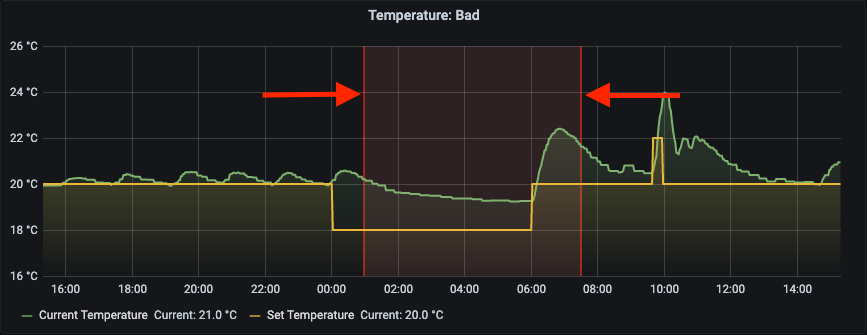
If you use the tado° Smart Schedule, you can display some delimiter in the temperature graph.
Smart Schedule in tado° app
Default: Grafana dashboard without tado° Smart Schedule
Customized: Grafana dashboard wit tado° Smart Schedule indication
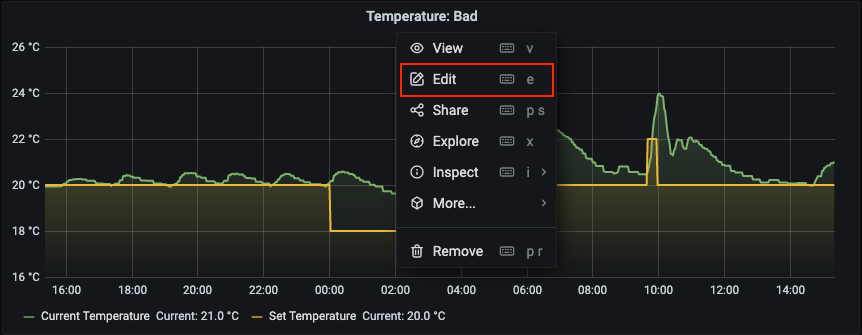
If you prefer to add the Smart Schedule delimiter, click on the settings dropdown on the temperature graph and choose 'Edit':
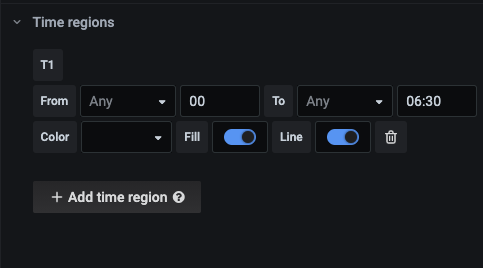
Scroll down to 'Time regions' and press on '+ Add Time region':
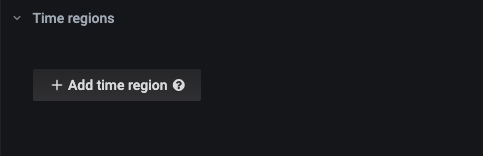
Add the time and date settings that matches with your tado° settings:
This project is not affiliated with tado°.
All mentioned trademarks are the property of their respective owners.