
By Cameron Gable (1iggy2), Anthony Russo, Hogan Hsu, Sergio Ramirez Sabogal, Brian Sandor
This project is aimed towards providing a thrust testing stand for brushless electric motors and propellers used by student project teams as part of Professor George Halow’s AERO 495 course. Prof. Halow has indicated that there is currently a need for some of the project teams that are part of his course to have an easy way to test the thrust capabilities of their electric motors and propellers for applications ranging from quadcopters to fixed wing aircraft. Our project concept is therefore a proposal to design, build, and test a modular thrust test stand that allows for multiple motor and propeller sizes to be tested safely and effectively by any of the teams participating in AERO 495. This test stand will use sensors to measure thrust, torque, voltage, current, and RPM and involve a processing system for automated data collection for simple export to software like Excel or MatLab for analysis.

Be careful when near spinning and/or powered propellers they can and will maim you. Please remove all propellers while working on the thrust stand. Propellers of all sizes are dangerous and deserve your respect. Please use the remote to remain clear of the spinning blades of death, and ensure you have a way to break the physical circuit from a distance.

The remote connects to the base station using an nRF24L01 radio transciever. When powering on the remote from a computer or USB power supply you will be prompted to select a test to perform. The test selection buttons are on the left hand side of the remote and ordered as seen below:
- TS - Throttle Sweep
- CT - Constant Throttle
- ST - Stress Test


| Parameter | Description | Throttle Sweep | Constant Throttle | Stress Test |
|---|---|---|---|---|
| A | Test Type | 1 | 2 | 3 |
| BBB | Primary Throttle | Bottom of Sweep | Constant Throttle Value | High Throttle Value |
| CCC | Secondary Throttle | Top of Sweep | N/A | Low Throttle Value |
| DDD | Test Time | Total Test Time | Total Test Time | Total Test Time |
| EEE | Step Time | Step Time | N/A | Switching Time |
Before clicking to confirm your test selection and start your test you will be presented these values as a final check before sending the data to the base station. This will appear in the form:
- A:BBB:CCC:DDD:EEE
After the data is sent to the base station and the test begins simply click the ⌂ (select) button to send a cancel signal to the base station. In case of communication failure it is always important to have a safe method to physically break the circuit in the case of a catastrophic testing failure.
The base station is a rather hands off piece of equipment. You should not be interacting with it during testing, only monitoring. You may want to set your own safety parameters or recalibrate the test stand. In that case I recommend modifying the parameters in the base station file: Mega_BaseStation.ino If you do this please submit your calibration to this Github page for posterity. To gather data you will need to insert a FAT32 or FAT16 formatted microSD card into the Adafruit MicroSD card breakout board+ for the data to be recorded. The data will be recorded to the microSD card in the format shown below.
| AERO 405 Thrust Stand | Winter 2021 | Cameron Gable | ||
|---|---|---|---|---|
| Find Documentation at: | Github | |||
| Ambient Conditions: | ||||
| Temperature: | VALUE | Celsius | ||
| Pressure: | VALUE | Pascals | ||
| Thrust(N) | Volts | Amps | Torque(n-m) | RPM |
| VALUE | VALUE | VALUE | VALUE | VALUE |
At this time analysis software is not being developed. It is an important feature to this project, and the relevant issue can be found here.
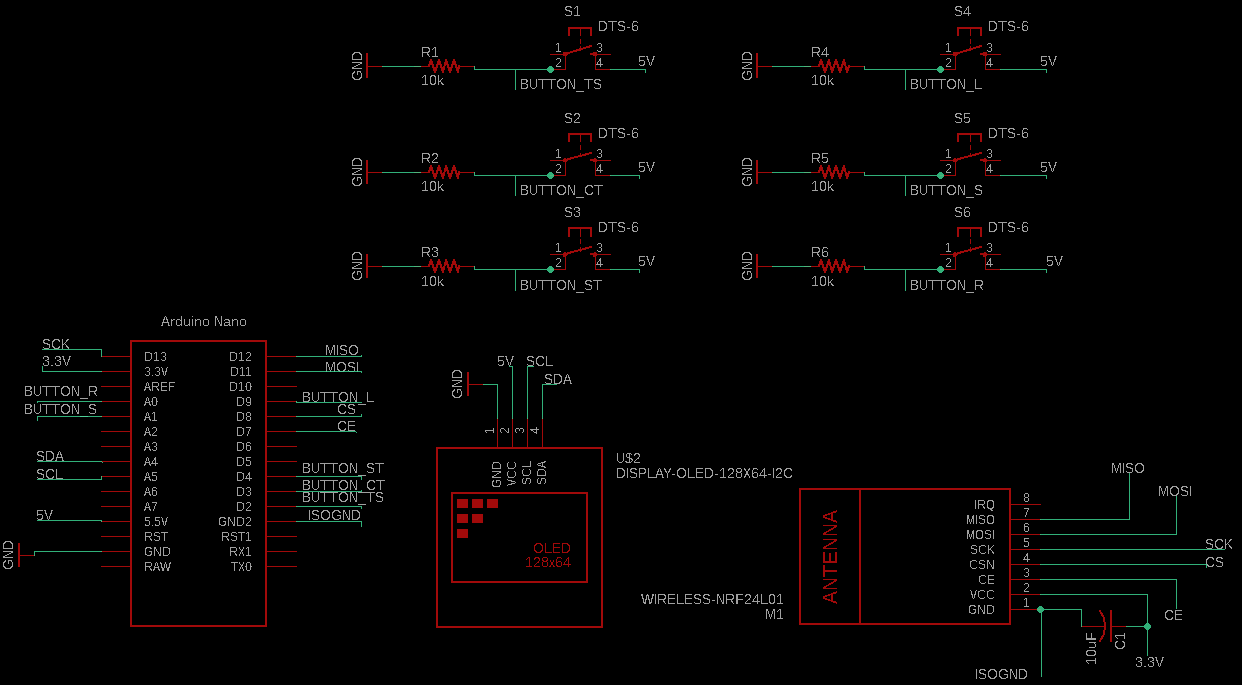
The wiring diagram for the remote has been completed in EAGLE. Completed PCB design Gerber files can be found here. The connections on the diagram below are accurate for anyone who prefers to manufacture it on perf board. (Assembling via a PCB is certainly easier though).
The wiring diagram for the base station was also completed in EAGLE. However, a PCB has not yet been designed and remains an issue for future work.

Our thrust stand has been designed with modularity as the main objective. The interchangeable vertical arm lengths allow for testing to occur for a variety of propeller and motor sizes. This also allows for the thrust stand to operate in both large and small wind tunnels, making test scheduling more convenient for the users. Our motor mounting plates will allow for the mounting of various motors with different bolt patterns. The various sizes of these plates will allow for testing on small motors and large motors on the same stand.
| Long Arm Render | Short Arm Render |
|---|---|
 |
 |
Our unique flexure torque measurement device, seen below, allows for torque data to be collected from all ranges of motor sizes that fit on the thrust testing stand. This innovation increases the effectiveness and accuracy of the data from other more traditional torque measurement solutions. These system design choices increase the effectiveness of our thrust stand and allow it to meet a wide variety of team’s thrust testing needs.


The Base Station is the measurement and data acquistion hub of this project. Tests will be run based on the Menu ID sent from the remote. Raw sensor output, calibration, and settings will be accessed via a physical button press and the serial monitor. This is due to RAM limitations in the Arduino Nano powering the Remote. A full flowchart of the logic is provided below.

After initial testing of the remote GUI intiailly proposed it was apparent that the Arduino Nano did not have enough RAM to display the fully fleshed out GUI. In order to combat this we have designed a low menu count GUI to optimize the remote. This menu uses a minimal amount of unique screens to lower the RAM usage. The image below is the design flowchart for the optimized remote.

In order to model the thrust stand system in FEA many of the complex structures were simplified. This included the flexure assembly being modelled as a rectangular block and the bearing pivot being modelled as a bearing fixture. The CAD model was done in Solidworks and the FEA was done in the Solidworks built-in simulation tool. The load cell and the sides of the pivot were modelled as roller/slider fixtures so that they would be constrained in the plane but can move laterally. The built-in 6061 aluminum alloy material model was applied to the model due to convenience, which has the same properties as the 6105-T5 alloy, just a lower yield strength. The mesh was generated using Solidworks’ automated mesh tool, but mesh control was applied in order to ensure that there were at least 3 elements across each dimension to accurately model the problem. In the image below, a zoomed in display of the maximum stress point is shown along with the mesh for the max loading condition of 20 lbf of thrust and 15 lbf-in of torque on the long arm model. The maximum stress ended up being in the same region for all the simulations, right where the 90◦ bracket met the horizontal arm.

Another accuracy concern is the drag produced by inlet air during wind tunnel testing, particularly on the vertical arm of the test stand. The load cell measuring thrust will not be able to distinguish between this drag force and a thrust difference, thus reducing accuracy. To make sure that our measurement is as accurate as possible during these testing circumstances, we surveyed various cross-sectional shapes of the vertical beam using CFD simulations. STAR-CCM+ CFD simulations were used to model the drag of the stand. Because the only variable between these design is the vertical beam cross-section, simulations were performed using the 15 inch beam by itself, with semicircular fairings, and with one semicircular fairing on the front face and an elliptical section on the rear face to give the overall cross-section an airfoil shape. Seen in the table below.
| No Fairing | Semi-Circular Fairing | Airfoil Fairing |
|---|---|---|
 |
 |
 |
The simulations were then run with the respective beam suspended, centered in a simulated 2 foot X 2 foot wind tunnel using iterations with intake airspeed of 11, 22, 34, 45, 56, and 67 miles per hour. The results are shown in the table below.

Plotted into a graph:

With this information we are designing a 3D printed airfoil to slot into the 8020 aluminium extrusion. We will also be putting our structure, shrouded with an aerodynamic fairing, into the wind tunnel and testing the amount of drag that the system generates with the goal of minimizing this effect. This will be to validate our simulations.
We chose to use a NACA 0015 airfoil fairing for the vertical arm of the stand.
