Overview
Contains 2 functions:
ukgds2nx('ukgdsfilename.xls','outputfilename')
This parses the named ukgds .xls files using the pandas library and converts to a NetworkX Multigraph. The graph is saved as a .pickle file with the specified output file name.
dependencies: pandas, networkx
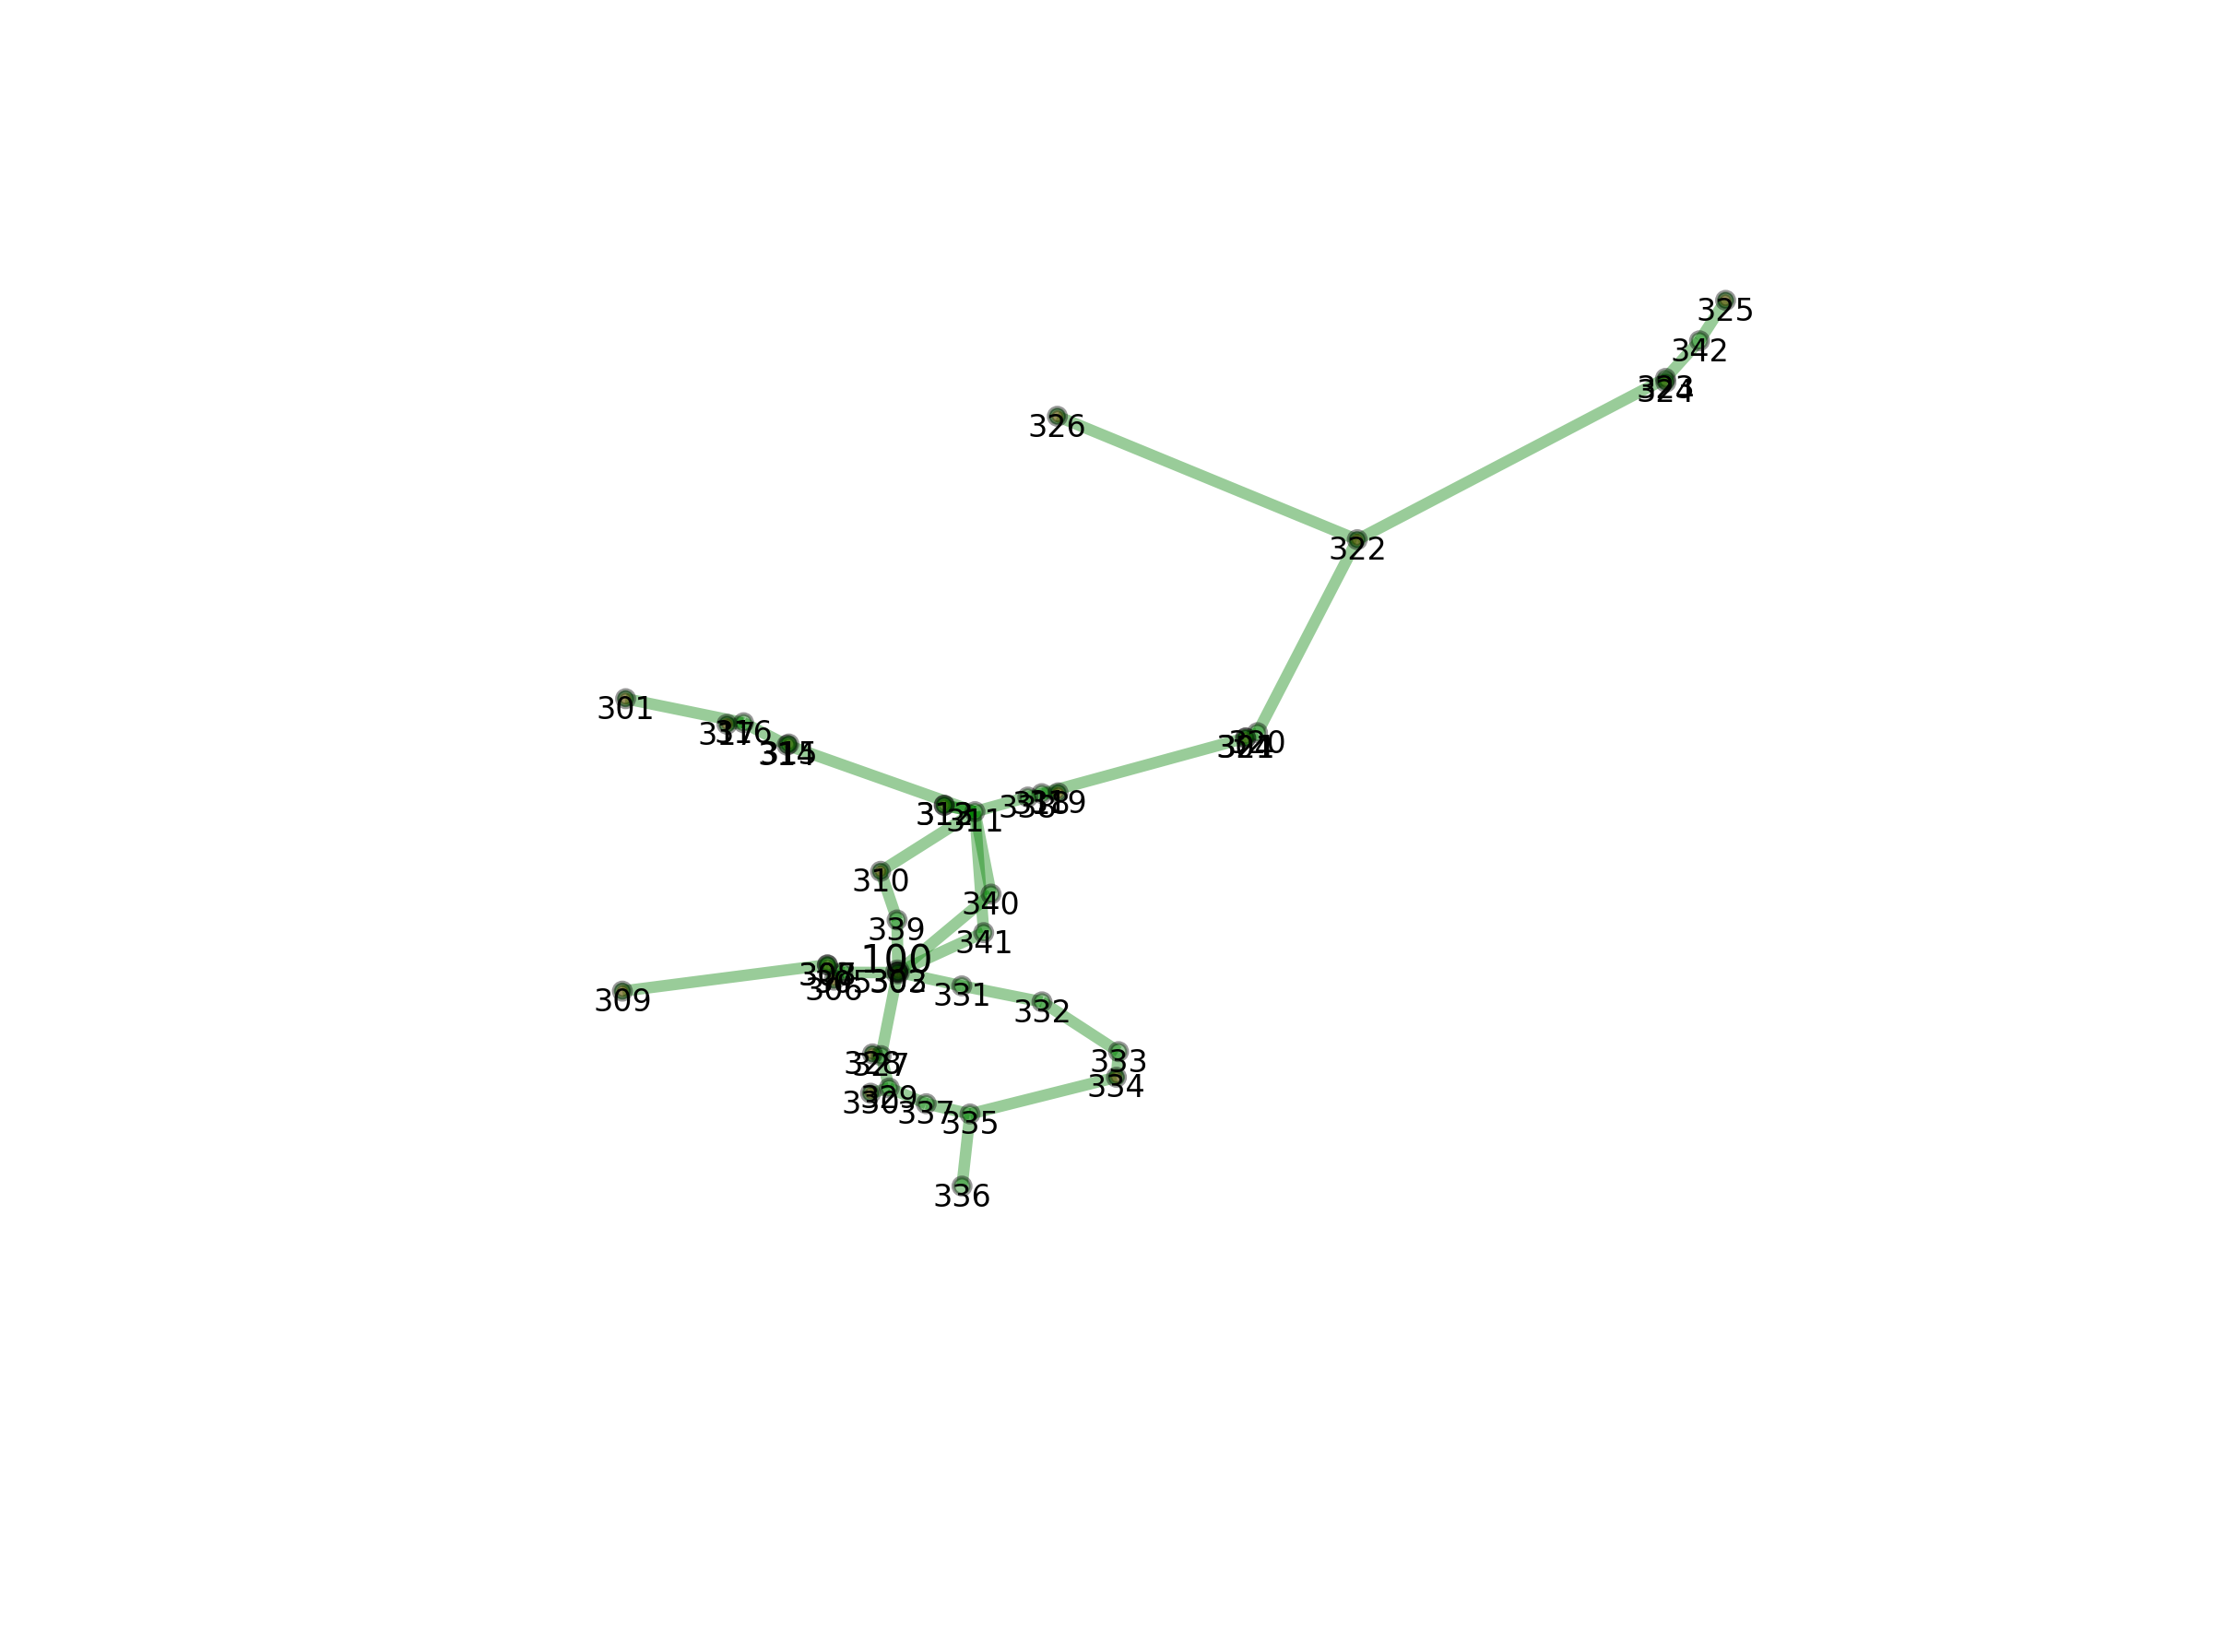
plotmap(G,fileref='ukgds2nxFigure',graphprogram='neato',tag='')
Accepts networkx graph with UKGDS information. Generates node positions (default uses 'neato'), plots and saves graph.
dependencies: matplotlib, networkx, pygraphviz, graphviz
Example Usage:
import ukgds2nx as ux
import networkx as nx
ux.ukgds2nx('EHV1.xls','test')      # saves ehv1 networkx graph in .gpickle format
G=nx.read_gpickle('test.gpickle')   # loads gpickle file
ux.plotmap(G,fileref='ukgds2nxEHV1')                       # plots and saves graph
See Also
UKGDS files https://github.com/sedg/ukgds
ukgds2dss: https://github.com/sedg/ukgds2dss