
Logstash. Logstash is what's in the box.
Using the docker-compose.yml you can spin up a set of Docker images to analyze NCSA-style request logs, and graph them with handy dashboards:
You don't even need to get this repo to use it - only the docker-compose.yml file. Want to build your own image and hack around? Grab the repo.
# This directory must include at least one file with request.log anywhere in the file name
# (IE: request.log, foo.request.log, request.log.20170101)
export LOG_DIR="/path/to/request/logs"
wget https://raw.githubusercontent.com/8x8Cloud/logstash-in-a-box/5.x/docker-compose.yml
docker-compose -f docker-compose.yml up -d
2) Give Logstash some time to index your logs, then go here.
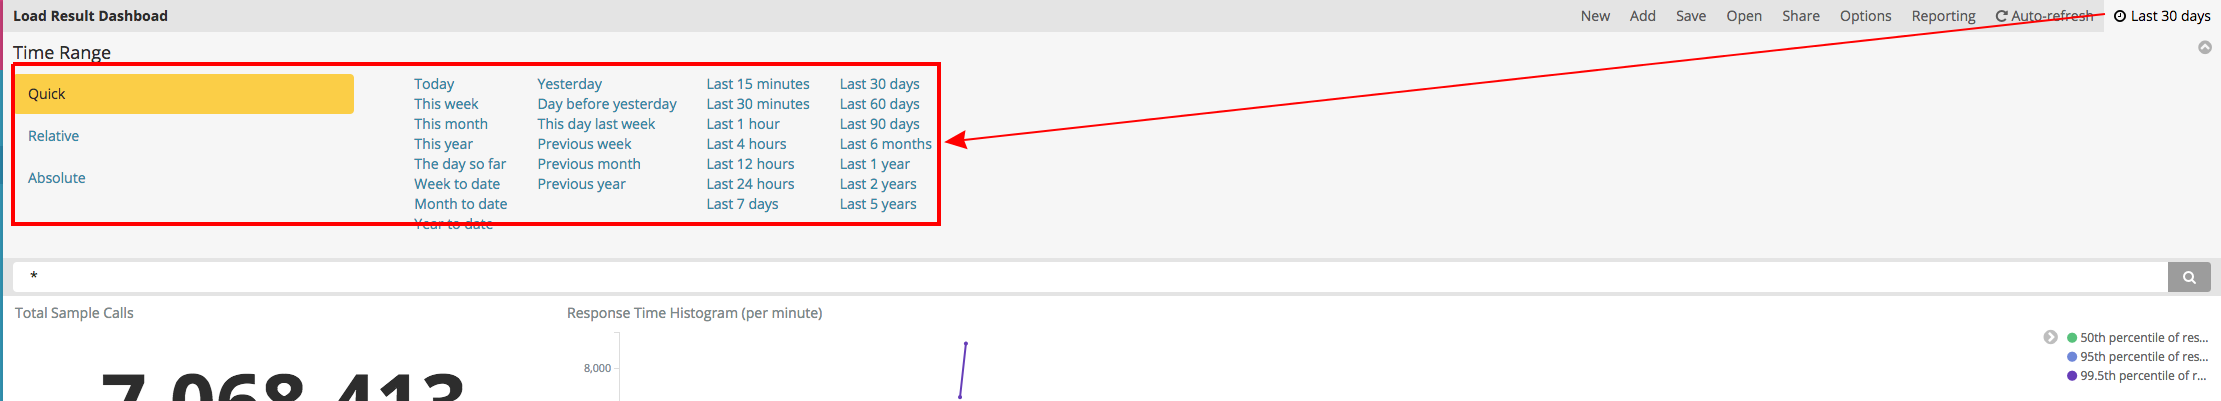
This will use a pre-configured dashboard for the past 30 days. If your data is older than 30 days, you can use the time picker in the upper right-hand corner of the dashboard:
This is what the monitoring component does:
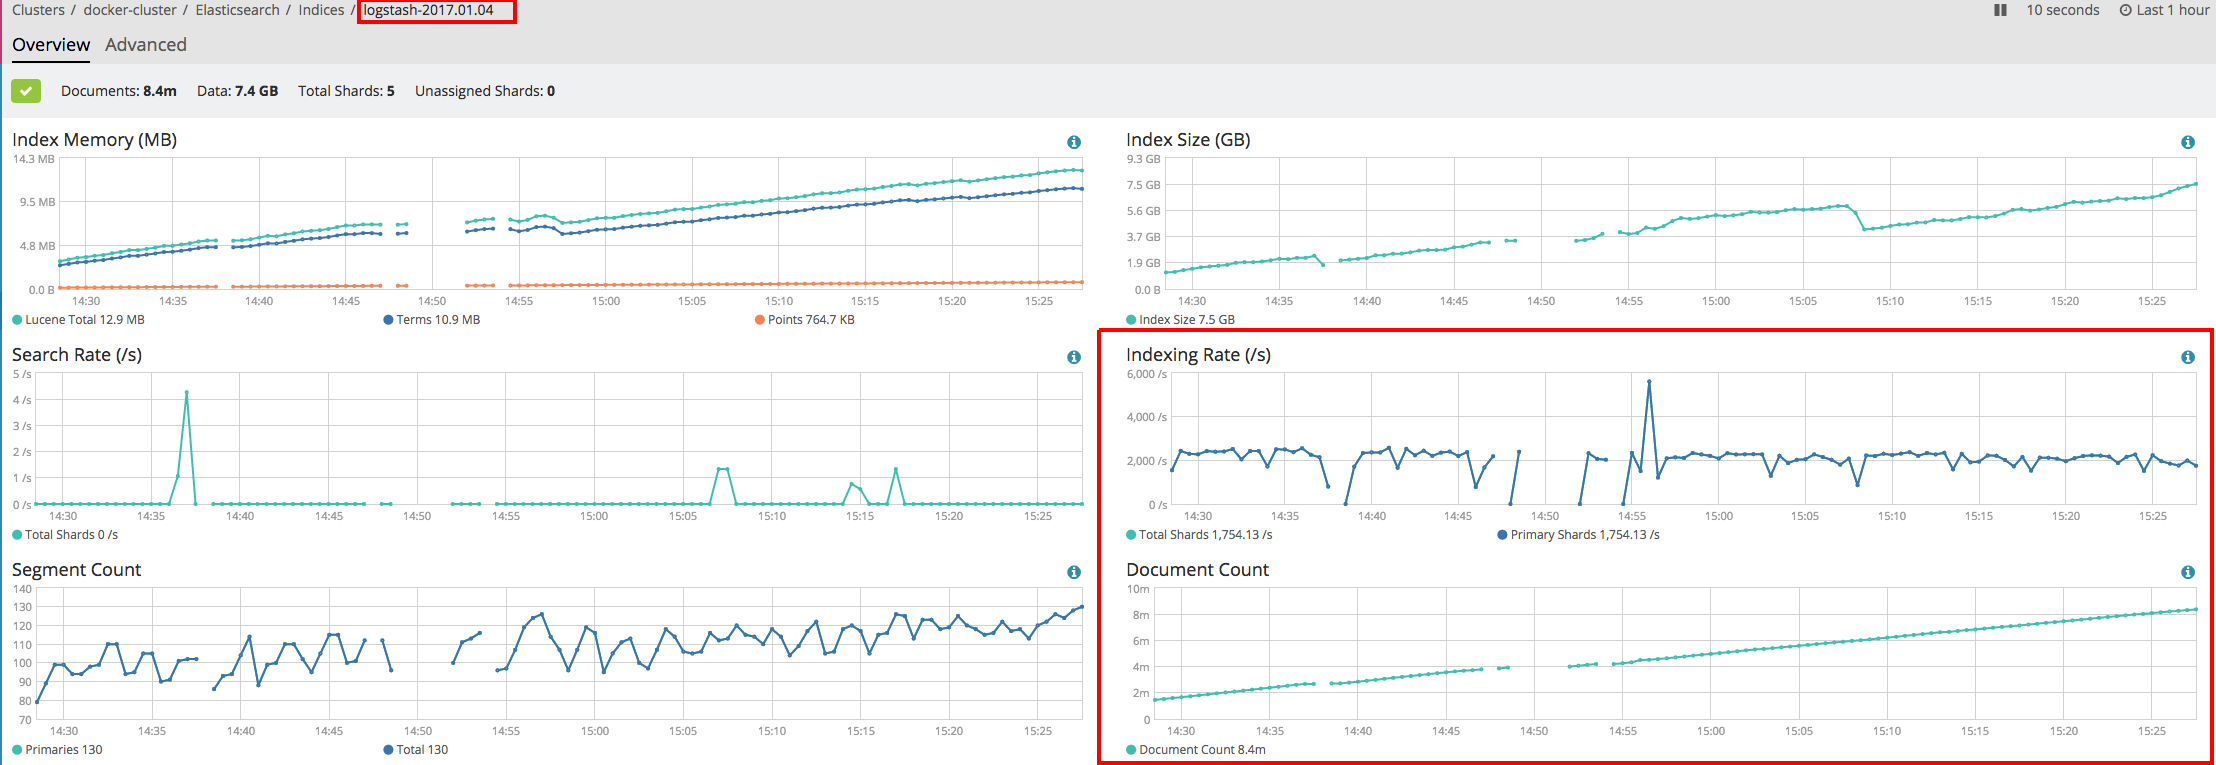
Select one of the indices that has the word "logstash" in it, and watch both the indexing rate and document count. If this rate drops to zero and stays there a while, it's probably done indexing your logs.
Once running, you can find your services at:
- Monitoring at http://localhost:5601/app/monitoring
- Kibana at http://localhost:5601/app/monitoring#/kibana
It'll spin up a cluster that looks like:
- 1 Elasticsearch master
- 1 Kibana node pointing at the ES master
- 1 Logstash node pointing at the ES master
Once the cluster spins up, the Logstash node will use a pre-baked logstash.conf and Elasticsearch index template for your logs. The expected format is NCSA-request with an extra "latency" value at the end (IE: first byte to last byte). Any files in the specified LOG_DIR environment variable with the string request.log in it (prefix, suffix, wherever) will be indexed. That means bob-request.log.12345 will be indexed, as will request.log or request.log.12345.
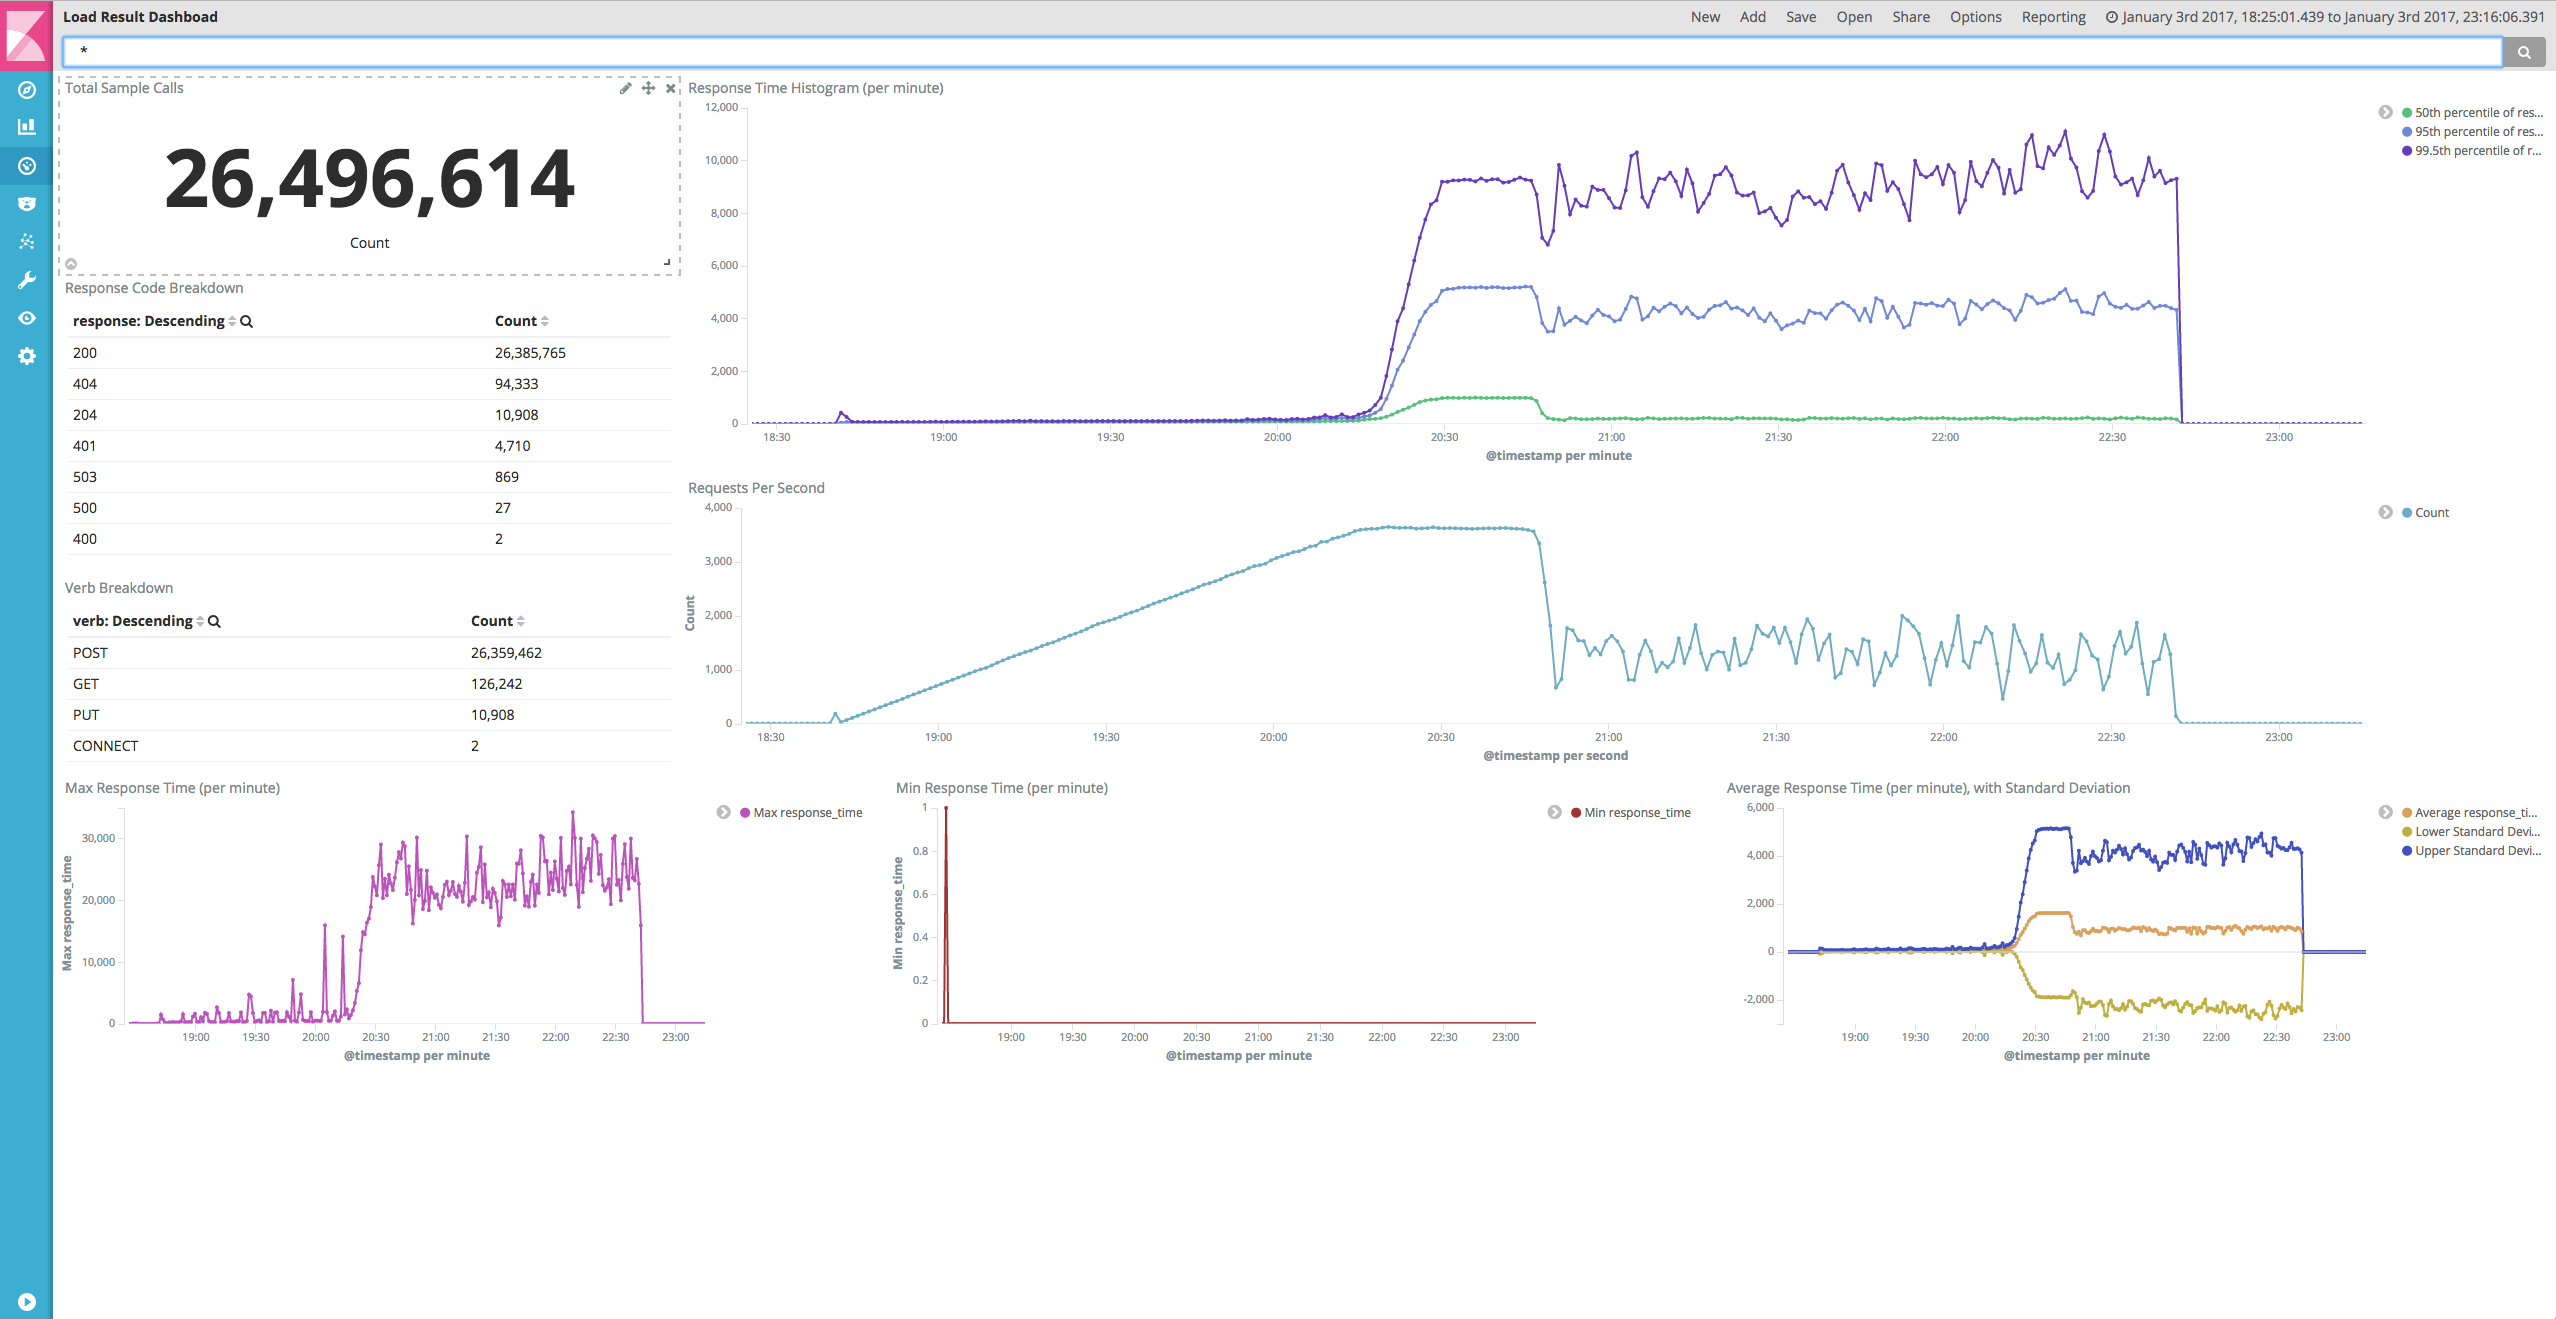
When you're done, you get a nice dashboard (pictured above), and the ability to gain insight out of your request logs.
Maybe you're running load tests, and you want to know what's going on. Maybe you've got an app in a given environment and don't have metrics or telemetry. Maybe you're bored.
Don't want to parse request logs? Want to configure Logstash in a different way? Grab the docker-compose.config.yml file, and run it like this:
# This directory must include at least one file with request.log anywhere in the file name
# (IE: request.log, foo.request.log, request.log.20170101)
export LOG_DIR="/path/to/request/logs"
export CONFIG_DIR="/path/to/logstash/conf"
docker-compose -f docker-compose.yml -f docker-compose.config.yml up -d
Maybe you have a fixed path, and want to know how many requests Customer X got instead of Customer Y. Maybe your request format is weird. Maybe you're a masochist. Who cares! Feel free to grab the logstash.conf and jetty-request-template.json out of the app directory as a guide.
When you're done you're probably going to want to clean up the Docker volumes:
docker-compose down
docker volume ls -f dangling=true -q | xargs docker ...
(Please note the above will destroy all dangling volumes, so make sure you mean to run it. Otherwise, you can delete them one at a time using docker volume rm. Ellipsis for your protection.)
The Docker image itself the standard Elastic Logstash image, with a few extra scripts to configure our dashboard. Upon starting the image, it will attempt to restore a Kibana dashboard, some index patterns, searches and visualizations in the kibana-goodies directory.
The Logstash install itself uses a config file that uses a file input, reading from /input/**/*request.log*, which is in turn bound via the volume statement mapping your ${LOG_DIR} directory. So if you have your request logs in /var/log/apache2, you would set your LOG_DIR environment variable to /var/log/apache2, and in turn it would look for any file with the string request.log in it.
The rest of the Logstash configuration consists of parsing the NCSA-style request log, parsing the timestamp so that we index based on events within the log (rather than ingestion time), and eventually spitting the data into an ElasticSearch node at http://elasticsearch:9200 (this comes from our docker-compose.yml file). An index mapping will be supplied so that fields aren't analyzed, and that numerical values are parsed accordingly. You don't want to look for long response times only to find Elasticsearch has automatically classified your response time as a string.
Please note that in order to render the dashboard, the visualizations make use of an extended request log. Each of our servlet containers adds an additional integer at the end of the request log, indicating how many milliseconds the request took from first byte to last byte. If you do not have this value in your logs they will still parse, but the dashboard will be unable to graph anything that is based on response time.
Enabling logging differs based on your container, the version of the container, and how you're using the container. Here are a couple of popular containers:
Don't see your container? See a mistake? Submit a pull request!
We're just starting. The first dashboards/visualizations were written to give us insight into our request logs from load tests, and various production environments. As more and more people use this image, we can start adding new dashboards, with all kinds of new insights.