1. Run .c to plot points and get txt files with x y coordinates.
2. Run plot.py to draw the graph.
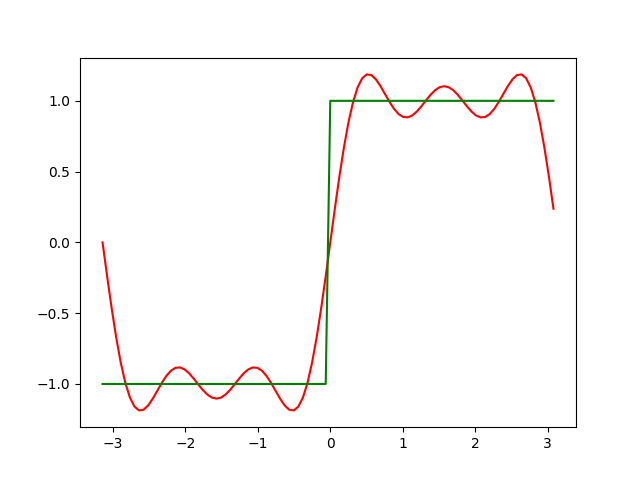
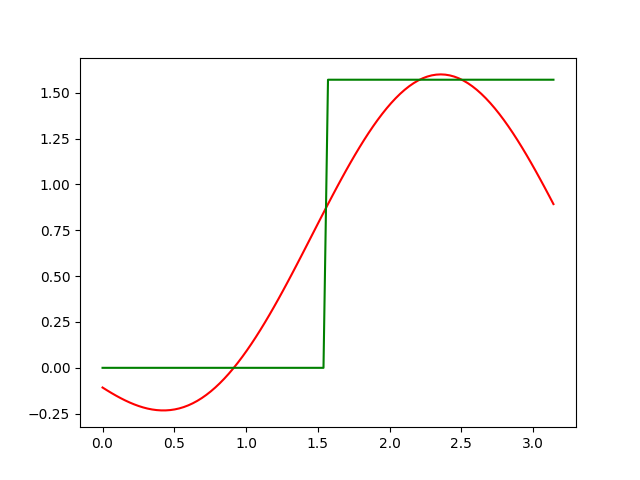
Note: After you run the C code, data.txt contains x y values of the fourier series function data1.txt contains x y values of the original function.
Questions (A-F):

1. gcc or any C compiler.
2. python with matplotlib (for plot.py if you want to use it to plot graphs, or you can use the x y values from the txt files).
 |
|---|
| stacked graphs from f_series_stp2.c |
 |
|---|
| A |
 |
|---|
| B |
 |
|---|
| C |
 |
|---|
| D |
 |
|---|
| E |
 |
|---|
| F |