- Overview
- Directory Structures
- Features
- Dependencies
- Building
- Running
- Testing
- Code Style
- Documentation
- Contributors
- License
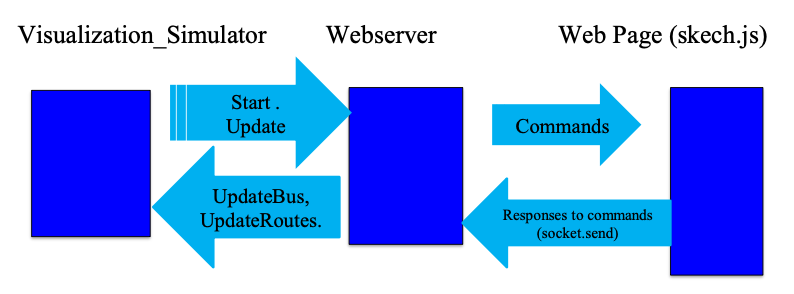
The simulation system models bus transit around the University of Minnesota campus, and can display the routings and statistics on a webpage in a timely manner.

config: Containsconfig.txtwhich is a configuration file for bus stops and routes used by the transit simulation system, can be customized.cpplint: Automatic Google Style cpplint script.docs: Documentation files and images.drivers: Contains source code with the main function that is used to create the drivers files for entities in the simulation system.googletest:GoogleTest suits for unit testing and regression testing.src: Directory that contains all the source code (.cc AND .h) for the backend simulator.test: Directory of creating unit tests, using Google Test framework.build: Created byMakefile, containing all the executables.web_code: Source code for the web server used to enable communication between the visualization component and the backend simulation system.web_graphics: Frontend HTML/CSS/JavaScript source code used to render the web page. It enables to configure and run the transit simulation system from the local browser.
- Visualization on a web page
- Functionality to Pause / Resume
- Logging the statistics
- Runtime behavior modificaiton at runtime
- Linking to an external database server
- Deploying the on the cloud
g++nodenpm
The project can be compiled across different platforms using Makefile. However, to enable most of the features and functionalities of the system. It recommended to compile it on a Linux machine. Then we can run the simulation system and the web server on a Linux machine and access it via a browser on a different platform (Linux, OSX, Windows, or even on a mobile).
To compile and build the program, it is as simple as:
$ cd src
$ make
The built executable will be located in ./build/bin/, named vis_sim.
To run the simulation and start the web server:
$ ./build/bin/vis_sim <port_number>The port_number is of your choice and should be a legal one (typically starting from 8000).
Then run your local browser (Firefox/Chrome are guaranteed to have the best performance), and enter following address:
https://127.0.0.1:<port_number>/web_graphics/project.htmlYou will be directed to the main page of the simulation visualizer and you can play with it!
All test cases are created with Google Test.
# Example usage
$ cd tests
$ make
$ ../build/bin/unittest# Example usage
# The output of diff command should be silent
$ cd src
$ make regression_test
$ cd ../build/bin
$ ./regression_test > [log_file1]
$ ./regression_test > [log_file2]
$ diff [log_file1] [log_file2]The code in this project is Google Style compliant and uses cpplint for linting.
For style check, do the following
$ ./cpplint/cpplint.py [path_target_dir] [file_name]
# Example usage
$ cd src
$ ../cpplint/cpplint.py *.cc *.hDoxygen is used to generate documentation and UML for this project. The steps are following
- Navigate to the
docsdirectory.
$ cd docs- Generate the
htmlpages andlatexfiles for the documentation.
$ doxygen Doxyfile- Open the
index.htmlfile inside thedocs/htmldirectory with a browser and you will be directed to the main page of the project document.