
Fitspy is a generic tool dedicated to fit spectra in python with a GUI that aims to be as simple and intuitive to use as possible.
Processed spectra may be independent of each other or may result from 2D-maps acquisitions.
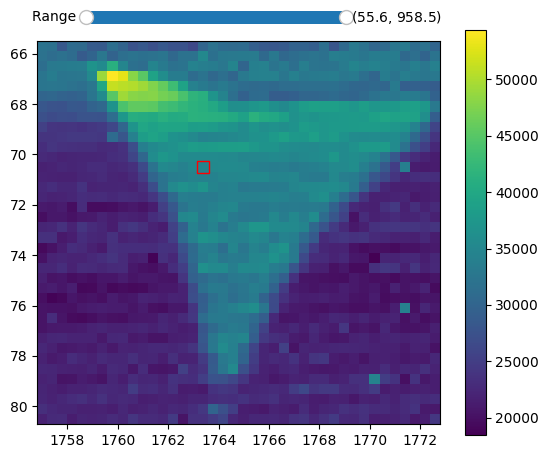
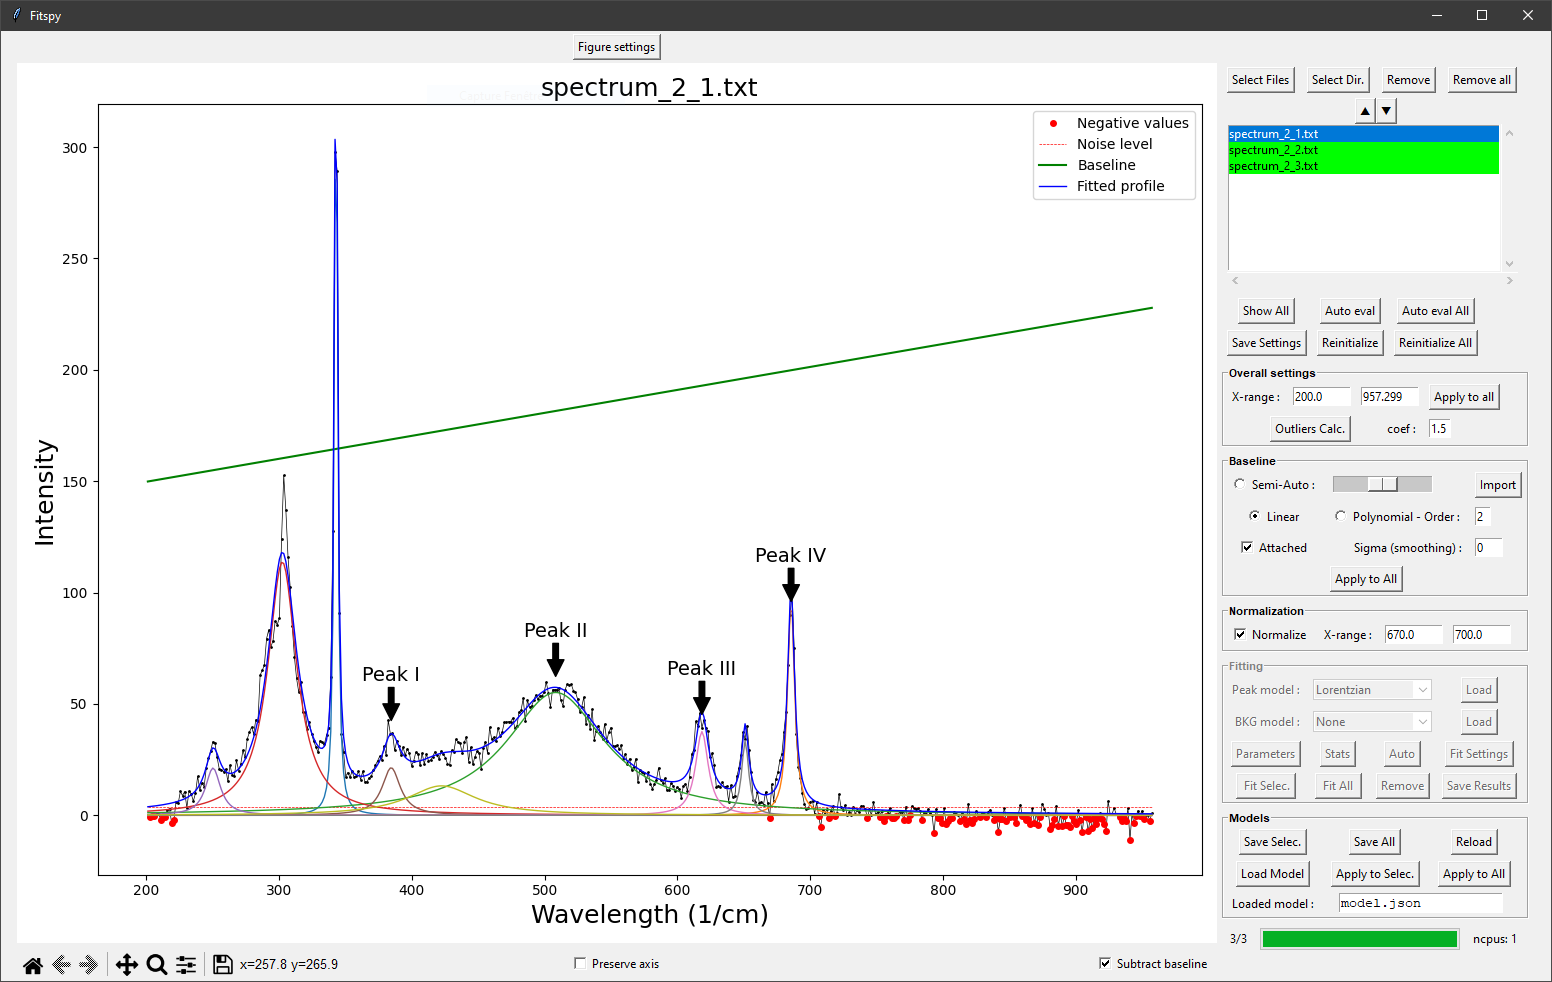
Example of fitspy 2D-map frame interacting with the main GUI.
The predefined peak models considered in Fitspy are Gaussian, Lorentzian, Asymetric Gaussian, Asymetric Lorentzian and Pseudovoigt.
A constant, linear, parabolic or exponential background model can also be added in the fitting.
In both cases, user-defined models can be added.
Fitspy main features:
- Fitspy uses the lmfit library to fit the spectra
- The fit processing can be multi-threaded
- Bounds and constraints can be set on each peaks models parameter
- From an automatic noise level estimation, according to the local noise, peak models can be automatically deactivated
- Fitspy also includes automatic outlier detection to be excluded during the fitting process
All actions allowed with the GUI can be executed in script mode (see examples here).
These actions (like baseline and peaks definition, parameters constraints, ...) can be saved in a Fitspy model and replayed as-is or applied to other new spectra datasets.
pip install fitspy
(See the documentation for more details)
pip install pytest
git clone https://github.com/CEA-MetroCarac/fitspy.git
cd fitspy
pytest
python examples/ex_gui_auto_decomposition.py
python examples/ex_.......
(See the documentation for more details)
Launch the application:
fitspy
Then, from the top to the bottom of the right panel:
Selectfile(s)- (Optional) Define the X-range
- Define the baseline to
subtract(left or right click on the figure to add or delete (resp.) a baseline point) - (Optional) Normalize the spectrum/spectra
- Click on the
Fittingpanel to activate it - Select
Peak modeland add peaks (left or right click on the figure to add or delete (resp.) a peak) - (Optional) Add a background (BKG model) to be fitted
- (Optional) Use Parameters to set bounds and constraints
Fitthe selected spectrum/spectra- (Optional) Save the parameters in .csv format
- (Optional) Save the Model in a .json file (to be replayed later)
(See the documentation for more details)
This work, carried out on the CEA - Platform for Nanocharacterisation (PFNC), was supported by the “Recherche Technologique de Base” program of the French National Research Agency (ANR).
Warm thanks to the JOSS reviewers (@maurov and @FCMeng) and editor (@phibeck) for their contributions to enhancing Fitspy.
In case you use the results of this code in an article, please cite:
-
Quéméré P., (2024). Fitspy: A python package for spectral decomposition. Journal of Open Source Software. doi: 10.21105/joss.05868
-
Newville M., (2014). LMFIT: Non-Linear Least-Square Minimization and Curve-Fitting for Python. Zenodo. doi: 10.5281/zenodo.11813.