Better mesh plotting for detector; Better plotter docstrings #96
Conversation
This file contains bidirectional Unicode text that may be interpreted or compiled differently than what appears below. To review, open the file in an editor that reveals hidden Unicode characters.
Learn more about bidirectional Unicode characters
added 11 commits
March 9, 2018 10:45
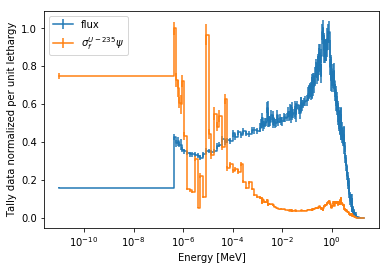
Need to fix lethargy normalization
Need to inspect the mesh plotter more, especially for cases
where the x/y data is not a grid quantity, like plotting
reaction values on the y axis. Direct comparison against
matplotlib.pyplot.pcolormesh shows that these grid vectors
are drawing every shape with the same y coordinates, only varying
in x.
In order to better align with the zero-index nature of python and
numpy arrays, the values in the indexes ordered dictionary are
now shifted down by 1.
Resolved the cartesian plotter in plot.py and used by
DetectorBase objects for plotting cartesian meshes.
Use a better matplotlib renderer that supports better
colormaps and color-normalizations.

Updated the detector example including new figures.
Add a page for the plotting routines in plot.py

Apply the magigPlotDocDecorator found in plot.py to
many other plot routines to give a consistent
documentation.
DanKotlyar
approved these changes
Mar 16, 2018
Sign up for free
to join this conversation on GitHub.
Already have an account?
Sign in to comment
Add this suggestion to a batch that can be applied as a single commit.
This suggestion is invalid because no changes were made to the code.
Suggestions cannot be applied while the pull request is closed.
Suggestions cannot be applied while viewing a subset of changes.
Only one suggestion per line can be applied in a batch.
Add this suggestion to a batch that can be applied as a single commit.
Applying suggestions on deleted lines is not supported.
You must change the existing code in this line in order to create a valid suggestion.
Outdated suggestions cannot be applied.
This suggestion has been applied or marked resolved.
Suggestions cannot be applied from pending reviews.
Suggestions cannot be applied on multi-line comments.
Suggestions cannot be applied while the pull request is queued to merge.
Suggestion cannot be applied right now. Please check back later.
Closes #83 by using the
matplotlib pcolormeshto simplify the plotting.This new plot function allows many new features, including log-scale and custom colormap normalization.
Updated the detector example to show off some new plot capabilities such as plotting multiple tally sets on the same figure
Documentation
Added a magic decorator in
plot.pythat uses magic strings (hard coded matches) to update a function or methods doc string. This was built to reduce the code in documenting the plot methods that shared many common keyword arguments, such asax,xlabel, and all returned anaxon which the figure was drawn.Edit
Updated flux mesh plot to reflect changes in 0a37e55