Skip to content
New issue

Have a question about this project? Sign up for a free GitHub account to open an issue and contact its maintainers and the community.

By clicking “Sign up for GitHub”, you agree to our terms of service and privacy statement. We’ll occasionally send you account related emails.

Already on GitHub? Sign in to your account

Is there any way to calculate log-average miss rate? #43

Closed
dungmn opened this issue Dec 21, 2018 · 22 comments
Closed

Is there any way to calculate log-average miss rate? #43

dungmn opened this issue Dec 21, 2018 · 22 comments

Comments

@dungmn
Copy link

dungmn commented Dec 21, 2018

Hello,
I want to evaluate my prediction on mine dataset with YOLOv3 which is using the log-average miss rate metric?
Could you guide me how to do it?
Thanks.

@Cartucho
Copy link
Owner

Hello,
Currently, this repo is not calculating the log-average miss rate.
I will add it to my TODO list.

@dungmn
Copy link
Author

dungmn commented Dec 22, 2018

Thanks, @Cartucho. I have another issue
I used the repo: https://github.com/AlexeyAB/darknet to train my custom objects.
When I stop training, I run ./darknet detector map data/obj.data yolo-obj.cfg backup\yolo-obj_9000.weights and get mAP around 40%.
But when I run ./darknetdetector test data/obj.data yolo-obj.cfg backup\yolo-obj_9000.weights -ext_output <data/test.txt> result.txt, I use your repo to evaluate on result.txt. However I get the mAP around 32%.
Do you know why I get 2 results differently?

@Cartucho
Copy link
Owner

Hum, that's strange indeed. Although, I am not really aware of how AlexeyAB is calculating the mAP.
In the past, PASCAL VOC used to calculate the mAP using exactly 11 recall levels however, they removed this restriction in the latest competitions.

In this repo, I use the most recent version of the official PASCAL VOC code.

@zhanghengdev
Copy link

Great work! Waiting for the log-average miss rate update. @Cartucho

@Cartucho
Copy link
Owner

Ok, I will start it now

@Cartucho
Copy link
Owner

Cartucho commented Jan 21, 2019

@nguyendu392 @ZHANGHeng19931123 do you have any legit documentation explaining how to calculate the log-average miss rate?

@Cartucho
Copy link
Owner

References:

  1. C. D. Manning, P. Raghavan, and H. Schutze. An Introduction to Information Retrieval. Cambridge University Press, 2008.
  2. D. Hoiem, Y. Chodpathumwan, and Q. Dai. Diagnosing error in object detectors. In Proc. ECCV, 2012.
  3. Dollar, Piotr, et al. "Pedestrian Detection: An Evaluation of the State of the Art." Pattern Analysis and Machine Intelligence, IEEE Transactions on 34.4 (2012): 743 - 761.

@Cartucho
Copy link
Owner

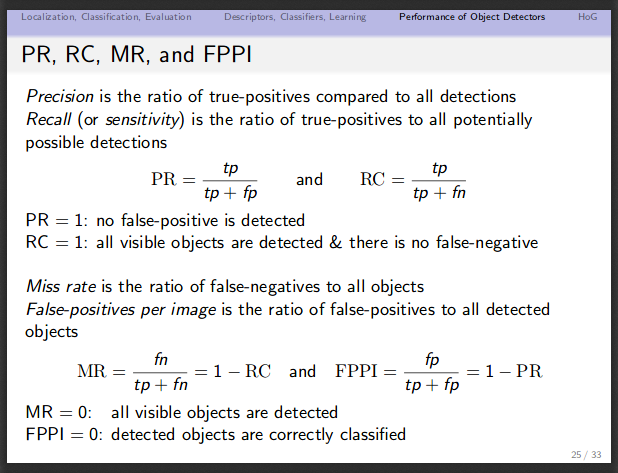
Log-average miss rate =

image,

when a1, a2, ..., a9 are positive values corresponding to the miss rates at 9 evenly spaced FPPI points in log-space, between 10^-2 and 10^0.

@Cartucho
Copy link
Owner

@ZHANGHeng19931123 @nguyendu392 Done! You will now find a plot in the results/ with the log-average miss rate for each class.

@zhanghengdev
Copy link

@ZHANGHeng19931123 @nguyendu392 Done! You will now find a plot in the results/ with the log-average miss rate for each class.

Great work! Thanks a lot! While I might have spotted two small bugs:

Line 651: you calculate your lamr after map, but in your function 'voc_ap', you've changed the variable 'rec' and 'prec' by insert values at the beginning and end of your two lists.

Line 88: miss rate is 1-recall instead of 1-precision. ref: FNR=1-TPR.

And I have a small question please: I've checked the version Matlab (https://github.com/pdollar/toolbox/blob/master/detector/acfTest.m), and you have done the same things by calculating mr with miss=exp(mean(log(max(1e-10,1-miss)))). But in the paper, It is "averaging miss rate at nine FPPI rates evenly spaced in log-space". Why not use the average?

Waiting for your answer :)

@Cartucho
Copy link
Owner

Cartucho commented Feb 10, 2019

Hello, you are right! I have fixed them both!

And I have a small question please: I've checked the version Matlab (https://github.com/pdollar/toolbox/blob/master/detector/acfTest.m), and you have done the same things by calculating mr with miss=exp(mean(log(max(1e-10,1-miss)))). But in the paper, It is "averaging miss rate at nine FPPI rates evenly spaced in log-space". Why not use the average?

Because it is an average in log-space: the log-average formulation of the geometric mean..
Btw, that matlab code was made by the same author as the paper.

@zhanghengdev
Copy link

Hello, you are right! I have fixed them both!

And I have a small question please: I've checked the version Matlab (https://github.com/pdollar/toolbox/blob/master/detector/acfTest.m), and you have done the same things by calculating mr with miss=exp(mean(log(max(1e-10,1-miss)))). But in the paper, It is "averaging miss rate at nine FPPI rates evenly spaced in log-space". Why not use the average?

Because it is an average in log-space: the log-average formulation of the geometric mean..
Btw, that matlab code was made by the same author as the paper.

Thank you for your reply! Have you ever checked if your result is identical with the MATLAB function 'evaluateDetectionMissRate'? I've quickly built two small scripts for the format convert and Matlab evaluation. I don't have Matlab installed, could you verify if they gave the same result?

'convert_for_matlab.py' to convert .txt files in 'ground-truth' and 'predicted' to .mat.
'lamr.m' read these .mat files to calculate miss rate with the Matlab 'evaluateDetectionMissRate' function. (before running, change work dir to 'matlab/')

May exits bugs, cause I can't debug without Matlab..
Rename these scripts before running plz, it seems that I can't upload .py and .m files :(
Thank you!

convert_for_matlab.py.txt
lamr.m.txt

@Cartucho
Copy link
Owner

@ZHANGHeng19931123 sure, thank you for those scripts, I will check it out!

I can only work on this next week because this one I'm very busy!

@niuniu111
Copy link

have anybody plot MR-FPPI curse succeedly? I use plt.plot(fppi, mr,), but the result is wrong,whether I use wrong code?looking forward for your answer

@Joker316701882
Copy link

@Cartucho
Hi, how about your experiments with the provided results from @ZHANGHeng19931123 ? I'm using your lamr evaluation code, but the results seem to be 10% poor than reported in paper.

@zhanghengdev
Copy link

For information, I finally switch to Matlab for MR calculation, even though I didn't find any error in @Cartucho 's Python script...

@Joker316701882
Copy link

@ZHANGHeng19931123
Are you implying that the evaluation results between Matlab and this implementation are not identical?

@zhanghengdev
Copy link

@ZHANGHeng19931123
Are you implying that the evaluation results between Matlab and this implementation are not identical?

yeah, they are different, but I didn't find what is wrong with his code @Joker316701882

@SreenivasVRao
Copy link

SreenivasVRao commented Dec 11, 2019

I think I found the mistake, please let me know. Found this source here:
https://www.cs.auckland.ac.nz/~rklette/TeachAuckland.html/775/pdfs/D28-Detection1.pdf

looks like we shouldn't be using fp_cumsum, but using fppi = 1 - precision?

image

also, here's another reference - https://eavise.gitlab.io/brambox/_modules/brambox/stat/_mr_fppi.html#mr_fppi

Cartucho added a commit that referenced this issue May 29, 2020
@Cartucho
Copy link
Owner

@SreenivasVRao thank you for sharing this.

@Joker316701882 if you still have the code do you think you could give it a try?

@mashiwei
Copy link

@Cartucho @ZHANGHeng19931123 @Joker316701882 @SreenivasVRao
I test the .m scripts(in matlab R2017b) provided by @ZHANGHeng19931123 ,the results of python and matlab are same.
But there are some mistakes in convert_for_matlab.py.
For ground truth and predicted, x, y should be

x = float(left)
y = float(top)

not

x = (float(left)+float(right))/2
y = (float(top)+float(bottom))/2

In bboxOverlapRatio.m, it said

%bboxOverlapRatio Compute bounding box overlap ratio.
%  overlapRatio = bboxOverlapRatio(bboxA, bboxB) returns the overlap ratio
%  between each pair of bounding boxes contained in bboxA and bboxB. Each
%  row of bboxA and bboxB is a [x y width height] vector, where x and y are
%  an upper left corner of a bounding box. 

After fixing this error, the larm calculated by python and matlab are same(in my own data).

@ghost
Copy link

ghost commented Aug 4, 2020

Hi @Cartucho if possible how to generate confusion matrix for two or more classes?

Sign up for free to join this conversation on GitHub. Already have an account? Sign in to comment
Labels
None yet
Projects
None yet
Development

No branches or pull requests

7 participants