PyGmPlot
This package wrapper several ploting API from google map into Python package. Users can generate html file using this package. Several ploting method is provided in this package including marker, line, polygon.
Here is an example:
key = "YOUR_GOOLE_MAP_KEY"
plot = PyGmPlot(26.771339, -72.346313, key, 5)
plot.add_marker(25.466, -90.118)
plot.add_circle(29.444291, -98.531578, 500, strokeColor='black')
plot.add_line([(30.444291, -90.531578), (35.467, -80.118),(32.321, -70.757),
             ], strokeColor='#black')
outerCoords = [ (25.774,-80.190), (18.466, -66.118), (32.321, -64.757)]
hole1 = [(28.745, -70.579), (29.570, -67.514), (27.339, -66.668)]
hole2 = [(25.745, -76.579), (26.570, -70.514), (20.339, -66.668)]
plot.add_polygon(outerCoords, [hole1, hole2], fillColor='#FFC107')
plot.draw('test.html')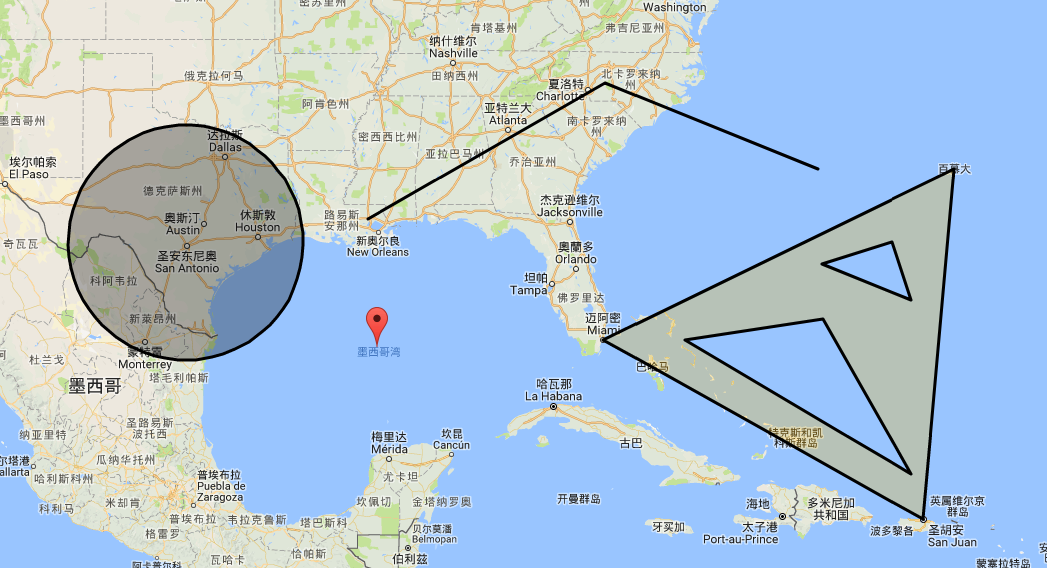
Inspied by Michael Woods(physicsmichael@gmail.com) gmplot module