| title | date | excerpt | description | tags | |||
|---|---|---|---|---|---|---|---|
Predicción de poblaciones. |
2023-02-25 |
Porfolio |
Estimación de una población |
|
The objective of this repository is make a research about growth/decrease population using some data analysis techniques. To do it We use the oficial data provided by The world bank is an international financial institution that provides loans and grants to governments of low- and middle-income countries for various development purposes, its mission is to help developing countries achieve sustainable growth by financing investment, mobilizing capital in international financial markets, and providing advisory services
The dataset can be accessed by the follow link
Create the python environment and download the necessary dependencies
conda create --name populations python=3.10 -y
conda activate populations
pip install -r requirements.txt
streamlit run main.py
Run using Docker
docker build -t populations:2 .

docker run -d --name populations_container populations:2
The algorithm are design to work with some tendency, but for developer reason we selected Ukraine as the default population
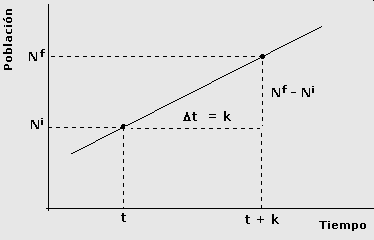
Linear growth refers to a steady and consistent increase or progression over time where the change occurs at a constant rate. In this type of growth, the relationship between the input and output variables remains proportional.
In a linear growth scenario, if you were to graph the relationship between time (or any independent variable) on the x-axis and the quantity or value (dependent variable) on the y-axis, the resulting graph would be a straight line. This line would have a constant slope, indicating that for every unit increase in the independent variable, there is a constant increase or decrease in the dependent variable.
Mathematically, linear growth can be represented by an equation in the form of
- y is the dependent variable,
- x is the independent variable,
- m is the slope of the line (representing the rate of change),
- b is the y-intercept (the value of y when x x is zero).
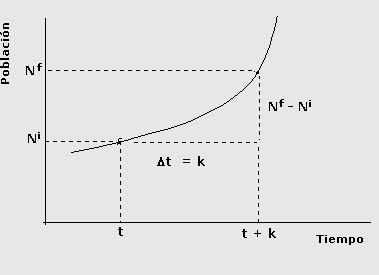
Gradient growth, often referred to as exponential growth, signifies a pattern where the rate of increase of a quantity is proportional to its current value. In simple terms, it's growth at a compounding or accelerating rate, where the larger the current value, the faster it grows over time.
Unlike linear growth, where the increase is constant and steady, gradient growth demonstrates an accelerating or decelerating rate of change. When plotted on a graph, this type of growth results in a curve that steepens or flattens out, showcasing rapid expansion over time.
Mathematically, gradient growth can be represented by an exponential function, often in the form of $ y = a * b^x $, where:
-
y represents the final value or quantity,
-
a is the initial value or quantity,
-
b is the growth factor or rate,
-
x is time or the number of periods.
Logistic growth represents a type of growth pattern where a population or a quantity initially experiences exponential or rapid growth, but eventually reaches a point where growth slows down and stabilizes. This pattern is often described as an S-shaped curve.
In logistic growth, the population or quantity starts with a period of rapid increase when resources are abundant. However, as the population approaches a certain limit or carrying capacity - the maximum population size that the environment can sustain - the growth rate gradually slows down. Eventually, the population stabilizes near the carrying capacity, resulting in a relatively constant population size.
Mathematically, logistic growth is described using the logistic equation, which can be represented as:
Where:
-
P(t) represents the population (or quantity) at time.
-
K is the carrying capacity or the maximum population size the environment can sustain.
-
r is the growth rate of the population.
-
e is the base of the natural logarithm.
-
t is time.
[1] The world bank (no date) Population, total - ukraine, World Bank Open Data. Available at: https://data.worldbank.org/indicator/SP.POP.TOTL?end=2022&locations=UA&start=1960 (Accessed: 14 December 2023).
[2] Khan Academy (no date) Linear and exponential growth | Lesson (article), Khan Academy. Available at: https://www.khanacademy.org/test-prep/sat/x0a8c2e5f:untitled-652/x0a8c2e5f:problem-solving-and-data-analysis-lessons-by-skill/a/gtp--sat-math--article--linear-and-exponential-growth--lesson (Accessed: 19 December 2023).
[3] Braunschweig, D. (no date) Numerical Analysis/Vandermonde example, Wikiversity. Available at: https://en.wikiversity.org/wiki/Numerical_Analysis/Vandermonde_example (Accessed: 03 January 2024).