Experimental Debugging Tool
The debugging tool may be used to identify the presence of errors during the execution of networks on FPGA. It is compatible with Keras based networks.
The tool executes the network in Keras, and provides sub-layer outputs to match those provided by the FPGA. Corresponding sub-layer networks are also created as part of this process. A visual tool allows comparison of the FPGA and Keras outputs at each layer.
Debugging Tool Installation
The debugging tool is available at the debug_tool branch of the network conversion tool. It is available here.
The debugging tool requires additional components on top of the conversion tool. These are:
Please refer to the installation instructions for each.
The debugging tool is used by running the conversion tool with additional command line arguments. These are:
- --debug 1 : Required. This executes debugging functions
- -- input_file: Required. This can be any compatible test image. This should also be run on the FPGA.
- --r_offs, --g_offs, --b_offs: Optional. RGB offsets. These values are the RGB offsets required by the network. Default is 0.
- --scale: Optional. Image scale. This is the scale factor required by the network. Default is 1.
example
$dv-sdk> python tool/convertor.py application/model/keras_mobilenet.ini --debug 1 --input_file image.jpg --r_offs -127.5 --g_offs -127.5 --b_offs -127.5 --scale 0.0078431This will convert the network to FPGA and output as usual. In addition, a network debug folder will be created inside the debug folder. This contains:
- keras_networks/ : Folder containing Keras models corresponding to each FPGA node/sub-layer
- keras_outputs/ : Folder containing Numpy outputs of each Keras sub-model
- keras_outputs_float16/ : Folder containing Numpy outputs of each Keras sub-model, converted to float16 between layers.
- PLACE_FPGA_DUMPS_HERE/ : Empty folder for FPGA dump files.
- debug_img_original.jpg : Copy of the original test image file.
- input_image_processed.jpg : Copy of the processed image file used for testing (after RGB offset, scaling)
- input.npy : Numpy array of the processed image. This is the raw input to the Keras model.
- pose_network_complete_map.json : This maps the inputs and outputs of each layer. Required for later debugging steps.
- pose_network_complete_model.png : Image of the network structure, showing all layers, their dimensions, and connections. Note that this is based on the original Keras model, and may show additional sub-layers compared to the output files. This is due to how some layers are grouped by the FPGA structure.
- pose_network_complete_original_model.h5 : Copy of the original Keras model file.
The network should be run on the FPGA as usual, with the program set to dump layer outputs. The test image used in the previous step should be run on the FPGA.
To dump FPGA layers, add network.WantLayerOutputs() after network.Verbose(0) in the network software.
  network.Verbose(0);
  const bool dump_outputs = true;
  if (dump_outputs) {
    network.WantLayerOutputs();
  }
Now layer outputs are stored in output member of fpga_layer struct.
The layer dump files should be generated on the FPGA and should then be copied to the network debug FPGA dump folder. A name of a dump file of a prior layer have to be in lower position if sorted.
It is possible to pass each layer of FPGA data to the next layer of Keras models. This allows creation of another set of output data that minimises potential error accumulation.
This can be created with the following command (with mobilenet as an example):
$dv-sdk> python tool/debug_layer_run/run_debug_layers.py debug/mobilenetVisualisation is possible using Bokeh, which creates a server to access and present available data.
$dv-sdk> bokeh serve tool/layer_check/visualisation --show --args debug/mobilenetThis will launch a web page showing the network data. Navigation through each layer is possible with the Layer drop-down menu. Datasets can be selected with the Dataset menus. All channels are displayed as a single image. Each channel has a border with the maximum value within that channel. The View menu allows display of:
- Data1/Data2 : Raw data of only one dataset. Colour scale of complete image is variable with input data. Max/Min values are taken from the ENTIRE dataset
- Difference : Data1 - Data2. This is raw pointwise subtraction. Colour scale of complete image is variable with input data. Max/Min values are taken from the ENTIRE dataset
- Activation Difference : (Data1 - Data2) / (abs(Data1) + abs(Data2)). Pointwise difference divided by the sum of absolutes. This is a scale from -1 to +1. Ideal result is 0. Extreme values occur when only one value is 0. Close to extreme values occur when values are similar but have opposite signs. This can be used to highlight ReLU activation differences.
- Difference - Limited ColorRange : This displays the difference (Data1 - Data2) with the color scale constrained to 1 standard deviation of Data1 (+std/2 to -std/2). This prevents extreme values from skewing the color range, and creates a color range that is related to the original dataset. This may help to identify irregularities.
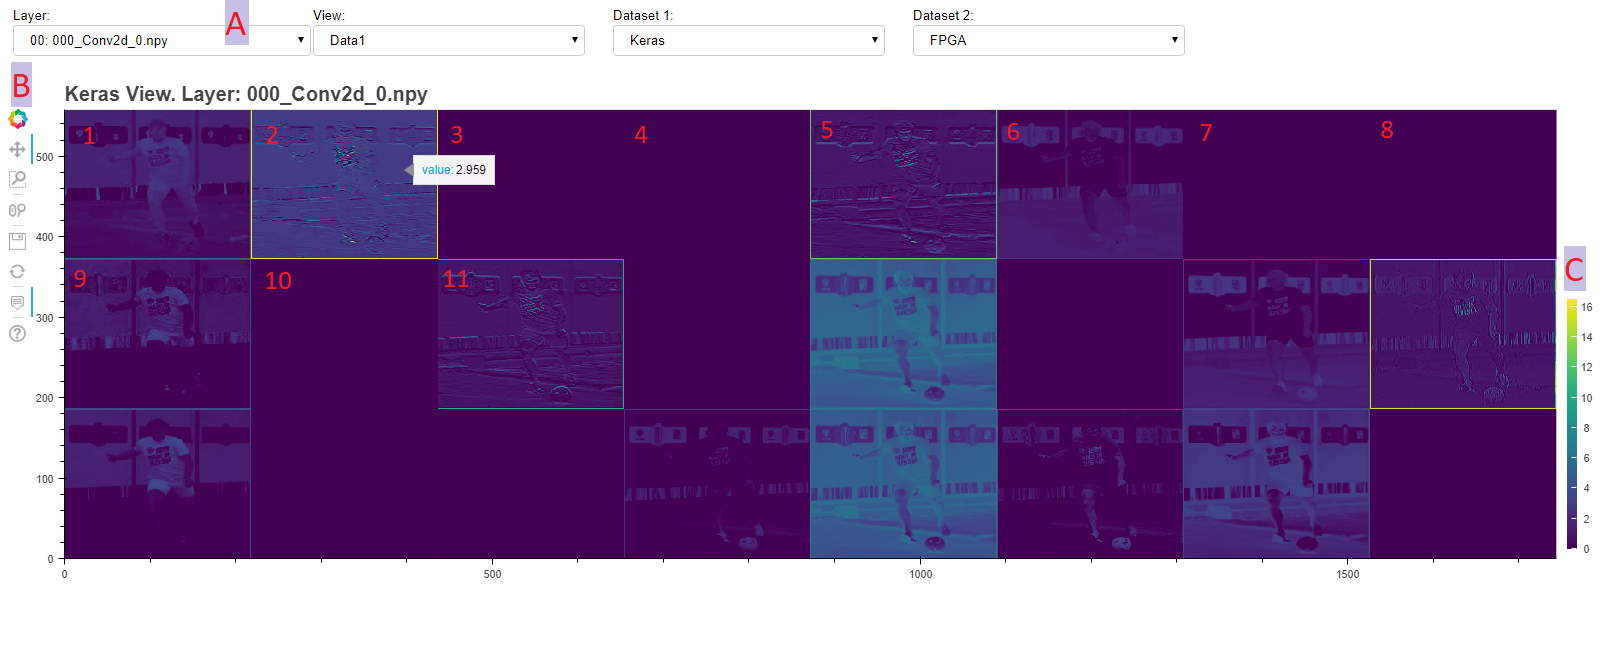 A multi channel visualisation.
- 1-16: These are the first 16 channels of this example. Channels are arranged in 8 columns, from top to bottom. Each channel has a border with value equal to the maximum of that channel
- A: Layers, View options, and Datasets can be selected from the top menus.
- B: Image navigation tools are on the left side.
- C: The image colour scale is shown on the lower right. The scale range varies with layer and view types.
- D: When the Hover tool is selected, the value at each pixel is shown.
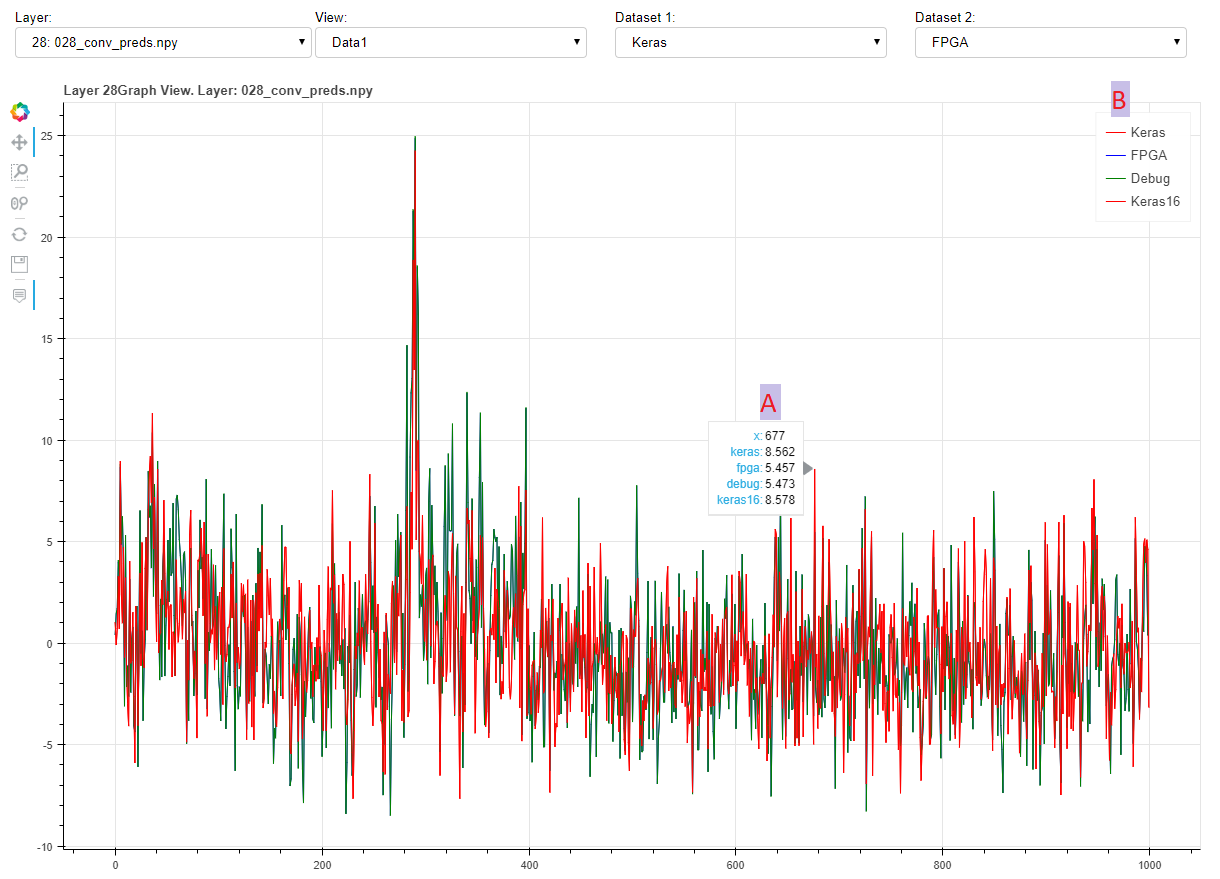 1D visualisation view.
Data is displayed as a line graph for 1D data (eg softmax output). All datasets are overlaid on each other.
- A: When the Hover tool is selected, the value at each data point can be found.
- B: Legend of datasets. Clicking on legend entries can show/hide datasets.

Copyright © 2018-2019 Digital Media Professionals Inc.