
Photo: Macie J. Luczniewski - Nurphoto/Getty Images
Under the broad research question: What are the impacts of COVID-19 in one's life? Our team collected Twitter data to answer research hypothesis, producing models, and have a better understanding of the factors that influence one's reaction to the global pandemic. Our team collected more than 300 thousand tweets ranging from 2009 to November of 2020. We utilized the open source software R [1] and the Rstudio [2] in order to gather the tweets and perform the different statistical analysis. We also utilized Git [3] and GitHub [4] to organize and share our project with the community. If you wish to check the coding behind all the statistical models and ohter relavant topics of the project, please access the folder named "Scripts". If you wish to have access to the graphs generated throughout our project, please acess the folder named "Images".
-
Arianna Lupi (@ariannalupi) - ST. Thomas University Carnival Cruise Lines School of Science
-
Enzo Novi Migliano (@EnzoNMigliano) - ST. Thomas University Carnival Cruise Lines School of Science
-
Raul Ramon (@raulramon) - ST. Thomas University Carnival Cruise Lines School of Science
In other to perform all the statistical analysis and gather the data from Twitter we utilized several packages:
| Package Name | Package Name | Package Name | Package Name | ||||
|---|---|---|---|---|---|---|---|
| [5] | tidyverse | [6] | corrplot | [7] | caTools | [8] | caret |
| [9] | forecast | [10] | arules | [11] | arulesViz | [12] | lubridate |
| [13] | stringr | [14] | tm | [15] | quanteda | [16] | reshape2 |
| [17] | lda | [18] | syuzhet | [19] | wordcloud2 | [20] | RColorBrewer |
| [21] | party | [22] | rpart | [23] | rpart.plot | [24] | e1071 |
| [25] | rtweet | [26] | RMySQL | [27] | odbc | [28] | DBI |
COVID has affected every aspect of our lives, the way we gather, work, communicate, relate, and live. Even though we are seeing some improvements and we are slowly starting to see things go back to normal this pandemic has definitely taken a toll on everyone's physical and mental health.
Our motivation for this Project is to understand how people are currently feeling around COVID and what's their state of mind during the pandemic, in specific for the front line workers, people who tested positive for COVID-19, and people's affects towards the vacine.
Despite the fact that the pandemic is fairly recent in our society, some research has been done in regards of the impact of COVID-19 in people's lives. The pandemic has been analyzed, however, in a large spectrun, in other words, in many studies the COVID-19 overral effect in society was the main porpuse. The results of such studies are great to understand the impact of COVID-19 as a whole, for example, according to Chakraborty et al.[29] people majorly tweeted positive messages regarding COVID-19, but re-tweeted the negative tweets.
-
Global Sentiment Analysis Of COVID-19 Tweets Over Time https://arxiv.org/abs/2010.14234
-
COVID-19 Public Sentiment Insights and Machine Learning for Tweets Classification https://www.mdpi.com/2078-2489/11/6/314/htm
Among the several supervisionated and unsupervisionated statistical models the most frequent ones in the present project were:
-
Decision Trees
-
Association Rules
-
Time Series
-
Sentiment Analysis
Covid-19 impacted the life of many, as several people got infected with the disease or even passed away. The scope of the consequences that pandemic brought to society is huge, therefore, the present project approached, under the theme Covid-19 impact in one's life, three major research questions:
Covid-19 has been trending topic in all information and social platforms for the past year. Human interaction has been reduced to a minimum and people have turned to social media to account for their daily activities and to fill the void social distancing has cause. “I have Covid-19.” “I got symptoms.” “I test positive.” These are words no one wishes to express to a loved one, however, they have become more and more common since the pandemic began. The objective of the search queries was to identify among Twitter users those instances in which the users informed in social media that they had Covid-19 symptoms or had positive Covid-19 diagnosis.
Exploring some principal phrases like “I have Covid-19.” “I got symptoms.” “I test positive” We found that the phrases where mentioned with the wide range of instances like 5,429 for “I have Covid”, 1,067 for “I test Positive” and just 316 for “I got Symptoms”. In our process to understand the phrases or the words we made a histogram for the most common word uses and covid it is mentioned in the tweets text 6,495 for 6,443 tweets downloaded. The “tested word we can see just 1,2009 in second rank follow by “positive” with 1,062 times used.

The following visualization is to see how the word ‘covid’ is use in relation to other words.

For the cluster analysis I select the variables that work for the model. The cluster is important for the data analysis, is the job of grouping variables or attributes in the same group that represent the same hierarchical clustering.
The Elbow method is to define clusters and the cluster inside variation. The following K-mean cluster indicate that two cluster is the distribution for this data for “followers” and “favorites”.

The first data show that the within cluster sum of sum squares is 59.2%. The following visualization is for the Kmeans Cluster Followers and Favorites for tweets.

The second cluster annalisys data show that the within cluster sum of sum squares is 53.2%. The following visualization is for the Kmeans Cluster Followers and Friends for tweets.

Not enough with the tweets I decide to build a cluster test word for the text tweets and the result was that the ‘covid ‘ as a principal selection it’s connect with two other “positive , test” and “mask and wear”. We can appreciate this in the Hierarchical word/tweeter clustering using dendrogram.


For the logistic Model we prepare the variable source from the tweets and we classify the in two groups ‘Mobile’ and ‘Web app’. The dependent variables were ‘source’ and the other variables like ‘display width’, ‘followers’, ‘friends’, ‘listed’, ‘statuses’ and ‘favorites’. The model shows that the interaction with display text width, the listed count and the status count are the only variables that represent significant differences.
glm(formula = source ~ ., family = binomial, data = train_lgtweets)
Deviance Residuals:
Min 1Q Median 3Q Max
-1.9569 -0.5288 -0.4613 -0.4195 2.7118

Confusion Matrix and Statistics Reference Prediction Mobile WEB_APP Mobile 1398 2 WEB_APP 192 0
           Accuracy : 0.8781
             95% CI : (0.8611, 0.8938)
No Information Rate : 0.9987
P-Value [Acc > NIR] : 1

              Kappa : -0.0025
Mcnemar's Test P-Value : <2e-16
Sensitivity: 0.8792
Specificity: 0.0000
Pos Pred Value: 0.9986
Neg Pred Value: 0.0000
Prevalence: 0.9987
Detection Rate: 0.8781
Detection Prevalence: 0.8794
Balanced Accuracy: 0.4396
'Positive' Class: Mobile
Precision is: 0.9985714 Recall is: 0.8792453

##Conclusion The results show that the words ‘Covid’, ‘tested’ and ‘positive’ are being used more frequently than others. We can expect that with time as the pandemic progresses and eventually decrease its impact on our lives the sentiment expressions will vary to negative sentiment to positive one This type of research evaluation will help the health community and policy makers in being able to provide people with necessary information and resources to deal with the impact of Covid19 and to be able to identify where assistance is needed immediately.
Our Team collected a sample of 993 tweets in the month of October of 2020. The Tweets were gathered using the following expressions, contained in the following R code, as search querries: testingFilter <- search_tweets(q = ""I am a nurse" OR "I am a doctor" OR "I am a caregiver" OR "I am a nursing home caregiver" OR "I am a nursing home worker" OR "I work at a hospital" OR "I work at a nursing home" OR "I work at the medical field" AND -filter:verified",
n = 10, include_rts = FALSE). The objective of the search querries was to find the Twitter users that are front line workers. Thereafter, we extracted the timelines of those users up to 400 tweets back in time. Both datasets, the initial search querry and the data set with all the timelines were the base for most of the analysis about the impact of Covid in the frontline workers. If you wish to see the source code for the data colection access the "Scripts" folder in the GitHub page, the initial search that resulted from the search querry is listed in the folder called "Data".
Here are some sample tweets from the original 993 tweets extracted from the front line workers:
"@MileyCyrus @CashApp $lissamc1123 I work at a nursing home and it’s so hard during covid, we’ve been in lockdown for almost 9 months, I’m getting so burnt out and this would mean so much🖤 https://t.co/ZV7Q14rqfZ"
"@IlluminatiEyes I am a nurse who left the ICU four years ago to get away from the stress. I am back working in ICU due to covid. So far we have had to create an additional 20 ICU beds, rent equipment, and pull staff from other areas. These are the sickest patients that I have seen in almost 20 y""
"I am grateful for Mrs Ruth Khoza and Dr Thulani Khoza of #Ulundi , South Africa for paying my registration fee to #medicalschool. I am forever #grateful. Today I am a doctor because they planted a seed, they believed in me. Believe in someone, \n\nhttps://t.co/EAlvQbFO5p"
"❤❤❤❤\n\nI am a nurse and educator. These times have been hard for everyone. For me, I worry for those who are ill and those who are not. Will we be able to keep ppl healthy? Will we be able to care for them all?\n\nI am SO proud we have a leader who cares about people's lives. 🙏🏼 https://t.co/J3fnVamXpB"
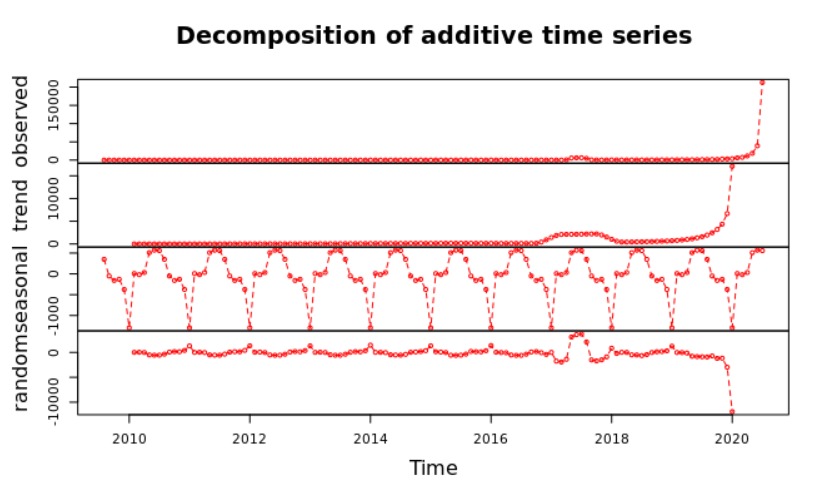
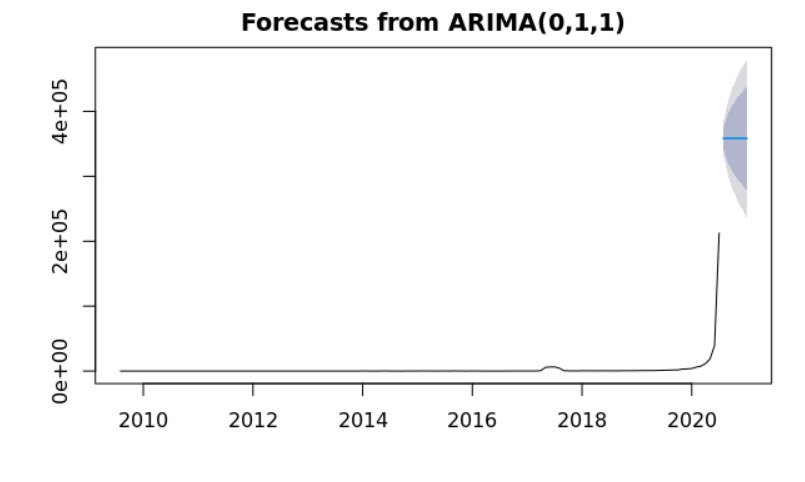
In order to show how relevent Twiiter is as a platform for the front line workers to express themselves, in special during the pandemic, our team developed a time series analysis for the tweets that we gathered. The first time series analysis was about the ammount of tweets tweeeted, starting from the oldest tweet we gathered up to the newest one. Followed by a forecast for the next 6 months.
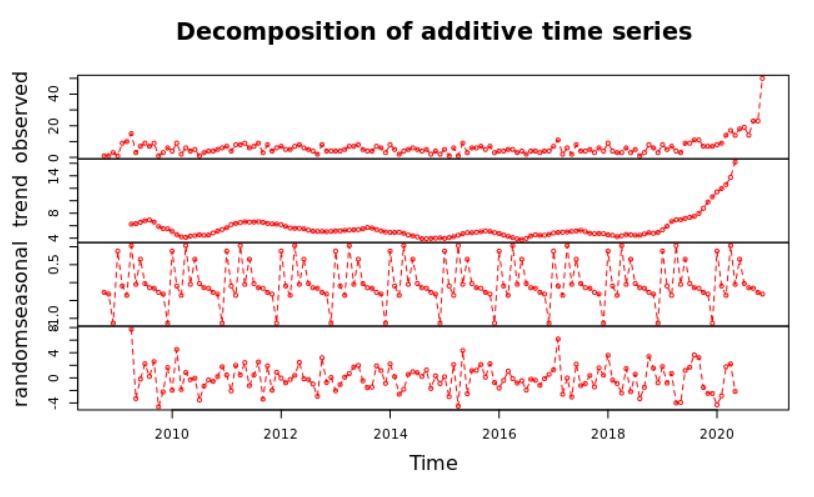
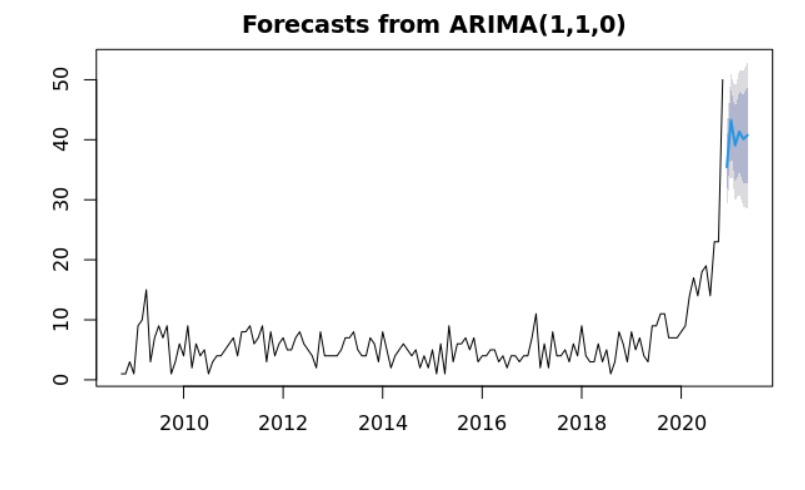
This time series analysis is even more insightful than the previous ones. The time series takes into account the number of accounts created over the time. Followed by a forecast of the next 6 months. As we can observe in the year of 2020 there was a boom of accounts created among the front line workers.
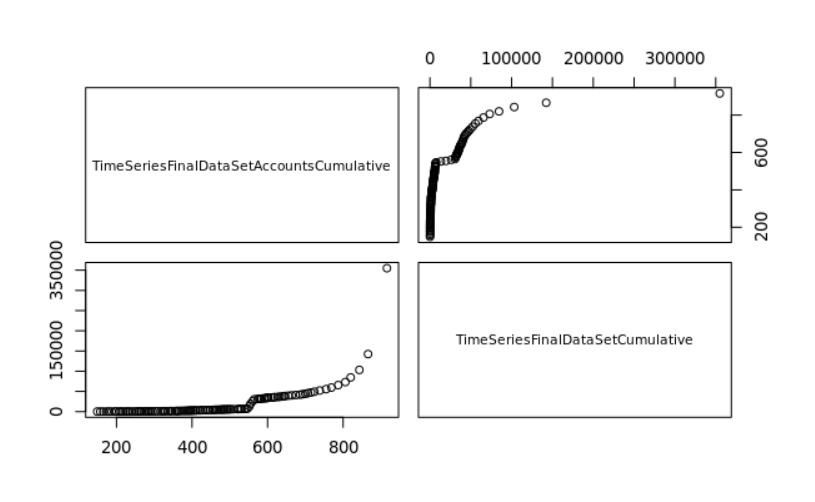
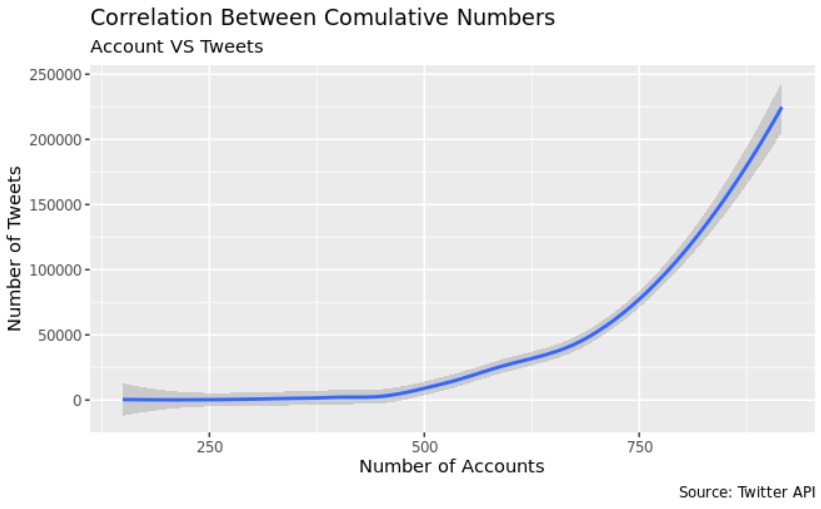
Lastly, our team performed a non linear regression to predict the cumulative number of tweets given the cumulative number of accounts. The graph demonstrate the exponential relationship between the cumulative number of accounts created and the cumulative number of tweets.
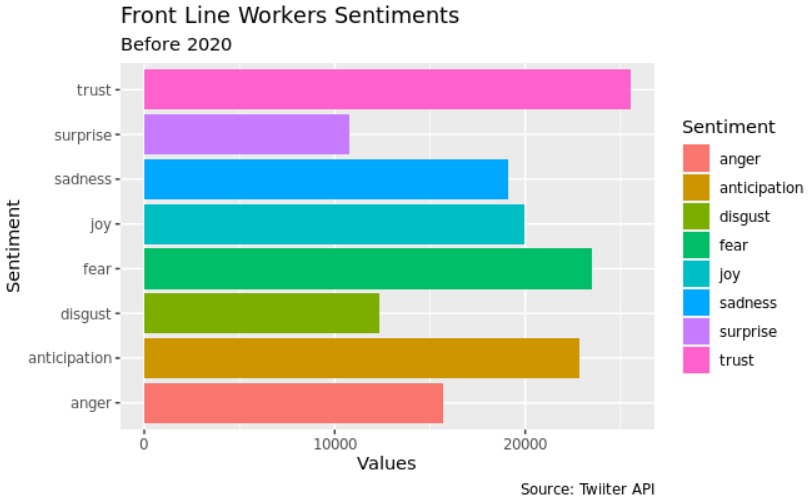
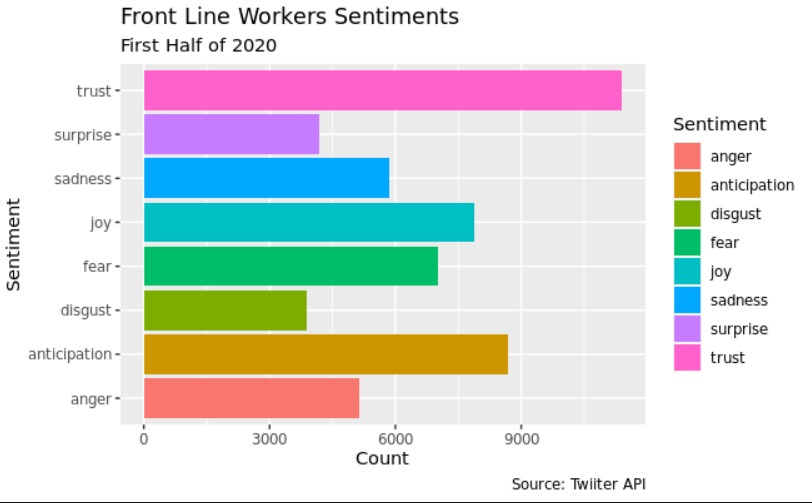
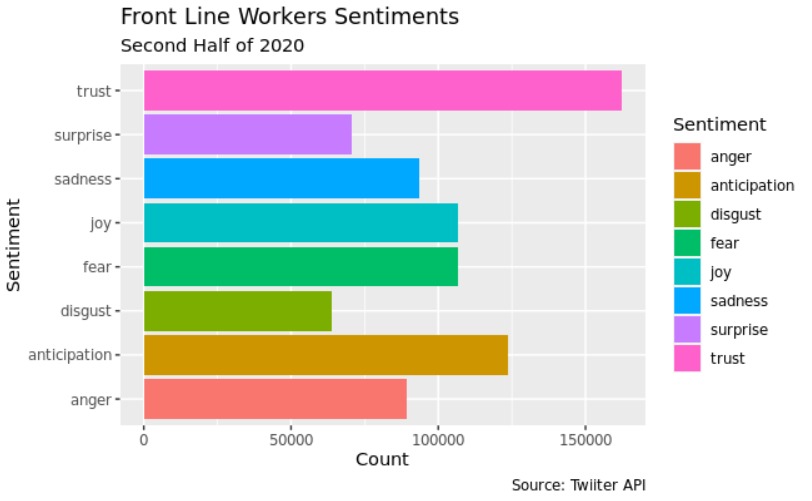
In other to interpret what the front line workers were saying in their tweets, our team utilized codes to remove punctuation, stop words of the english language(e.g., the), get the word stream (e.g., workers, working and worked were transformed in work), and to transform all the words in lowercase so the analysis could be done in the general idea rather than the specific message of the tweet. Also, after performing all the transformations in the tweets, our team utilized the NRC Word-Emotion Association Lexicon from the package syuzhet[18]. The package utilizes a crowdsource dictionary were people assigned several thousands of words to different feelings and emotions. The package utilizes those classifed words as references and classify the words from the tweets to the following categories:
| Sentiment | Emotion | Emotion | Emotion | Emotion |
|---|---|---|---|---|
| Positive | Trust | Joy | Antecipation | Surprise |
| Negative | Sadness | Disgust | Anger | fear |
500 more frequent words
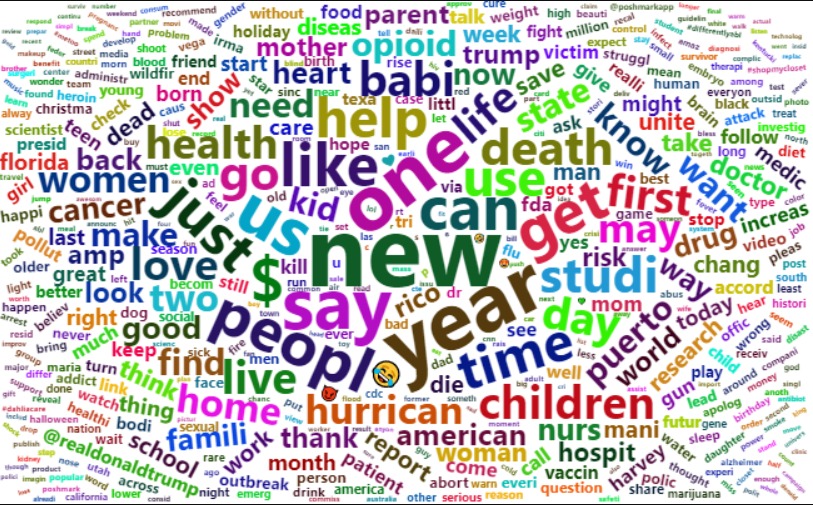
Top 10 Words
| Word | Frequency |
|---|---|
| new | 3120 |
| year | 2573 |
| one | 2455 |
| say | 2215 |
| us | 2158 |
| can | 1927 |
| poepl | 1919 |
| get | 1867 |
| like | 1853 |
| $ | 1849 |
500 more frequent words
Top 10 Words
| Word | Frequency |
|---|---|
| peopl | 1310 |
| just | 1190 |
| get | 1123 |
| like | 1082 |
| 😂 | 1008 |
| can | 1003 |
| go | 996 |
| one | 995 |
| need | 902 |
| time | 828 |
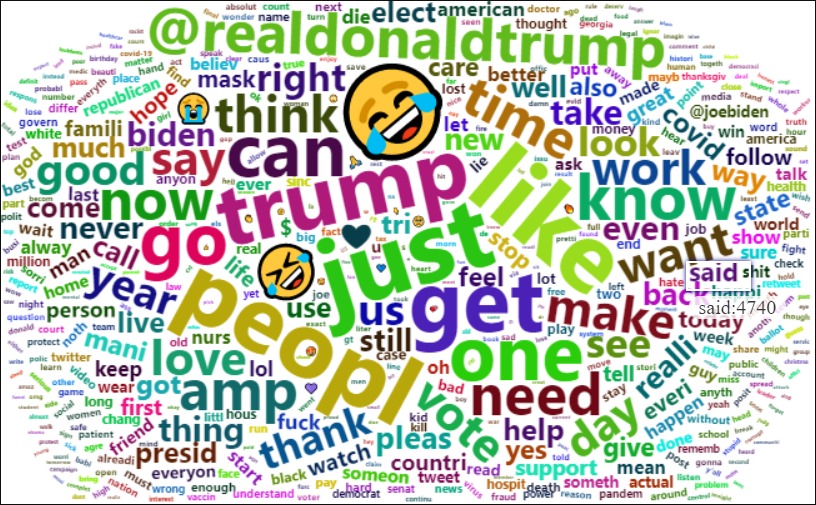
500 more frequent words
Top 10 Words
| Word | Frequency |
|---|---|
| just | 18359 |
| like | 18178 |
| peopl | 17245 |
| trump | 15794 |
| get | 15784 |
| 😂 | 15434 |
| one | 13887 |
| can | 13512 |
| go | 13067 |
| know | 11331 |
In other to analyse if there significant changes in how the front line expressed themselves in Twitter, our team peerformed a serie of proportion tests.
-
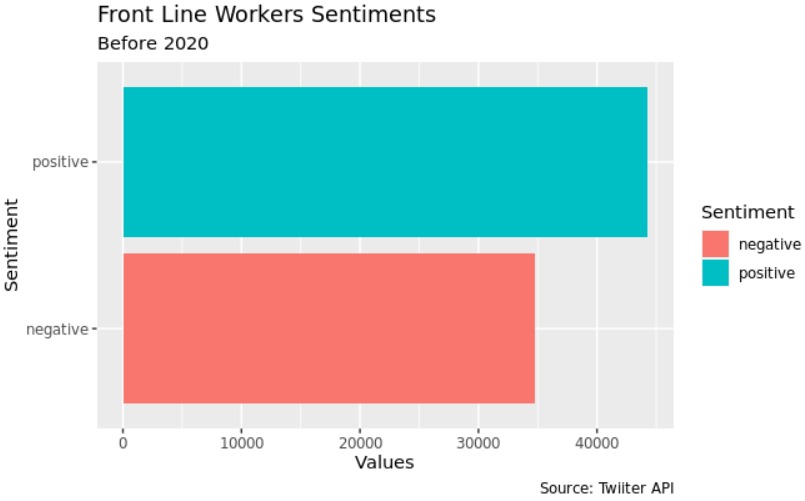
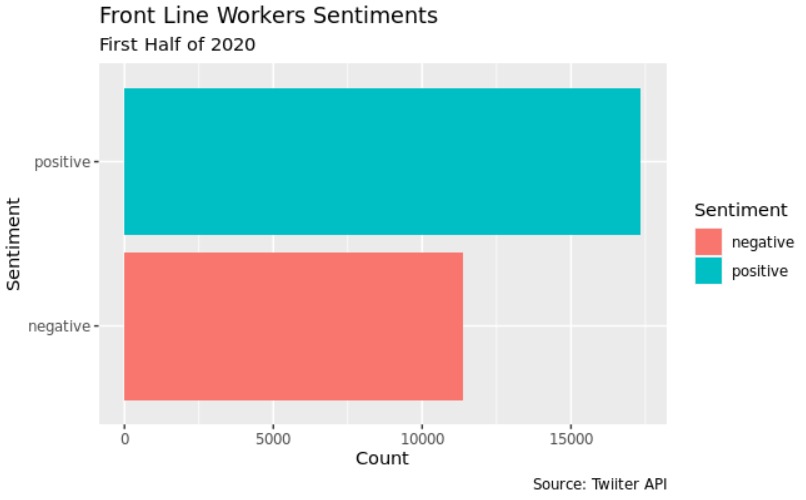
The proportion of front line workers that transmitted trust, surprise, joy and positive emotions throught the tweets in the first half of 2020 was significantly higher than before 2020 (p < 0.001)
-
The proportion of front line workers that transmitted fear, anger, sadness, and negative throught the tweets in the first half of 2020 was significantly lower than before 2020 (p < 0.001)
-
The proportion of front line workers that transmitted trust, surprise, anger, and positive throught the tweets in the second half 2020 was significant higher than the tweets before 2020 (p < 0.001)
-
The proportion of front line workers that transmitted fear, disgust, sadness, and joy throught the tweets in the first half of 2020 was significantly lower than before 2020 (p < 0.001)
-
The proportion of front line workers that transmitted disgust, surprise, anger, and sadness throught the tweets in the of the second half 2020 was significant higher than the tweets first half of 2020 (p < 0.001)
-
The proportion of front line workers that transmitted trust, joy, surprise, antecipation, negative, and positive throught the tweets in the second half of 2020 was significant lower than the tweets of first half of 2020 (p < 0.001)
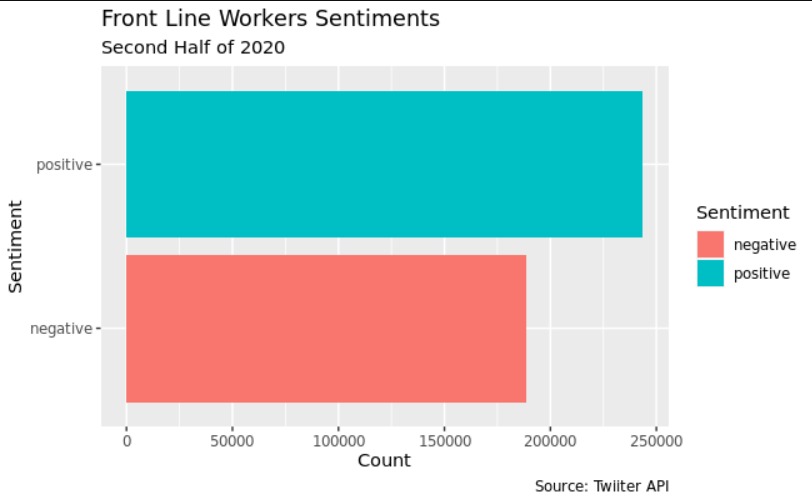
- The proportion of front line workers that transmitted negative sentiments throught the tweets was significantly lower than positive sentiments in all periods(p < 0.001)
- The proportion of front line workers that transmitted sadness throught the tweets was significantly lower than joy sentiments in all periods(p < 0.001)
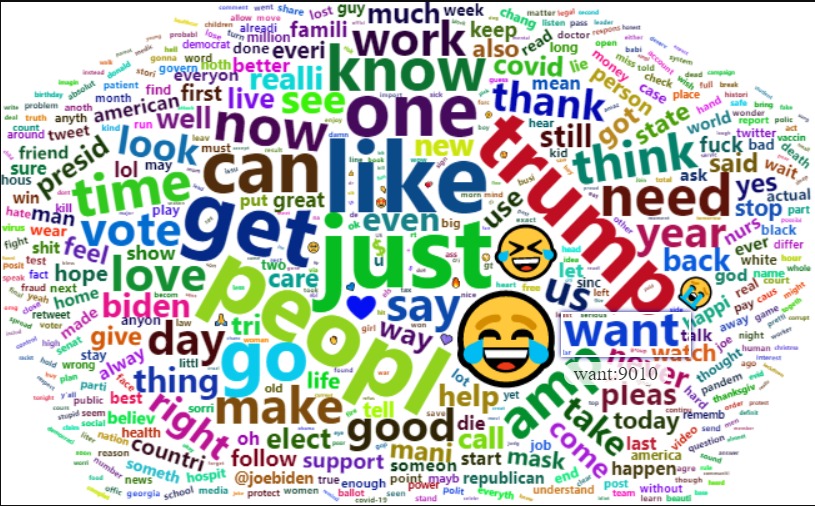
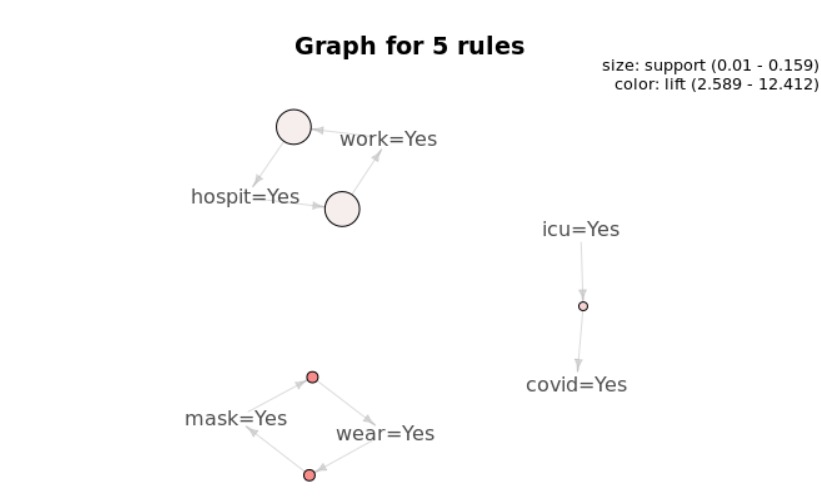
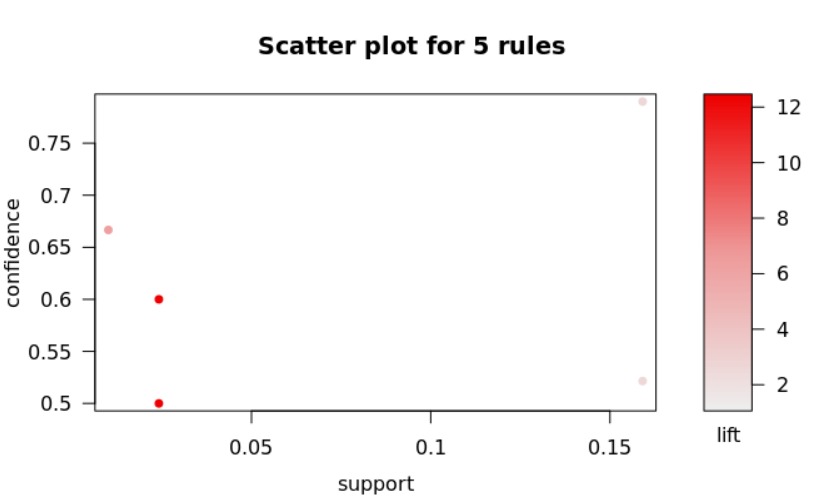
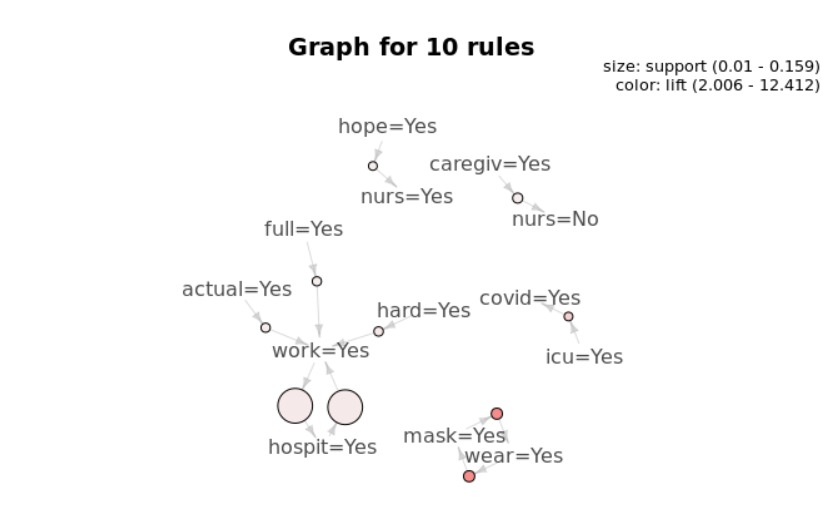
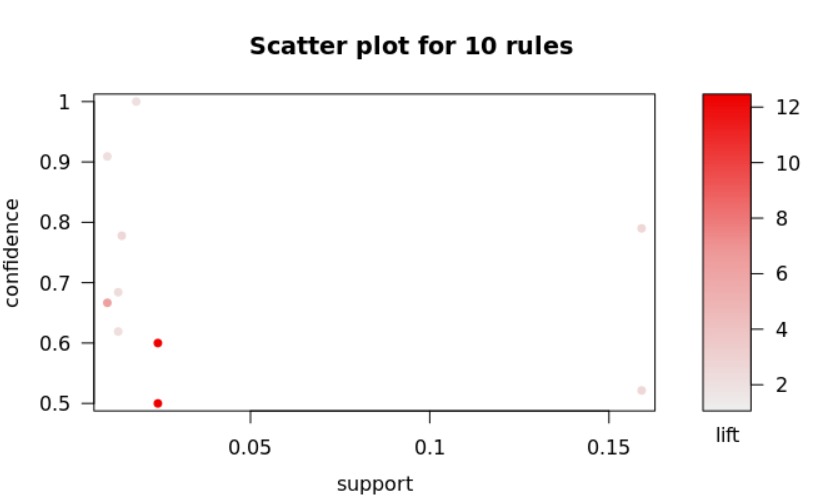
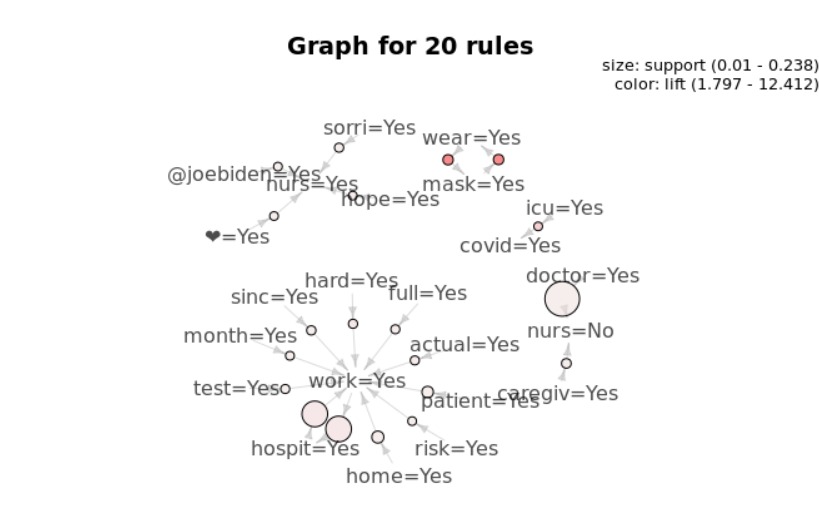
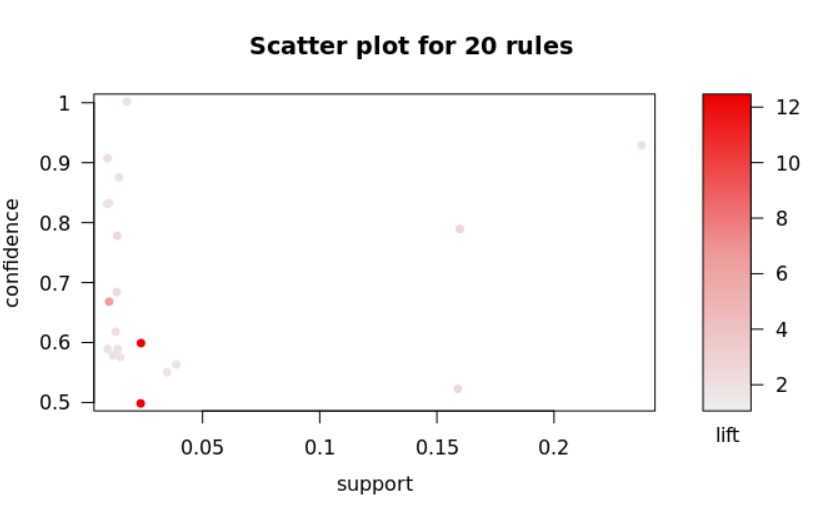
Our team not only interested in the sentiments that would be transmitted through the Twitter from the front line workers, but also interested in the words that the front line workers would speak, in specific in the context of mentioning themselves. Therefore, in other to perform the association rules, our team utilized the first data set of 993 observations were the Twitter users clearly stated that they were front line workers. The following graphs are ordered respectively by the 5, 10 and 20 words with the most expressive lifts. Our team utilized as threshold 0.01 of support and 0.5 of confidence that resulted in more than 200000 association rules
-
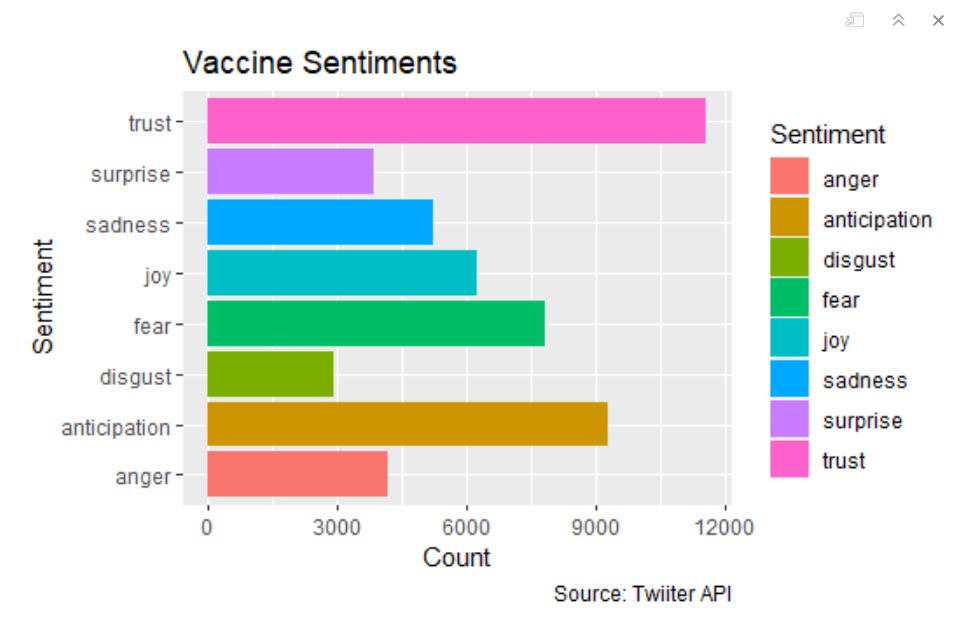
To create a sentiment analysis, we retrieved the emotions that were related to the COVID vaccine. We retrieved more than 18,000 tweets that included the word vaccine and #vaccine in the text. We later made a count of these words in each of the tweet phrases:
-
anger -anticipation
-
disgust
-
fear
-
joy -sadness
-
surprise
-
fear
-
joy
-
sadness
-
surprise
-
trust
We assigned a 1 to each time the tweet mentioned any of these words and at the end substracted the negative words from the positive words to understand if the overall sentiment of the tweet was positive or negative. We'll call this analysis "Vaccine Analysis 1"
Also, we conducted a different type of analysis ("Vaccine Analysis 2") where we found the tweets that were Semantic Differencial Adjectives (Opposites from each Other)
-
Semantic Differential Adjectives:
-
Excited vs Scared
-
Happy vs mad
-
Good vs Bad
-
Safe vs Dangerous
-
Hopeful vs Hesitant
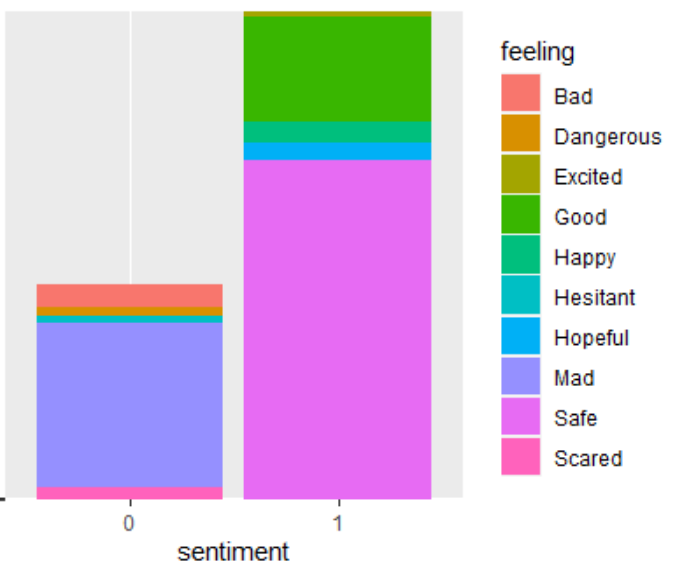
In the following graphs, you can see visualizations for "Vaccine Analysis 1". You can see the sentences that include these words in their tweets.

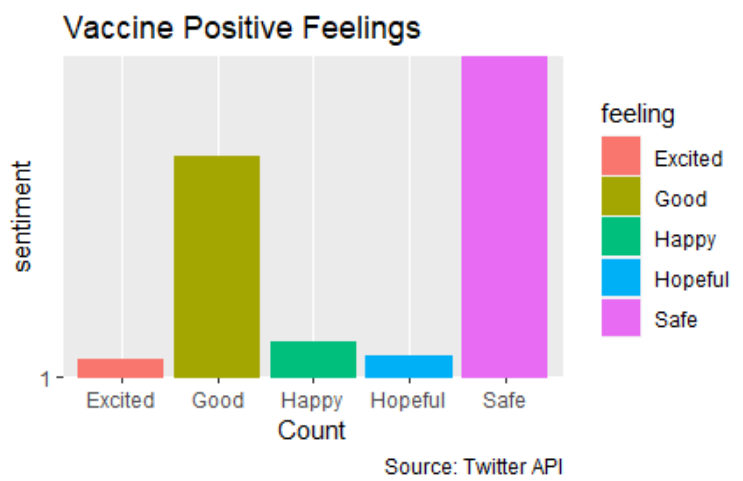
In the next graph, you can see the difference between the positive and negative feelings in each of the sentences.
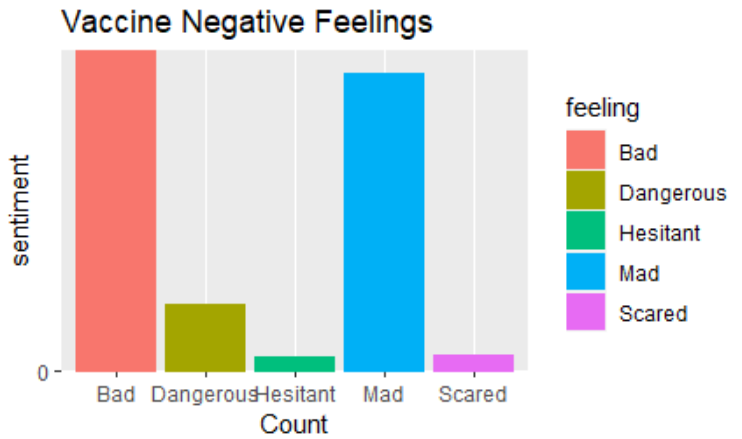
In this visualizations, you'll see how the semantic differentials appear and compare to each other on the tweets.
-
We conducted a Naive Bayes Model to see if given the user feelings, will the tweet have a positive negative sentiment?
-
The accurracy of this model was 0.5
There are more positive feelings related to the vaccine, the predominant feeling is “safe” followed by “hopeful” and “happy”. The predominant negative feelings are “scared”, “mad”, “hesitant”. Moreover, Twitter has become a relevant platform for the front line workers express themselves. As we saw the front line workers, despite all challenges, remained with a positive attitude, or better yet, with a positive attitude significantly higher than before. Therefore, lets respect the front line workers resiliency and do one of the major requests in the their tweets “Wear -> Mask”. As we can see, COVID-19 is a serious issue, even for those who are not in risk group, as we saw people who got COVID-19 also tweeted that they were feeling sick and had symptoms. Moreover, another word tweeted with COVID-19 was home, and therefore shows another challenge for those who tested positive: A complete social isolation for a period of 14 days. Regarding the vaccine, there are are more positive feelings associated to the vaccine, the predominant feeling is “safe” followed by “hopeful” and “happy”. The predominant negative feelings are “scared”, “mad”, “hesitant”.In conclusion, COVID-19 is a complex issue with the most diverse impacts in society, but its individual impacts are more salient for those who were directly exposed to the virus in the most diverse situations. There is hope, however, with the vaccines and the overall positive sentment of the population regarding the vaccines.
[1] R Core Team (2020). R: A language and environment for statistical computing. R Foundation for Statistical Computing, Vienna, Austria. URL https://www.R-project.org/.
[2] RStudio Team (2020). RStudio: Integrated Development for R. RStudio, PBC, Boston, MA URL http://www.rstudio.com/.
[3] Software Freedom Conservancy, Inc., 2020. [Online]. Available: https://git-scm.com/
[4] GitHub, Inc., 2020. [Online]. Available: https://github.com/
[5] Wickham et al., (2019). Welcome to the tidyverse. Journal of Open Source Software, 4(43), 1686, https://doi.org/10.21105/joss.01686
[6] Taiyun Wei and Viliam Simko (2017). R package "corrplot": Visualization of a Correlation Matrix (Version 0.84). Available from https://github.com/taiyun/corrplot
[7] Jarek Tuszynski (2020). caTools: Tools: Moving Window Statistics, GIF, Base64, ROC AUC, etc. R package version 1.18.0. https://CRAN.R-project.org/package=caTools
[8] Max Kuhn (2020). caret: Classification and Regression Training. R package version 6.0-86. https://CRAN.R-project.org/package=caret
[9] Hyndman R, Athanasopoulos G, Bergmeir C, Caceres G, Chhay L, O'Hara-Wild M, Petropoulos F, Razbash S, Wang E, Yasmeen F (2020). forecast: Forecasting functions for time series and linear models. R package version 8.13, <URL: https://pkg.robjhyndman.com/forecast/>.
[10] Hahsler M, Buchta C, Gruen B, Hornik K (2020). arules: Mining Association Rules and Frequent Itemsets. R package version 1.6-6, https://CRAN.R-project.org/package=arules.
[11] Michael Hahsler (2019). arulesViz: Visualizing Association Rules and Frequent Itemsets. R package version 1.3-3. https://CRAN.R-project.org/package=arulesViz
[12] Grolemund G, Wickham H (2011). “Dates and Times Made Easy with lubridate.” Journal of Statistical Software, 40(3), 1–25. https://www.jstatsoft.org/v40/i03/.
[13] Hadley Wickham (2019). stringr: Simple, Consistent Wrappers for Common String Operations. R Package version 1.4.0 https://cran.r-project.org/web/packages/stringr/index.html
[14] Feinerer I, Hornik K (2020). tm: Text Mining Package. R package version 0.7-8, https://CRAN.R-project.org/package=tm.
[15] Benoit K, Watanabe K, Wang H, Nulty P, Obeng A, Müller S, Matsuo A (2018). “quanteda: An R package for the quantitative analysis of textual data.” Journal of Open Source Software, 3(30), 774. doi: 10.21105/joss.00774, https://quanteda.io.
[16] Wickham H (2007). “Reshaping Data with the reshape Package.” Journal of Statistical Software, 21(12), 1–20. http://www.jstatsoft.org/v21/i12/.
[17] Blei, David M. and Ng, Andrew and Jordan, Michael (2003). Latent Dirichlet allocation. Journal of Machine Learning Research, 2003. https://cran.r-project.org/web/packages/lda/index.html.
[18] Jockers ML (2015). Syuzhet: Extract Sentiment and Plot Arcs from Text. https://github.com/mjockers/syuzhet.
[19] Dawei Lang, Guan-tin Chien (2018). Wordcloud2: Create Word Cloud. https://cran.r-project.org/web/packages/wordcloud2/index.html.
[20] Erich Neuwirth (2014). RColorBrewer: ColorBrewer Palettes. https://cran.r-project.org/web/packages/RColorBrewer/index.html
[21] Hothorn T, Hornik K, Zeileis A (2006). “Unbiased Recursive Partitioning: A Conditional Inference Framework.” Journal of Computational and Graphical Statistics, 15(3), 651–674. https://cran.r-project.org/web/packages/party/index.html
[22] Terry Therneau (2017). rpart: Recursive Partitioning and Regression Trees. https://cran.r-project.org/package=rpart
[23] Stephen Milborrow (2017). rpart.plot: Plot 'rpart' Models: An Enhanced Version of 'plot.rpart'. https://cran.r-project.org/package=rpart.plot
[24] David Meyer (2020) e1071: Misc Functions of the Department of Statistics, Probability Theory Group (Formerly: E1071), TU Wien
[25] Kearney MW (2019). “rtweet: Collecting and analyzing Twitter data.” Journal of Open Source Software, 4(42), 1829. doi: 10.21105/joss.01829, R package version 0.7.0, https://joss.theoj.org/papers/10.21105/joss.01829.
[26] Jeroen Ooms (2020) RMySQL: Database Interface and 'MySQL' Driver for R. Version 0.10.20. https://cran.r-project.org/package=RMySQL
[27] Jim Heste (2020) odbc: Connect to ODBC Compatible Databases (using the DBI Interface) https://cran.r-project.org/package=odbc
[28] Kirill Mülle (2019) DBI: R Database Interface. https://cran.r-project.org/package=DBI
[29] https://www.sciencedirect.com/science/article/pii/S156849462030692X