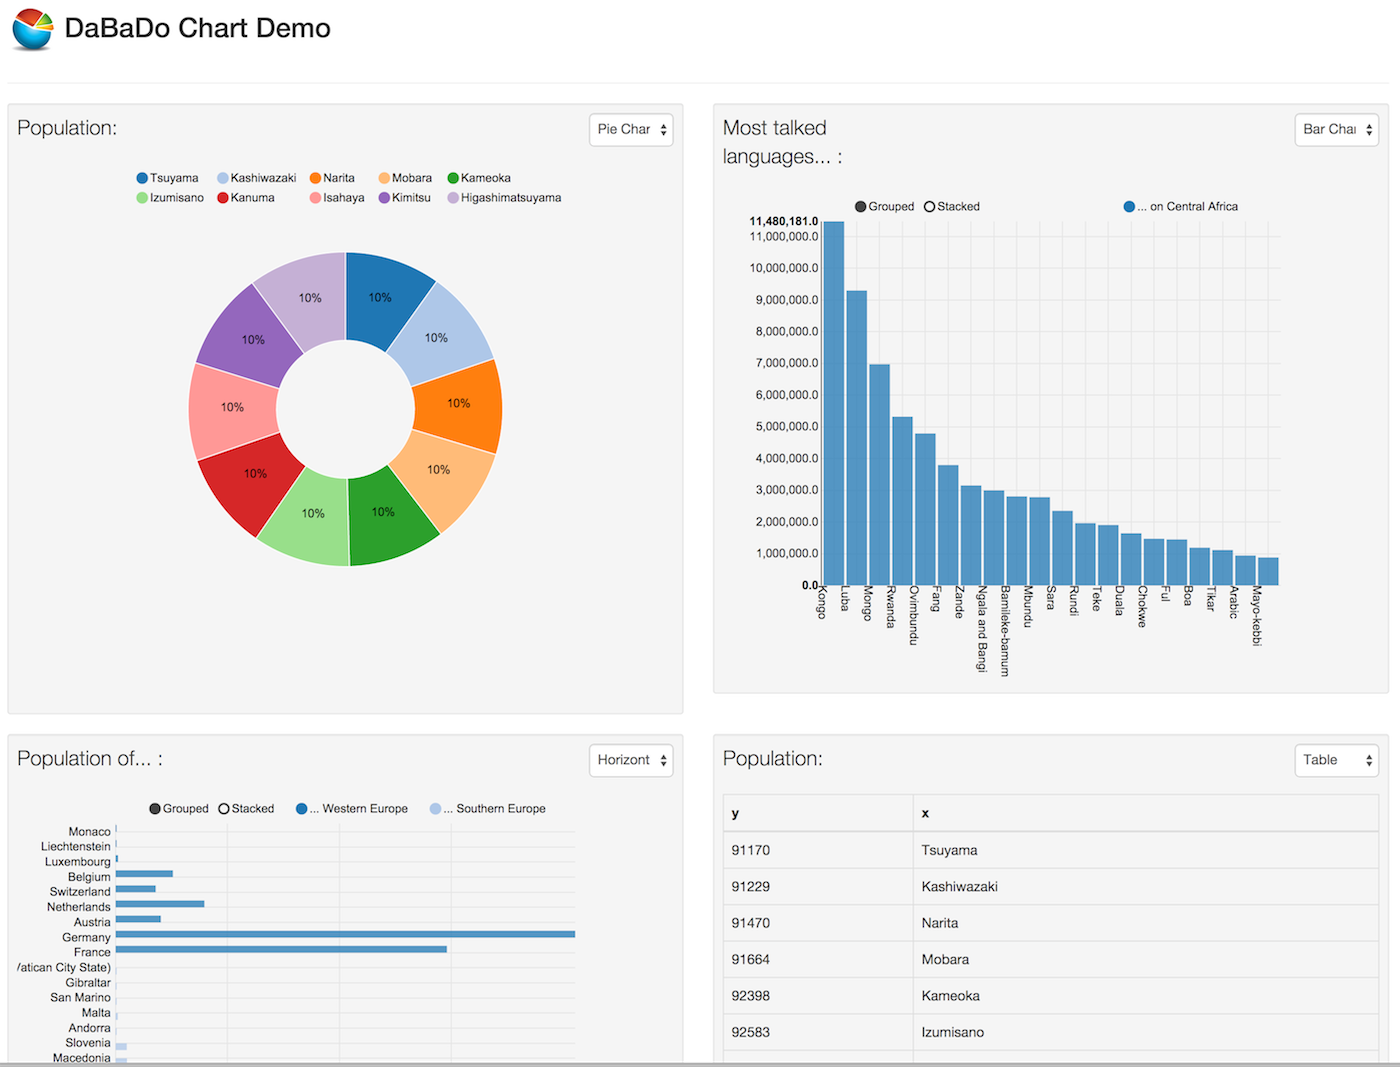
Splout is RESTful SQL Serving layer, usually used as Serving layer of a Lambda Architecture Hadoop System. Dabado ist a Angular.js Dashboard for Splout. It provides:
- Access to Splout's Tablespaces
- NVD3 (based on D3.js) charts
- Storing SQL statements and charts in a CouchDB
- Editing several Dashboards and Charts
- Special directives for custom Dashboards
- Simple support for date and range selection dropdowns
- install Hadoop
- install CouchDB for a server side storage of Dashboards (enable CORS for CouchDB see here)
- install Splout
- follow the Getting Started with Splout SQL to put some data into Splout
- pull this repo
- cd to repo
- npm install
- maybe change the routing (Proxy) configuration at /scripts/web-server.js (at the end of file) to point to the Splout server (this is because we have to proxy HTTP calls to Splout)
- start node with: node ./scripts/web-server.js
- browse to http://localhost:9099/app/index.html
- Dashboards contain a set of named Charts, that contain a set of SQL Queries
- The gear symbol opens two setup panes
- Type in your queries on the right pane "Chart and SQL" with Tablespace, Partition Key and SQL Query. Execute it with Execute Query.
- In general, the textbox SQL Queries can have more than one SQL query. One per line. The queries are executed in parallel and are added as data to the graphs (as long they can show more than one data).
- The SQL queries must have the columns "x" and "y" used for the graph axes (except table charts).
- The pane "Dashboard" on the left allows to create new Dashboards, adding and deleting new sets of SQL Queries
- The text box Queries as JSON contains a serialized version of the query table. You can send the JSON via email. If you receive a JSON, paste it into the left textbox "Table as JSON" and press the put into table button.
- File /app/demoSQL.json contains some test SQL statements. If the file is there, it get loaded automatically to the table.
- Table: Simple table, free value names (even 'select * from ...')
- Pie: Pie Chart, x value has to be a String, y value a number
- Bar: Bar chart. x value can be a date/time or a String, y value has to be a number
- Horizontal Bar: see Bar
- Line: Line chart. x value needs to be a date/time, y value has to be a number
- Line With Focus: see Line
- Line Plus Bar: see Line. The bar part can be signed by a chart name with '^' as first character (like "^ChartName" select time as x, amount as y from ...)
- Stacked Area: see Line
<div class="container-fluid" xmlns="http://www.w3.org/1999/html" ng-controller="dabadoDataController">
    <div class="page-header">
        <h1><img src="img/chart.jpg" style="width:50px;height:50px"> DaBaDo Chart Demo</h1>
    </div>
    <div class="row">
        <div class="col-md-6">
            <dabado-chart dash="default" chart="Population" show-legend="true" height="500" margin="{top: 1, right: 1, bottom: 1, left: 150}"></dabado-chart>
        </div>
        <div class="col-md-6">
            <dabado-chart chart-data="data[1]" show-controls="true" height="500" margin="{top: 10, right: 10, bottom: 100, left: 100}"></dabado-chart>
        </div>
    </div>
    <div class="row">
        <div class="col-md-6">
            <dabado-chart chart-data="data[2]" show-legend="true" height="500"></dabado-chart>
        </div>
        <div class="col-md-6">
            <dabado-chart chart-data="data[0]" show-legend="false" height="500" margin="1"></dabado-chart>
        </div>
    </div>
</div>- The general syntax of an SQL Statement is based on the SQL-Light Select statement
- for line based charts the x-axes is a date and the y-axes is the value
- Sql wise date has to be named x and the value has to be named y
- the WHERE clause may contain a :date variable that is automatically replaced by a from-to-date clause
- the WHERE clause may contain a range variable defined by a precedent distinct statement (see example)
"Chart Name" SELECT created AS x, sum(count) AS y FROM table_name WHERE :date group by created ORDER BY created:Airp select distinct airport from airports
"Airports:" SELECT created AS x, SUM(count) AS y FROM airlines WHERE airport like :Airp and :date GROUP BY created ORDER BY createdThe convert service (Angular JS service), converts all x values
?MyConvertServiceConvertsNameCodeToAirportName
"Airports:" SELECT nameCode AS x, size AS y FROM airports:Airp select distinct airport from airports
"^Airports:" SELECT name AS x, size AS y FROM airports
"Airports:" SELECT created AS x, SUM(count) AS y FROM airlines WHERE airport like :Airp and :date GROUP BY created ORDER BY created#Misc
##Create Example Dataset for Splout
Using Splout 0.2.5:
The best thing for getting started with Splout is launching a local server in your machine:
bin/splout-service.sh qnode start
bin/splout-service.sh dnode start
First, upload the examples folder to HDFS, as it contains the input files for all examples.
hadoop fs -put examples examplesLoad the table city from the CSV file city.csv and use the country_code field to partition it into 4 partitions:
hadoop jar splout-hadoop-0.2.5-hadoop-mr2.jar simple-generate --input examples/world/city.csv --output database-files --tablespace city_pby_country_code --table city --separator , --escape \\ --quotes \"\"\" --nullstring \\N --schema "id:int,name:string,country_code:string,district:string,population:int" --partitionby country_code --partitions 4Finally, deploy the results into Splout, using replication 2. That is, there will be 2 replicas per each partition:
hadoop jar splout-hadoop-0.2.5-hadoop-mr2.jar deploy --root database-files --tablespaces city_pby_country_code --replication 2 --qnode http://localhost:4412You should see something here now: http://localhost:4412/
Issue a Query: http://localhost:4412/api/query/city_pby_country_code?key=JPN&sql=SELECT%20*%20FROM%20city%20WHERE%20country_code%20%3D%20%22JPN%22