
Date: 14 & 15 December
Location: JADS Mariënburg Campus, Den Bosch
Sign Up: https://www.farmhack.nl/activiteiten/big-data-for-bees/
Forum: https://forum.farmhack.nl/t/about-the-big-data-for-bees-hackathon/77
On the 14th and 15th of December, at the Campus of the Jheronimus Academy of Data Science, we will be delving into Big Data and Bees with teams committed to building data driven solutions using big data technologies to help save the bees. The 30 hour hackathon is part of the National Bee Strategy.
Maxent modelled binary (0 or 1/presen or absence) predictions for Dutch butterfly species at the scale of The Netherlands.
Each column represents a butterfly species in the Netherlands and each row a 100 x 100 m grid cell in the Netherlands. A 1 indicates that a species is predicted by the model to occur in that grid cell and a 0 indicatesthat a species is not predicted by the model to occur in that grid cell.
The x and y coordiantes correspond to the centroids of the polygons in grid_100m_NL_rd.shp file.
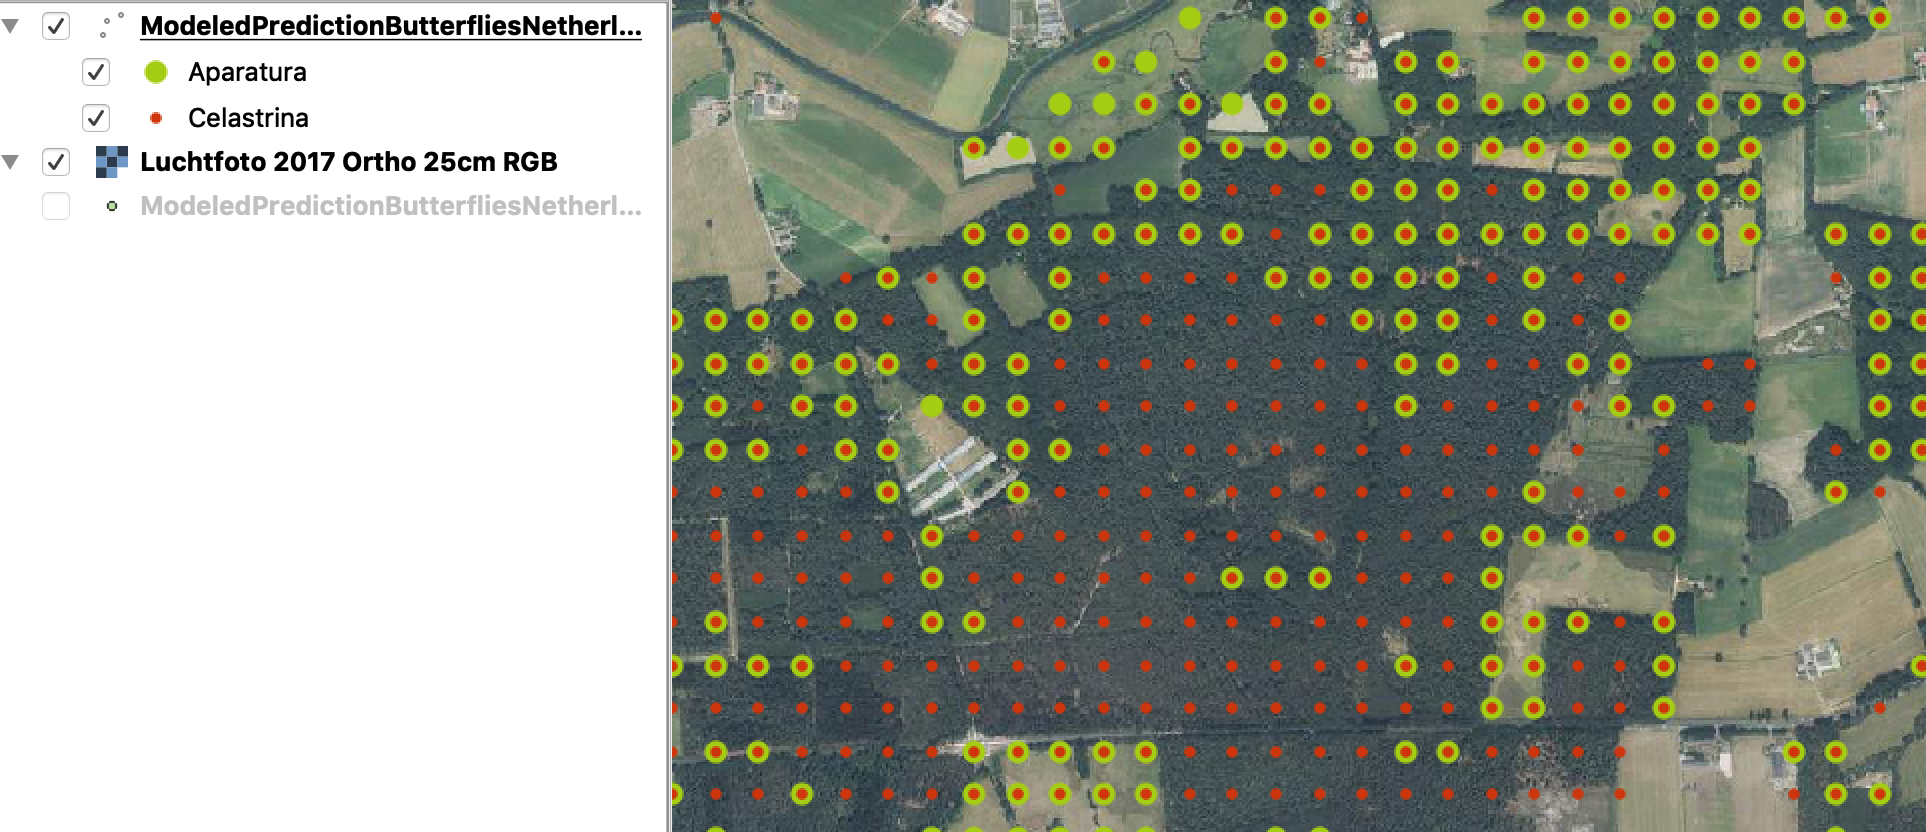
To show the predicted distribtuion of butterfly species across the Netherlands in unsampled areas.
The modeling is conducted using a species distribution modeling approach. Species distribution models create a mathematical representation of a known species' distribution within the environmental space. We used the software, MaxEnt (version 3.4.0). For each species we run five models with linear and quadratic terms allowed.
Filetype: CSV, GeoPackage
Coodinate system: Amersfoort / RD New
Dimensions: 91 Columns 3999220 Rows
Butterfly Species: 89
Maxent modelled binary (0 or 1/presen or absence) predictions for Dutch wild bee species at the scale of The Netherlands.
Each column represents a wild bee species in the Netherlands and each row a 100 x 100 m grid cell in the Netherlands. A 1 indicates that a species is predicted by the model to occur in that grid cell and a 0 indicatesthat a species is not predicted by the model to occur in that grid cell.
The x and y coordiantes correspond to the centroids of the polygons in grid_100m_NL_rd.shp file.
To show the predicted distribtuion of wild bees across the Netherlands in unsampled areas.
The modeling is conducted using a species distribution modeling approach. Species distribution models create a mathematical representation of a known species' distribution within the environmental space. We used the software, MaxEnt (version 3.4.0). For each species we run five models with linear and quadratic terms allowed.
Filetype: CSV, GeoPackage
Coodinate system: Amersfoort / RD New
Dimensions: 264 Columns 3999220 Rows
Wild Bee Species: 262
Maxent modelled binary (0 or 1/presen or absence) predictions for Dutch plant species at the scale of The Netherlands.
Each column represents a plant species in the Netherlands and each row a 100 x 100 m grid cell in the Netherlands. A 1 indicates that a species is predicted by the model to occur in that grid cell and a 0 indicatesthat a species is not predicted by the model to occur in that grid cell.
The x and y coordiantes correspond to the centroids of the polygons in grid_100m_NL_rd.shp file.
To show the predicted distribtuion of plants across South Holland in unsampled areas. The selection of species was chosen to represent species important or unique to South Holland.
The modeling is conducted using a species distribution modeling approach. Species distribution models create a mathematical representation of a known species' distribution within the environmental space. We used the software, MaxEnt (version 3.4.0). For each species we run five models with linear and quadratic terms allowed.
Filetype: CSV, GeoPackage
Coodinate system: Amersfoort / RD New
Dimensions: 141 Columns 3999220 Rows
Plant Species: 139
- Classification of The Netherlands in different sub-areas with a characteristic species pool of pollinators (bees and hoverflies), including the list of species per sub-area. It is interesting to note that in many parts of the agricultural area one and the same species pool occurs (a small number of species that do not have too many special requirements). (pdf report + excelfile with species groups).
- Information per sub-area on the type of nesting place that the pollinators need there. This shows, among other things, peer sub-area what percentage of the species nest below or above ground. (excel).
- Shortlists with relevant bee plants per sub-area, based on A) the plants that can grow in that region and B) the species that are valuable as food for the local bee species. Separate lists for woody plants and herbs. (excel).
- List ('choice palette') of most relevant measures per field type (farm, garden, business park, etc). (excel).
- The LARCH model, which makes it possible to visualize the spatial network of suitable living areas on the basis of GIS maps (including BGT land use, supplemented with GIS tool for supplementary use by site managers).
- a classification of bees in 'eco-profiles': groups of species that are somewhat similar in their use of the landscape (habitat requirements and flight distances). Those eco-profiles are used in the LARCH model.
De AgroDataCube is "A Big Open Data collection for Agri-Food Applications". De Cube bevat o.a. de volgende datasets die via een RESTful API te op vragen zijn:
- Gewasregistratie van Nederland, 2012 – 2018.
- Dagelijks weer van 50 KNMI meteostations, 01-01-1950 – 28-11-2018.
- AHN2 data voor Nederland.
- Per gewasperceel opvraagbaar:
- AHN2 statistische informatie: count, sum, mean, stddev, min, max.
- NDVI tijdserie (gemiddelde en standraard afwijking van de NDVI waarde per perceel, ongeveer 50 waarden per jaar), 2013 – 2018.
- Bodemtypes 1:50.000, bepaald uit intersect van perceel met de Bodemkaart 1:50.000 uit 2014.
- Info over de 50 KNMI meteostations, incl. locatie.
- Administratieve grenzen van provincies, gemeente, postcodegebieden uit 2015.
- Volledige lijst met gewascodes (van de gewasregistratie).
- Volledige lijst met bodemtypes en bodemcodes (van de bodemkaart 1:50.000).
- BOFEK (2012) - De informatie in het databestand kan dienen als invoer bij modelberekeningen van water- en stoffentransport in de bodem. Toepassingsschaal: 1 : 50 000 – 1 : 1 000 000