This is the code for kaggle competition "OTTO – Multi-Objective Recommender System". OTTO is Germany's largest online retailer. The competition data is real life new users' sessions on OTTO website. The task is to predict which exact next item user is going to click next and which items user is going to add to cart or order before the end of the test period. The test dataset includes one week of user sessions, truncated at a random point. Organizers also provide participants with history of full new user's sessions for four weeks, preceding the test period. No metadata is available for any of the items that show up in any of the datasets. Participants only have item ID's, that are called AIDs, and there are about 1.8 mln AIDs showing up in the competition data, including both full and truncated user sessions.
From the beginning, I have decided to use Jupyter notebooks run on the Kaggle website (Kaggle kernels) to produce the solution. However, Kaggle kernels have a number of limitations. Firstly, Kaggle notebooks without GPU support at the time of the competition had a RAM limit of 30 GB. That caused several problems, for example, I had to spend some time writing code that would merge two dataframes chunk by chunk, as using a simple merge would cause a memory error. Kaggle kernels with GPU available had a RAM limit of just 13 GB, which made me choose between some features instead of using all of them. Then, Jupyter notebooks were not designed for projects with complicated data pipelines. The total number of notebooks used to produce the final solution is 28, and that number does not include a few more notebooks I created during the competition to test some approaches that did not bear fruit.
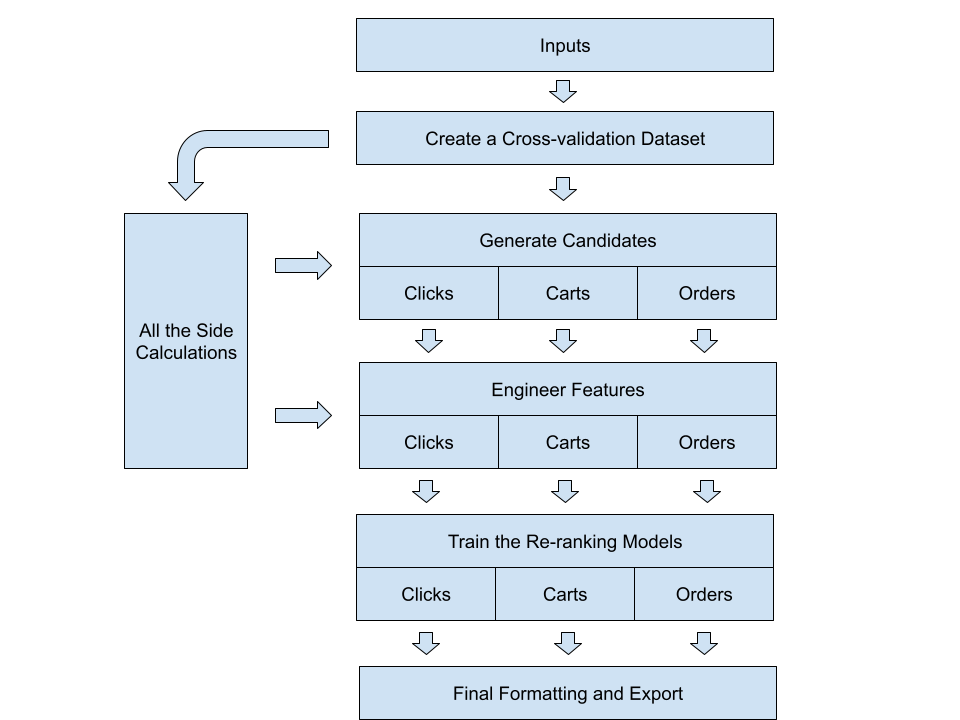
The solution's pipeline includes the following major stages:
- creating a cross-validation dataset from the last week of known full sessions, similar to the test dataset;
- calculating co-visitation matrixes, word2vec models and making some other calculations aside of the main pipeline;
- generating candidates for both cross-validation and test datasets;
- engineering features for the datasets;
- training the GBDT re-ranking models on the cross-validation dataset and using those models to select most relevant candidates, generated for the test sessions;
- some final formatting and submitting the results.
Generating candidates, engineering features, training models and making final predictions use separate data pipelines for clicks, carts and orders. For each of these predictions, a dedicated re-ranking model is trained on a different dataset, for different candidates, and using a slightly different set of features.
For each session data we know session ID and sequence of events, each event includes AID, a timestamp, and event type, which could be either click, cart or order. There are total 12.9 mln full sessions, and a median full session has 6 events, while there are 1.7 mln truncated sessions in the test dataset and a median truncated session has just 2 events. More than 90% of all events are clicks, most sessions are short and only include clicks.
For every session in the test dataset, competitors predict 20 clicks, 20 carts and 20 orders. Here is the formula used to score the predictions:
score = 0.1Rclicks + 0.3Rcarts + 0.6*Rorders ,
and each of the R values is a recall that could take values between 0 and 1. So, the coefficients are set in a way that makes predicting orders more important than predicting carts, and predicting carts more important than predicting clicks.
Here is the full list of notebooks, used in the project pipeline:
- notebooks with common code
- OTTO common (otto-common.ipynb)
- OTTO common feature engineering (otto-common-fe.ipynb)
- creating a cross-validation dataset
- Prepare cross-validation (otto-prepare-cv.ipynb)
- calculations aside of the main pipeline
- "Regular" co-visitation click2click matrix (otto_click2click_regular.ipynb)
- "Experimental" co-visitation click2click matrix (otto-click2click-experiment.ipynb)
- Click2buy and buy2buy co-visitation matrixes (otto-click2buy-buy2buy.ipynb)
- Click2buy short co-visitation matrix (otto-click2buy-short.ipynb)
- W2vec model for clicks (otto-word2vec-clicks.ipynb)
- W2vec model for carts and orders (otto-word2vec-carts-orders.ipynb)
- Calculations for clicks (create-counts-for-clicks.ipynb)
- Calculations for buys (create-counts-buys.ipynb)
- generating candidates
- Generate candidates for clicks (otto-click-candidates-generation.ipynb)
- Generate candidates for carts (otto-generate-candidates-carts.ipynb)
- Generate candidates for orders (otto-generate-candidates-orders.ipynb)
- engineering features
- Feature engineering for clicks model (otto-feature-engineering-clicks.ipynb)
- Feature engineering for carts model (otto-feature-engineering-carts.ipynb)
- Feature engineering for orders model (otto-feature-engineering-orders.ipynb)
- W2vec features for clicks (otto-clicks-w2vec.ipynb)
- W2vec features for carts (otto-carts-w2vec.ipynb)
- W2vec features for carts (part_1) (otto-carts-w2vec-part1.ipynb)
- W2vec features for orders (otto-orders-w2vec.ipynb)
- W2vec features for orders (part_1) (otto-orders-w2vec-part1.ipynb)
- training and predicting
- Clicks Model and Prediction (otto-model-clicks.ipynb)
- Carts Model (otto-model-carts.ipynb)
- Orders Model (otto-model-orders.ipynb)
- Carts Prediction (otto-carts-prediction.ipynb)
- Making and combining predictions for orders (otto-orders-predict-combine.ipynb)
- final formatting and submitting the results
- OTTO Upload (otto-upload.ipynb)
Organizers have published the code they have used to produce the test dataset. It actually cuts all the sessions that started before the test period and continue into test period. Then, it selects sessions that have started during test period and filters out sessions with AIDs not met in any session before test period (short sessions, of course, are more likely to pass through that filter). After that the unfiltered sessions are truncated at a random point, leaving at least one known and at least one unknown event. As an output we have a shortened file of full sessions, a cross-validation file of truncated sessions and a file with labels.
I used this code to produce 2 different cross-validation datasets with different random seeds. The intention was to check at some point whether results for different cross-validation sets differ and probably to try using features generated for two datasets to train two models and then take an average prediction. While working on the project, I have several times compared intermediate results for the two datasets, and every time I found no significant difference. I have also tried using two models built upon different cross-validation datasets to predict orders, but this improved results just a little bit. So, calculating all the features for both cross-validation datasets was not worth the effort.
In the same notebook I also converted all the data, including inputs and cross-validation sets, from json to parquet, changed datatypes from int64 to int32, and mapped event types to integers (0 - clicks, 1 - carts, 2 - orders) to reduce memory usage.
With cross-validation datasets ready, it was possible to get additional insights on the test dataset and on the events I was going to predict. The number of full sessions in history was reduced to 10.6 mln, and the cross-validation datasets had 1.8 mln truncated sessions. Out of that number, only about 300,000 sessions, or 17%, had at least one AID carted and about half of that number, about 150,000 sessions, or 8%, had at least one AID ordered. The vast majority of sessions did not have cart or order labels. This meant cart and order predictions for most short sessions did not matter, as only predictions for sessions with some actual carts or orders gave points. At the same time, almost all the sessions had a single ground truth value for clicks.
These notebooks include notebooks calculating the co-visitation matrixes, w2vec models and multiple other calculations combined into 2 notebooks "create counts for clicks" and "create counts for buys" (here "buys" means any non-click event, i.e. either cart or click). All the calculations in those notebooks are repeated at least twice: once for the cross-validation dataset and then for the full data, in a few cases the calculations need to be made separately for each cross-validation dataset.
Code to calculate the co-visitation matrix is 90% the same for all the matrixes I have tried for this project. So, I've written a class and moved it to the OTTO common notebook, so, that it could be used to create a child class for each case to count different types of co-occurring events. These notebooks have very little code, and they take 2 to 4 hours to run.
Here is the full list of co-visitation matrixes, used to produce the final result:
- "Regular" co-visitation click2click matrix (otto_click2click_regular.ipynb) counts two events of any type in a session, if time between them is less than 5 minutes. Weight coefficient is calculated in a way that makes later events to have higher weights. The ordering of events does not count for this matrix, this means that if two events are close to each other in the same session, it does not matter which one of them comes first. This matrix is used both for click candidates generation and to calculate a feature (wgt_matrix) for the clicks model.
- "Experimental" co-visitation click2click matrix (otto-click2click-experiment.ipynb) counts two events of any type in a session, if time difference between them is less than 5 minutes and there are no more than 20 events between them. Weight coefficient is calculated in a way that makes later events to have higher weights. The ordering of events does count for this matrix, this means that aid_y is only counted if it comes after aid_x. I tried to use this matrix to generate click candidates, but "regular" matrix showed better result. In the final pipeline, this matrix is used to calculate a feature (wgt_exp) for the clicks model.
- Click2buy co-visitation matrix (otto-click2buy-buy2buy.ipynb) counts events in a session, if the later event is a buy (either cart or order) and time difference between them is less than 10 hours. The weight value is calculated in a way that makes pairs of events with smaller time difference more important. This matrix is used both for carts and orders candidate generation and to calculate 2 features (wgt_c2buy_full and wgt_c2buy_6_from_full) for carts and orders models.
- Buy2buy co-visitation matrix (otto-click2buy-buy2buy.ipynb) counts events in a session, if both of them are buys and time difference between them is less than 5 days. The weight value is always equal to, so each pair of events is equally important. This matrix is used to calculate a feature (wgt_buy2buy) for carts and orders models.
- Click2buy short co-visitation matrix (otto-click2buy-short.ipynb) counts events in a session, if the later event is a buy (either cart or order) and time difference between them is less than 2 hours. The weight value is calculated in a way that makes pairs of events with smaller time difference more important. Comparing to previously mentioned click2buy co-visitation matrix, in this one time difference is limited to much shorter time and the weight value declines much faster as time between the events increases. This matrix is used to build a feature (wgt_c2buy_short) for carts and orders models.
- Exact next click-to-click co-visitation matrix (create-counts-for-clicks.ipynb) counts only exact next, regardless of their type or of time passed between them. This is the fastest matrix to calculate, so it doesn't have a dedicated notebook, and is calculated in the same notebook with some other side calculations for the clicks model. This matrix is used to calculate two features for the clicks model: 'wgt_last' and 'wgt_before_last'.
Notebooks with w2vec model generation both have very few of rows with code. Information about event type and event time is removed from full sessions, so, the sequence of AIDs is the only information kept. That information is used then to the w2vec model, using sequences of AIDs as "sentences" and AIDs as "words". These notebooks take significant time to run: it takes about 3 hours to train models for cross-validation and test datasets, using the first 3 weeks of full sessions or all the known full sessions correspondingly.
I had an intuition, that a w2vec model with a longer window would be more useful for carts and orders models, while a model with shorter window would produce better results for the clicks model. I've made the checks during the competition, trying both w2vec models to produce features for each of GBDT models, and confirmed that this is true. So, I kept using two different w2vec models trained with slightly different parameters. However, the difference in performance between the two w2vec models was relatively small, so I choose not to make any additional experiments with changing the models' parameters and tried some other ideas instead.
List of side calculations made in "Calculations for buys" notebook:
- conversion rate - means conversion from click to either cart or order;
- conversion to carts - conversion from either clicks, previously carted AIDs or previously ordered AIDs to carts;
- conversion to orders - conversion from either clicks, carts or previously ordered AIDs to new orders;
- average per AID clicks before buy;
- daily total carts/orders per AID;
- average w2vec similarity between the last one AID in session and 5 AIDs before it.
List of side calculations made in "Calculations for clicks" notebook:
- median time users view AID;
- average per day clicks per AID;
- return rate, counting how often users return for a new click or other actions with the same AID;
- exact next click-to-click co-visitation matrix, that has been already mentioned earlier.
The generation of candidates is rules-based for all the three pipelines. I've spent significant time trying to improve the candidate generation process, probably put too much effort in it.
I generally use three sources of candidates: session history AIDs, co-visitation matrixes applied to session history AIDs and daily most popular AIDs. Depending on the number of candidates, I use different hand-picked coefficients that define limits to the number of candidates coming from each source. I've started with using 50 candidates for all the three models, then moved to 75 candidates both for carts and orders. Before the very end of the competition, I've planned to start using 75 candidates for the clicks model as well. But this model has the lowest coefficient in the competition metric, and at the same time it is the most demanding model in terms of memory usage. So, I kept using only 50 candidates for the clicks model.
For clicks model I use the lowest number of AIDs from session history, as the model is aimed at guessing the exact next AID clicked, and AIDs clicked some time ago are usually less relevant. So, I take latest AIDs from session history as candidates, then add AIDs from the co-visitation matrix for the exact last AID, then add to the list most common AIDs suggested by the co-visitation matrix for a few last AIDs in session history. Then I remove duplicates from the list and cut it to get the desired number of candidates. If after removing all the duplicates there are fewer AIDs in the list than the desired number of candidates, then I add AIDs from daily top of most popular AIDs (after checking for each one that it not present in the list already). For 20 click candidates, my best result was 52.68% percent guessed, while for 50 candidates it was 60.43%.
For cart and order candidates I also take latest AIDs from session history, first latest buys, then all the latest AIDs, then add most common AIDs suggested by the co-visitation matrix for the last buys and then add to the list most common AIDs suggested by the co-visitation matrix for all the last AIDs in session. All the constants, like maximum buys to take from session history, maximum aids to take from session history, maximum number of AIDs, suggested from buys e.t.c. vary for carts/orders and depending on number of candidates, but the logic is mostly the same. Then, like when generating candidates for clicks, I remove duplicates from the list and cut it to get the desired number of candidates. If after removing all the duplicates, there are fewer AIDs in the list than the desired number of candidates, then I add AIDs from daily top of most carted/ordered AIDs (after checking for each one that it not in the list already). For 20 cart candidates, my best result was 40.68% percent guessed, while for 75 candidates it was 47.12%. For orders, the best result for 20 candidates was 64.84%, while for 75 candidates it was 68.95%.
We can see that percent of correctly guessed orders is much higher, than percent of guessed carts. The main reason is that all the carted AIDs have a very high chance to be ordered, and it is possible to make an obvious move and suggest all previously carted AIDs are going to be ordered, and get a good percent of guessed items. But it is harder to guess carts, as recently viewed AIDs have a much lower chance to be added to cart.
Note: this code was written for kaggle competition and to produce good competition result I did a few things, that wouldn't make sense in creating a real life recommendation system. When generating candidates, some information from the future is used, as daily top clicks/carts/orders are not known until the day is over. At the beginning of the competition, organizers answered questions and explained that it would be ok to use forward-looking features, and I understood that other participants would use such features. So, I've also used some information from the future for generating candidates and for creating features for the re-ranking models.
The three feature engineering notebooks take time to run and were the longest notebooks in terms of lines of code. I had to move some calculations to "Calculations for clicks" and "Calculations for buys" notebooks, and also moved definitions of functions, common to several feature engineering notebooks, to a dedicated notebook "OTTO common feature engineering". To further speed up the notebooks, I had to rewrite some code using polars library instead of pandas. All of this made the notebooks manageable in terms of run time and complexity.
Notebooks that calculate the w2vec features for carts and orders take even more time to run, than the corresponding notebooks that calculate all the other features. So, I decided to split each of those notebooks into two notebooks, each processing its chunk of test data. Already after the competition I tried several improvements that increased feature calculation speed, but even with that improvement it takes about 3 hours to calculate the w2vec features for each chunk of the test data.
As many features are common between the notebooks, I will now provide features used at least in one of the models in a single list.
- Session history features (value is equal to some constant if candidate AID is not present in the session):
- n - 0 for the last viewed AID, 1 for AID last viewed before, e.t.c, 125 for AIDs never viewed;
- time_delta - time in seconds from a moment when AID was last viewed to the last action in session;
- type_last - 0 if no buys for the AID in the session, 1 if the last buy is a cart, 2 if the last buy is an order;
- count_views - number of interactions with AID in the session;
- time_viewed - time from user's click on candidate AID until next event, clipped to 180 seconds and then summed for all interactions with the AID.
- Other session features (features, that only depend on session):
- ts_diff - time in seconds between last event and event before last;
- session_time - time in seconds from first to last event in the session (used in carts and orders models only);
- events_last_3hours - total number of events last 3 hours of session (used in carts and orders models only);
- buys_this_session - total number of cart/order events in session (used in carts and orders models only);
- history_mean - w2vec mean similarity between last AID and previous 4 AID before that (used in carts and orders models only);
- buys_in_session - 0 if no buys, 1 if only carts, 2 if at least 1 order is present in session (used in orders model only).
- Global per AID average counts:
- daily_aid_count - normalized count of events with AID for the previous day;
- same_day_aid_count - normalized count of events with AID for the day;
- aid_count_weekly - normalized count of events/carts/orders with AID for the week;
- aid_counts - total interactions with candidate AID in full sessions (used in clicks model only);
- aid_counts_buys - total buys for candidate AID in full sessions (used in orders model only);
- aid_counts_orders, aid_counts_carts - total orders/carts for candidate AID in full sessions;
- conv - simple conversion rate, number of sessions with AID bought divided by total number of sessions with any event with AID (used in carts model only);
- total_2order_conv, total_2cart_conv - feature depending on type_last feature. If AID was has no buys, here is conversion rate from views to orders, else - conversion rate from carts to orders or from an order to a second order. Similar feature was constructed for carts, with click2cart, cart2cart and order2cart conversion rates (used in carts and orders models only);
- clicks_before_buy - how many times on average, AID is clicked before first buy (used in carts and orders models only);
- time_viewed_clipped - for how long on average AID is viewed before first buy, before averaging values clipped to 180. This feature has low importance and I thought about removing it, but experiment showed results go a bit down in that case.
- Features built using co-visitation matrixes and w2vec for the clicks model:
- wgt_matrix - sum of co-visitation matrix weights for the last 5 AIDs, using "regular" co-visitation click2click matrix (same co-visitation matrix that was used for candidate generation);
- wgt_exp - sum of co-visitation matrix weights for the last 10 AIDs normalized by n (divided weight by 1 for the last AID, by 2 for AID before it, then by 3 and so on), using "experimental" co-visitation click2click matrix;
- wgt_last - exact next click-to-click co-visitation matrix values for the last AID in the session;
- wgt_before_last - exact next click-to-click co-visitation matrix values for the last AID in the session;
- similarity_first - w2vec similarity between candidate and last AID;
- similarity_second - w2vec similarity between candidate and AID before last.
- Features built using co-visitation matrixes and w2vec for carts and orders models:
- wgt_buy2buy - co-visitation buy2order/buy2cart matrix feature;
- wgt_c2buy_short - co-visitation click2buy matrix feature (matrix counts only cases when there is 1 hour or less between click and buy event);
- wgt_c2buy_full - co-visitation click2buy matrix feature for 30 last AIDs (if they are within 3 hours from the last event);
- wgt_c2buy_6_from_full - sum of co-visitaion matrix weights for the last 5 AIDs, using "regular" co-visitation click2click matrix;
- w2v_20_mean - average w2vec similarity between candidate and last 20 AIDs (3 hours from last event);
- w2v_20_min - minimal w2vec similarity between candidate and last 20 AIDs (3 hours from last event);
- w2v_5_max - maximal w2vec similarity between candidate and last 5 AIDs;
- w2v_5_min - minimal w2vec similarity between candidate and last 5 AIDs (this feature also has low importance, but its removal decreased result a bit).
Average importance per 4 folds for all the features in LGBM models (importance_type='gain').
| Feature | Clicks | Carts | Orders |
|---|---|---|---|
| wgt_matrix | 2.6e+05 | X | X |
| wgt_exp | 2.4e+06 | X | X |
| n | 8.0e+06 | 5.2e+06 | 1.7e+06 |
| time_delta | 8.8e+04 | 1.8e+05 | 3.5e+06 |
| count_views | 5.6e+04 | 1.0e+04 | 1.3e+04 |
| ts_diff | 1.2e+05 | 3.3e+04 | 2.0e+04 |
| time_viewed | 1.3e+05 | 1.1e+05 | 2.7e+04 |
| daily_aid_count | 4.1e+04 | 1.5e+04 | 9.8e+03 |
| same_day_aid_count | 2.3e+05 | 6.5e+04 | 2.1e+04 |
| aid_count_weekly | 2.5e+04 | 2.0e+04 | 1.6e+04 |
| wgt_last | 2.3e+06 | X | X |
| wgt_before_last | 9.7e+04 | X | X |
| time_viewed_clipped | 2.9e+04 | 1.5e+04 | 1.2e+04 |
| aid_counts | 2.2e+05 | 3.3e+04 | 1.9e+04 |
| type_last | 4.7e+04 | 1.0e+04 | 5.4e+04 |
| similarity_first | 1.6e+05 | X | X |
| similarity_second | 7.3e+04 | X | X |
| wgt_buy2buy | X | 2.6e+04 | 2.7e+04 |
| wgt_c2buy_short | X | 1.2e+05 | 3.4e+04 |
| wgt_c2buy_full | X | 5.7e+05 | 1.7e+05 |
| wgt_c2buy_6_from_full | X | 5.2e+04 | 3.6e+04 |
| conv | X | 1.6e+04 | X |
| clicks_before_buy | X | 5.8e+04 | 2.6e+04 |
| session_time | X | 2.8e+04 | 2.2e+04 |
| events_last_3hours | X | 1.1e+05 | 6.1e+04 |
| history_mean | X | 3.9e+04 | 2.5e+04 |
| total_2cart/order_conv | X | 2.0e+04 | 2.4e+05 |
| buys_this_session | X | 1.6e+04 | 1.2e+05 |
| w2v_20_mean | X | 3.0e+04 | 6.9e+04 |
| w2v_20_min | X | 1.8e+04 | 2.7e+04 |
| w2v_5_min | X | 1.2e+04 | 8.6e+03 |
| w2v_5_max | X | 4.6e+05 | 1.8e+05 |
| aid_counts_buys | X | X | 1.8e+04 |
| buys_in_session | X | X | 6.6e+04 |
Notebooks training the GBDT models are the only ones that use GPU. I tried both catboost and LGBM models, and LGBM showed better results. To produce the final prediction for clicks and carts only LGBM predictions are used, while for orders I've built two cross validation datasets and used one of them to train LGBM model, and another one - to train catboost model. Then I combined predictions made by two models, and found out that it makes a slightly better prediction than a single prediction made by LGBM model. I kept that pipeline with two models and two cross-validation datasets for orders, but decided against implementing a similar pipeline for carts.
The same notebooks were used both for cross-validation and for training. I only ran Jupyter cells manually one-by-one for cross-validation, and to get the models trained on all the data I ran the entire notebook using "save and run" option. A boolean variable CROSS_VALIDATE was used to prevent notebook from running some cells, only needed for cross-validation.
I only used sessions with at least one positive candidate generated. As a result, the number of sessions used to train carts or orders models was relatively low, as for these models more than 80% of sessions do not have any positive candidates, and even fewer sessions have at least a single candidate guessed at candidate generation stage. So, for these two models, I didn't have significant memory problems. I did decrease the number of negative examples for those models, but that was done to increase their performance.
The situation with clicks model was different. Almost all the sessions have positive targets, and about 60% of them have correct candidates selected at candidate generation stage, so the clicks model has times more data compared to the carts and orders models. I kept removing more negative candidates even after this started decreasing the model's performance. I converted all the float variables to float16 after loading the parquet file. I wrote a custom function to split the cross-validation dataset into folds. But anyway, low memory available for kaggle notebooks with GPU was a limitation for the model.
Close to competition's final days, I have increased the number of candidates for carts and orders models from 50 to 75. This turned out to be a disappointment, more candidates didn't improve the cross-validation score, while it took more time for the notebooks to run. After increasing number of candidates, I had to move prediction for carts and orders models to a separate notebook, as 13 Gb available for a notebook with GPU support was not enough. But I didn't remove additional candidates from the pipeline, as I thought there was a chance some of those additional candidates could be selected successfully after adding more features to the model.
At the end of the competition, the best cross-validation recalls were 54.54% for clicks, 42.08% for carts and 65.80% for orders. You can see that even with the re-ranking GBDT models, the results were not that much better than results of rules-based candidate generation, adding just about 1-2%.
Little can be said about this notebook. I wrote the code in a way that it was possible to upload results for a single model or results for all the three models, to track improvements for each model on leaderboard. In case of uploading results for a single model, slots for other model's results are filled with data from sample submission file, provided by competition organizers.
I started working on the project about a month after the competition was launched and still managed to get into top 3% participants, in the middle of the silver zone. That should be considered to be a fairly good result. After the competition, I've read all the posts of top teams members and understood that all of them used servers with way more RAM and GPU available. I worked solo and lost the competition to people who mostly worked in teams and had way more computational resource. If all the time I spent trying to fit all the data into available memory could be spent on running additional experiments, I would have been able to produce a better result.
After the competition end with all the stories of top teams being published, it is easy to say what can be improved. Top teams used more features and more types of co-visitation matrixes, including really original ones, like a matrix that only counts the first few AIDs in a session, a matrix that counts only sessions of the last week, matrixes that separately count events before or after 2 PM. No doubt that even with the resource available, I could have done better. There was enough memory to double the number of features for carts and orders models. I could have run more notebooks in parallel to speed up the calculation and could have tried even more features, more types of co-visitation matrixes, more versions of w2vec models. Furthermore, I could have improved my carts and orders models by using some features I've only used for clicks model. For example, I haven't even tried features built for exact last AID in session for carts and orders models, and I haven't tried features built with any of click2click models for carts/orders. Then, there were several bugs in code that also a bit decreased the result. But while all these little improvements would bring me to a higher position, they wouldn't put me on the very top. To win this competition, one needed to have more computational resource available.
In March 2023, about a month after the competition, I decided to review the code, add some comments, delete commented unused code and upload the notebooks to github. At this point further score improvement was not my goal anymore. But while adding comments and reviewing the code I couldn't help making some changes. I fixed a few bugs, moved addidional fucntions to otto_common notebook, created a separate notebook with functions common to feature engineering, checked for ways to speed up the word2vec feature notebook, removed a few features that actually decreased model's performance, e.t.c. As a result not just the code became shorter and clearer, but also the result have improved. After implementing those changes, best cross-validation results improved to 54.71% for clicks, 42.21% for carts and 65.87% for orders, these simple improvements would be enough to move me from 59th to 53rd position.