Please see the project of HeatMap_Echart_for_TuShare, it is better solution.
Create a heatmap for Real time China stocks price by TuShare's data
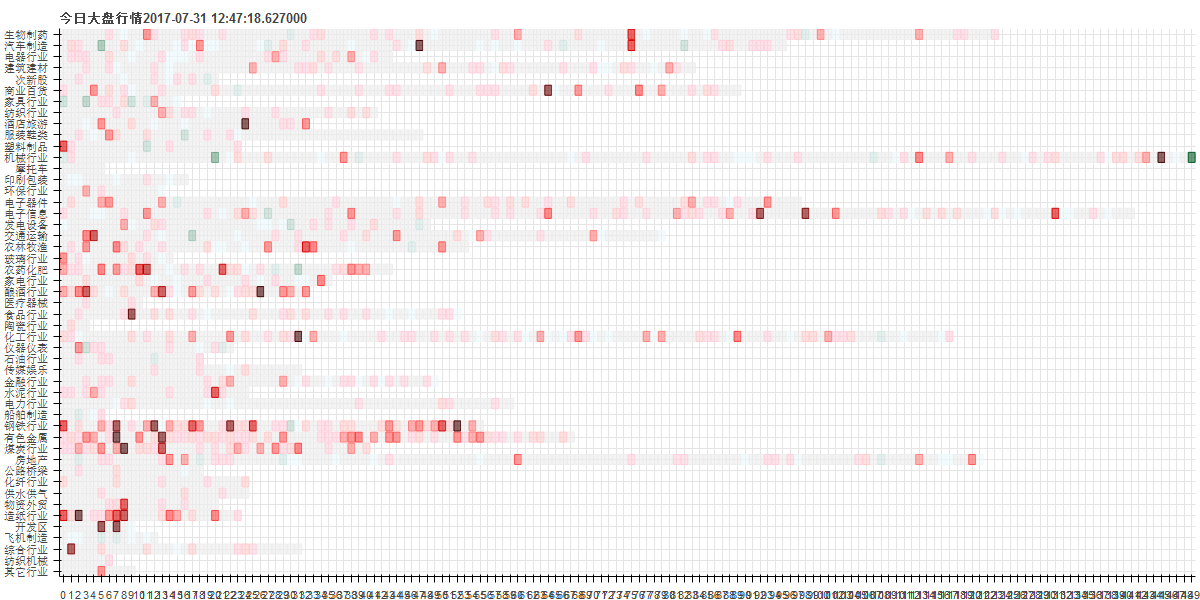
This project is aiming at visualizing data from tushare. At this point of time, we create a heatmap for real time China stock price. Wtihin this map, you could view all stock's day price movement in one glimpse. Meanwhile, the stocks in one horizontal line are in same industry, so you could easliy identify which industry is focused by market.
And this project is create by Flask for dealing requests, Bokeh for visualizing data and TuShare for getting data. Many thanks for those wonderful project.
Usage of this project is simple, you just download those files and run stock.py. Then, browsing the link http://localhost:5000, waiting a bit of time for tushare downloading data, and you will see the pic.
请参阅HeatMap_Echart_for_TuShare的项目,更好的解决方案。 使用TuShare作为数据源,制作了中国股市的股价的实时热力图。
TuShare具有很多很丰富的股市数据,这个工作致力于将这些数据可视化,进而挖掘数据价值。目前我们基于TuShare的实时股价接口,制作了股价热力图,直观表现股价的每日变化。同时,将同一行业板块的股票放置在同一行,可以很直观的发现市场热点板块,追踪热点。
这个项目是主要由Flask、Bokeh、TuShare搭建而成。Flask作为框架驱动程序、完成访问,Bokeh完成可视化、绘制热力图,TuShare作为数据源下载数据。十分感谢这些很牛逼的开源项目,没有他们将我将无法完成本项目。
使用本项目很简单,只要下载代码,然后运行stock.py。你也可以使用各种其他Flask的wsgi部署方式。然后,访问http://localhost:5000, 等TuShare下载数据后,你将看到下图。