On the morning of 21st of November, you are still $12,000 away from the monthly sales target. You know that the average (mean) of the daily sales is $1000 and that the standard deviation of them is 400.
What's the probability to meet the sales target?
Python to the rescue! With some basic Python, you can easily calculate the answer and you will learn to do it in this tutorial!

Well, it doesn't look promising, only ~5% :( better increase that mean!
This is a tutorial intended for people who are not familiar with statistics, Monte Carlo simulations and similar methods. I want to introduce them to Monte Carlo simulations, which can often significantly simplify statistical problems.
We are using a very simple Monte Carlo simulation where we calculate the dollar amount of sales made for every simulated day and we run this simulation a thousand times.
This way, we can avoid any tricky maths and get a reasonably accurate answer!
In order to calculate the daily sales in each simulated day, we can draw randomly from the normal distribution with the mean of 1000 and the standard deviation of 400. We know the numbers from our sales historical data (let's say).
This is a very simple model here's nothing wrong with simple models but we need to be aware of the assumptions that we are making as a trade off.
For example, it assumes that daily sales are independent. So if the sales are poor today, we assume that it has no effect on the sales tomorrow.
We assume that the sales history from the year ago is still relevant today. Let's say that our company has been growing rapidly and the sales data from the last year is not very useful. We could adjust for this by calculating the weighted average and assigning more weight to recent data.
Or maybe there's some seasonality in trends and e.g. sales are usually bigger during the weekends? Ok, let's take this one into account!
Enough talking, let's dive into the code!
def simulate_monthly_sales(sales_mean, sales_stddev, starting_date, iterations=2000, weekend_effect=1):
    """
    Return list of simulated daily sales
    :param sales_mean: Mean of daily sales
    :param sales_stddev: Standard deviation of daily sales
    :param starting_date: Simulation starting date
    :param iterations: Number of iterations to perform
    :return: List of lists of daily simulated sales (dollar amount).
    """

    simulated_sales = list()

    for run_id in range(iterations):
        current_date = arrow.get(starting_date)
        starting_month = current_date.format("M")
        sales_cumulative = [0] # starting with $0 on day 1

        while current_date.format("M") == starting_month:
            if int(current_date.format("d")) in [6,7]:
                daily_sales = numpy.random.normal(sales_mean * weekend_effect, sales_stddev)
            else:
                daily_sales = numpy.random.normal(sales_mean, sales_stddev)
            sales_cumulative.append(sales_cumulative[-1] + daily_sales)

            current_date = current_date.replace(days=1) # advance one day

        simulated_sales.append(sales_cumulative)

    return simulated_sales
This short piece of code is the very core of our solution.
We repeat the simulation iterations number of times, and we start
each simulation with new list of data points sales_cumulative.
We continue running the simulation until we reach the end of the month,
and during each simulated day we calculate the sales made by drawing
from the normal distribution.
If the simulated day is weekend, we can increase or decrease the mean of sales to partially adjust for the increased or decreased volume of sales on the weekends.
We keep the sum of daily sales in sales_cumulative (different element for each day),
and at the end of the simulation, we return the results of all simulations performed.
It's worth noting that I am using an amazing Python library called Arrow to deal with the date operations, it makes them really simple.
So now that we have the results of the simulations, it's very easy to calculate the approximate probability of meeting the target. We know the number of simulations performed, and we can easily find out the number of simulations where we met or exceeded the sales target.
The ratio of them is the approximate probability of meeting the target! Obviously, the more simulations we perform, the more accurate the probability is.
We can do this in only two lines of code:
def target_met_frequency(simulated_daily_sales, target):
    """
    Percentage of simulations where the sales target has been met.
    :param simulated_daily_sales: Results of simulations.
    :param target: The sales target.
    :return: Percentage (e.g. 0.95).
    """
    days_when_target_met = [sales[-1] for sales in simulated_daily_sales if sales[-1] >= target]

    return float(len(days_when_target_met)) / len(simulated_daily_sales)
In the first line, we use lists comprehension to filter out the simulations where the target has not been met and then we calculate the ratio. That's it!
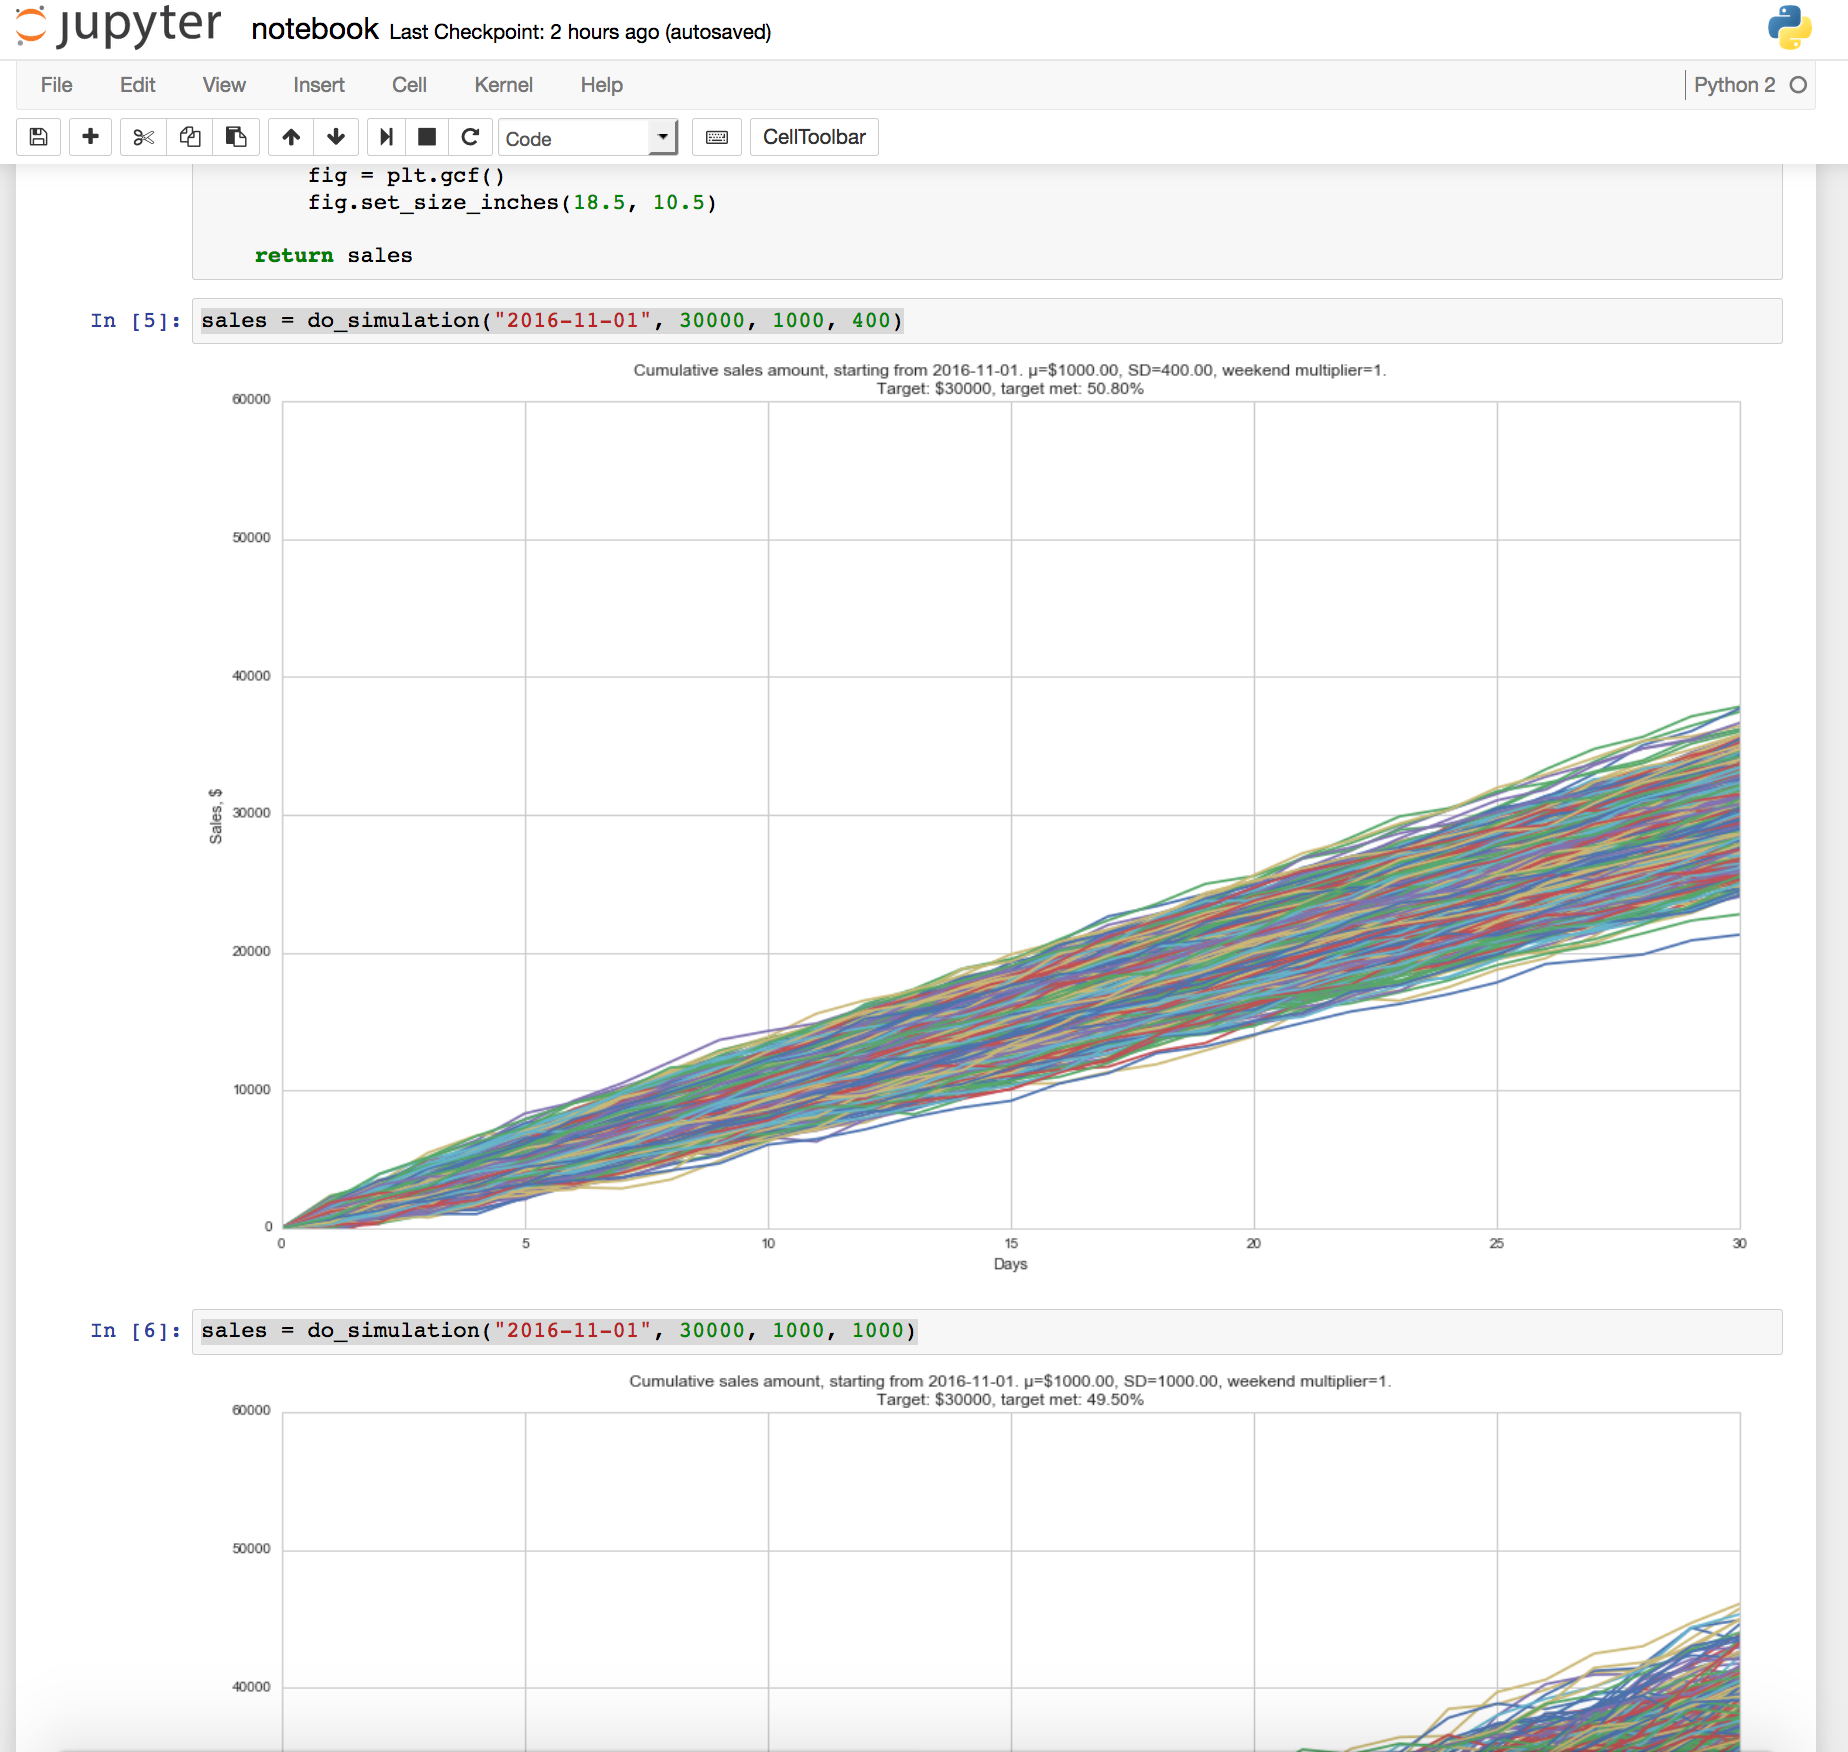
We can put both methods in the same file and do some basic arguments parsing to connect it all. If we return to the original example:
$ python evaluate_monthly_sales_target.py "2016-11-21" 12000 1000 400
Starting date: 2016-11-21
μ=$1000.00, SD=400.00
Target: $12000.00
Target met: 5.6%
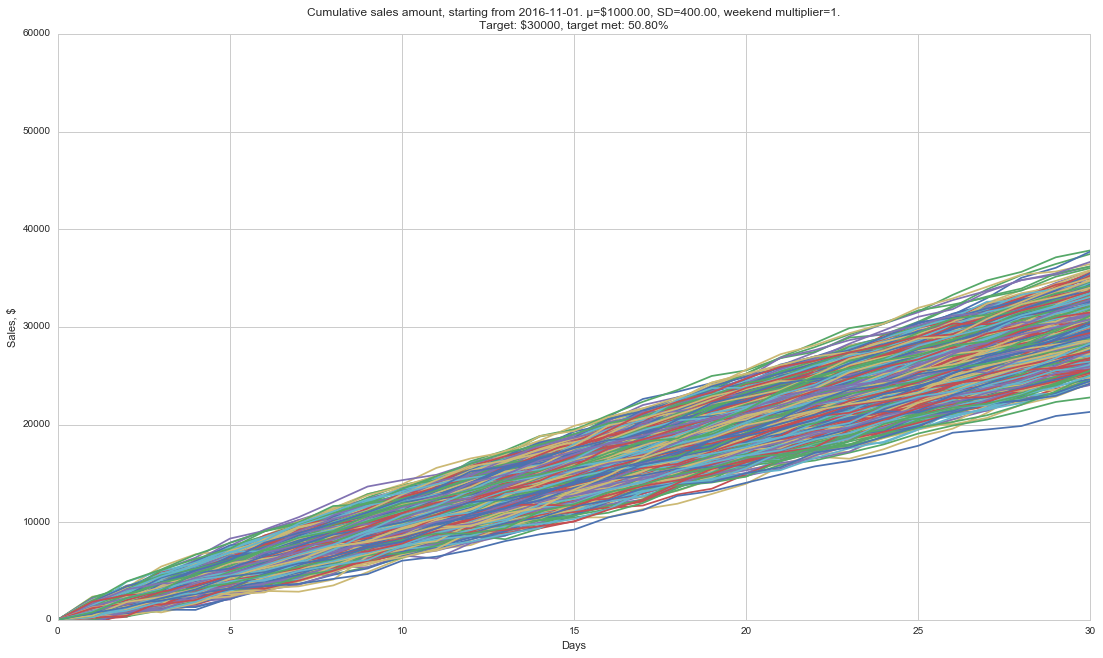
Visualization is a very powerful tool and helps to put the results in some perspective. For example, we can plot every simulation as a different line and visually assess them, come up with further questions. Also, they look cool :)
For example, does the standard deviation affect our chances of meeting the target?
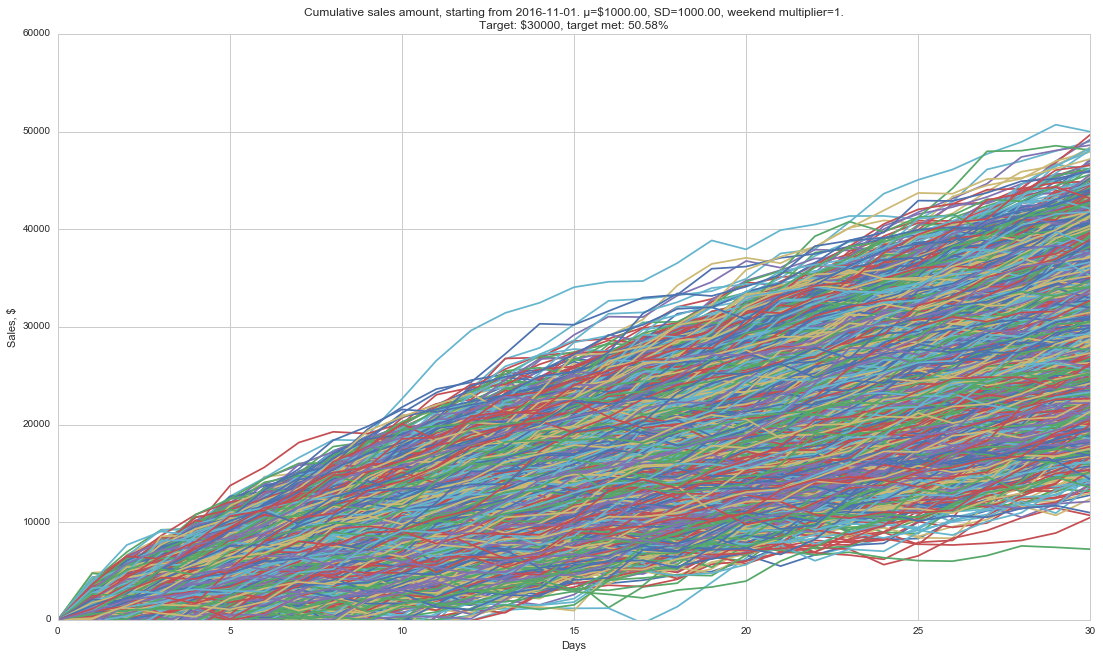
Well, it does not affect out chances, but if we miss the target, the chances are that we miss it by much more!
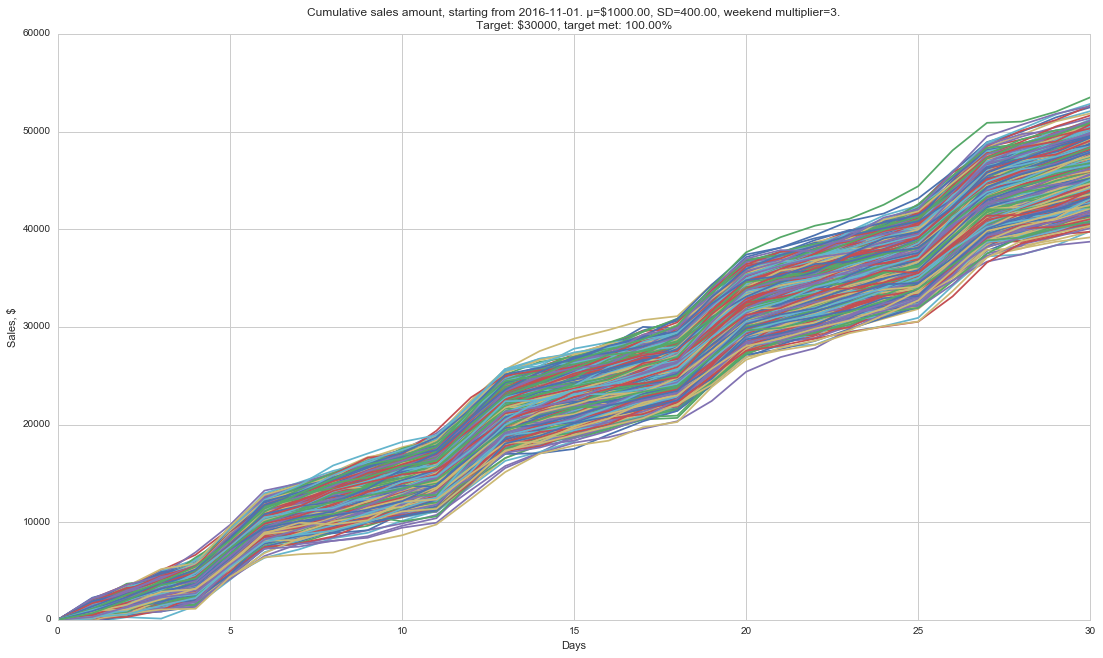
And how do the extremely profitable weekends look like?
I added a jupyter notebook (notebook.ipynb) with examples of some visualizations as a starting point.
Monte Carlo simulations is a very powerful method and there are plenty of applications of it. For example, we can use the method to calculate how many blind boxes we need to buy to collect all the figurines.
We can also calculate the probability of winning a poker hand by simulating what cards opponents might be holding.
Thanks for checking out my project! It's been a fun evening implementing and writing this, hope you found this useful.
Feel free to email me at gediminas dot rap at google mail service because I'd love hear what you think, or open an issue if you have any suggestions.
Thanks!