Home
Analyze bank marketing data using XGBoost to gain insights into client purchases
Use Machine Learning to Predict Bank Client's CD Purchase with XGBoost and Scikit Learn
Cognitive & Data Analytics
This Code Pattern will guide you through how to use XGBoost, Scikit Learn and Python in IBM Watson Studio. The goal is to use a Jupyter notebook and data from the UCI repository for Bank Marketing Data to predict if a client will purchase a Certificate of Deposit (CD) from a banking institution.
Class imbalance is a common problem in data science, where the number of positive samples are significantly less than the number of negative samples. As data scientists, one would like to solve this problem and create a classifier with good performance. XGBoost (Extreme Gradient Boosting Decision Tree) is very common tool for creating the Machine Learning Models for classification and regression. However, there are various tricks and techniques for creating good classification models using XGBoost for imbalanced data-sets that is non-trivial and the reason for developing this Code Pattern.
In this Code Pattern, we will illustrate how the Machine Learning classification is performed using XGBoost, which is usually a better choice compared to logistic regression and other techniques. We will use a real life data set which is highly imbalanced (i.e the number of positive sample is much less than the number of negative samples).
This Code Pattern will walk the user through the following conceptual steps:
- Data Set Description.
- Exploratory Analysis to understand the data.
- Use various preprocessing to clean and prepare the data.
- Use naive XGBoost to run the classification.
- Use cross validation to get the model.
- Plot, precision recall curve and ROC curve.
- We will then tune it and use weighted positive samples to improve classification performance.
- We will also talk about the following advanced techniques:
- Oversampling of majority class and Undersampling of minority class.
- SMOTE algorithms
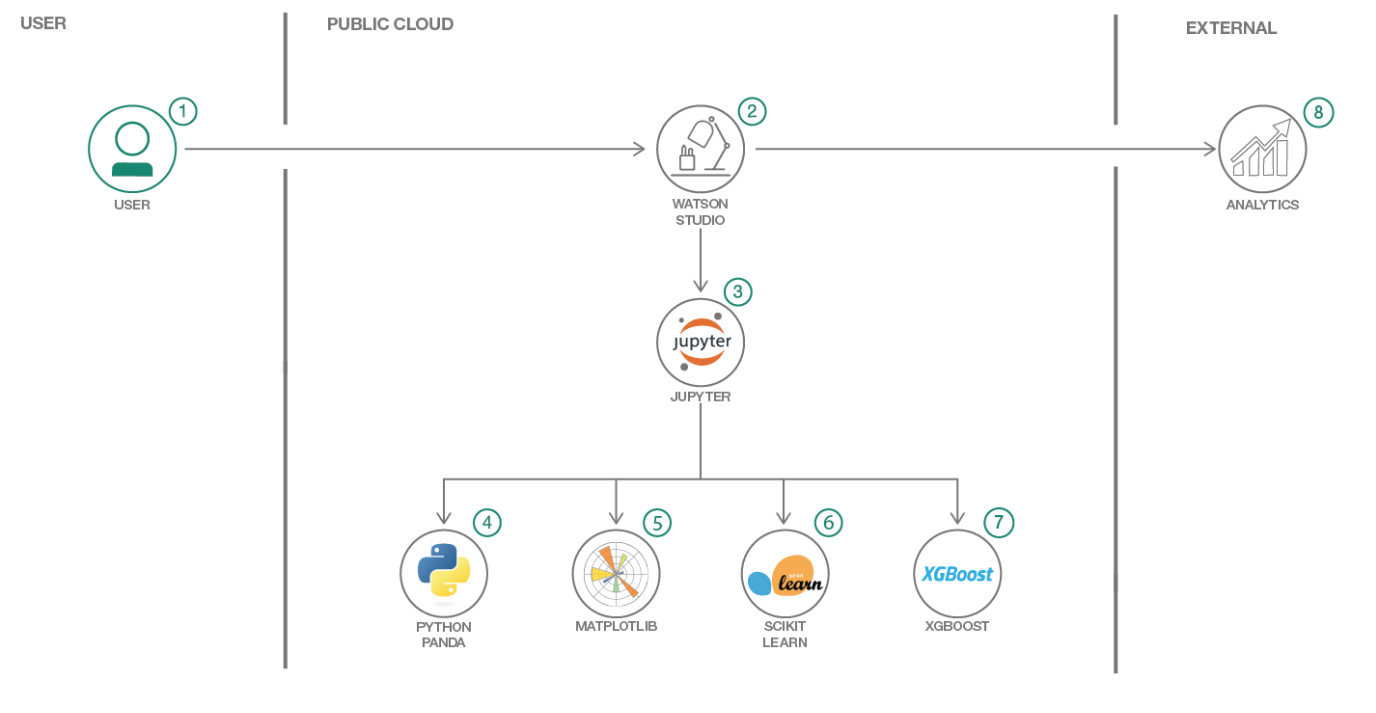
- Log into IBM Watson Studio service.
- Upload the data as a data asset into Watson Studio.
- Start a notebook in Watson Studio and input the data asset previously created.
- Pandas are used to read the data file into a dataframe for initial data exploration.
- Use Matplotlib and it's higher level package seaborn for creating various visualizations. 6, Use Scikit Learn to create our ML pipeline to prep our data to be fed into XGBoost.
- Use XGBoost to create and train our ML model.
- Evaulate their predictive performance.
- IBM Watson Studio: Analyze data using RStudio, Jupyter, and Python in a configured, collaborative environment that includes IBM value-adds, such as managed Spark.
- Jupyter Notebook: An open source web application that allows you to create and share documents that contain live code, equations, visualizations, and explanatory text.
- Data Science: Systems and scientific methods to analyze structured and unstructured data in order to extract knowledge and insights.
- Python: Python is a programming language that lets you work more quickly and integrate your systems more effectively.
- XGBoost: Extreme Gradient Boosting is decision tree based tools for creating ML model.
- Scikit Learn: A Python library for providing efficient tools for data mining and machine learning.
- Pandas: A Python library providing high-performance, easy-to-use data structures.
- Matplotlib: A Python library integrating matplot for visualization.
- SeaBorn: Another higher level Python library for visualization.
https://github.ibm.com/IBMCode/IBMCodeContent/issues/998
- Watson Studio: https://datascience.ibm.com/docs/content/analyze-data/creating-notebooks.html.
- Pandas: http://pandas.pydata.org/
- Data: http://archive.ics.uci.edu/ml/datasets/Bank+Marketing
- Scikit Learn: http://scikit-learn.org/stable/
- XGBoost: https://github.com/dmlc/xgboost
- Matplotlib: https://matplotlib.org/
- SeaBorn: https://seaborn.pydata.org