Home
RD Plot is a plotting tool for visualizing rate-distortion data parsed from the output of encoders belonging to common video coding reference software packages. These outputs can be written to files referred to as EncoderLogs in the following. Currently, data from the following video coding reference software packages is supported:
- H.265 reference software HM for EncoderLogs and DecoderAnalyzerLogs
- H.265 reference software extension HM360 for EncoderLogs
- H.265 reference software extension SHM for EncoderLogs
- H.266 reference software VTM EncoderLogs
Moreover, you can parse simulation data items from xml-formatted files. If you happen to have, a csv-formatted file, which contains your data, RDPlot can parse it for you, as well. If you require data from a different source you can extend the parsing capabilities of RD Plot by writing your own parser. For more information take a look at the wiki page How to implement a new parser .
RD Plot includes the following functionalities:
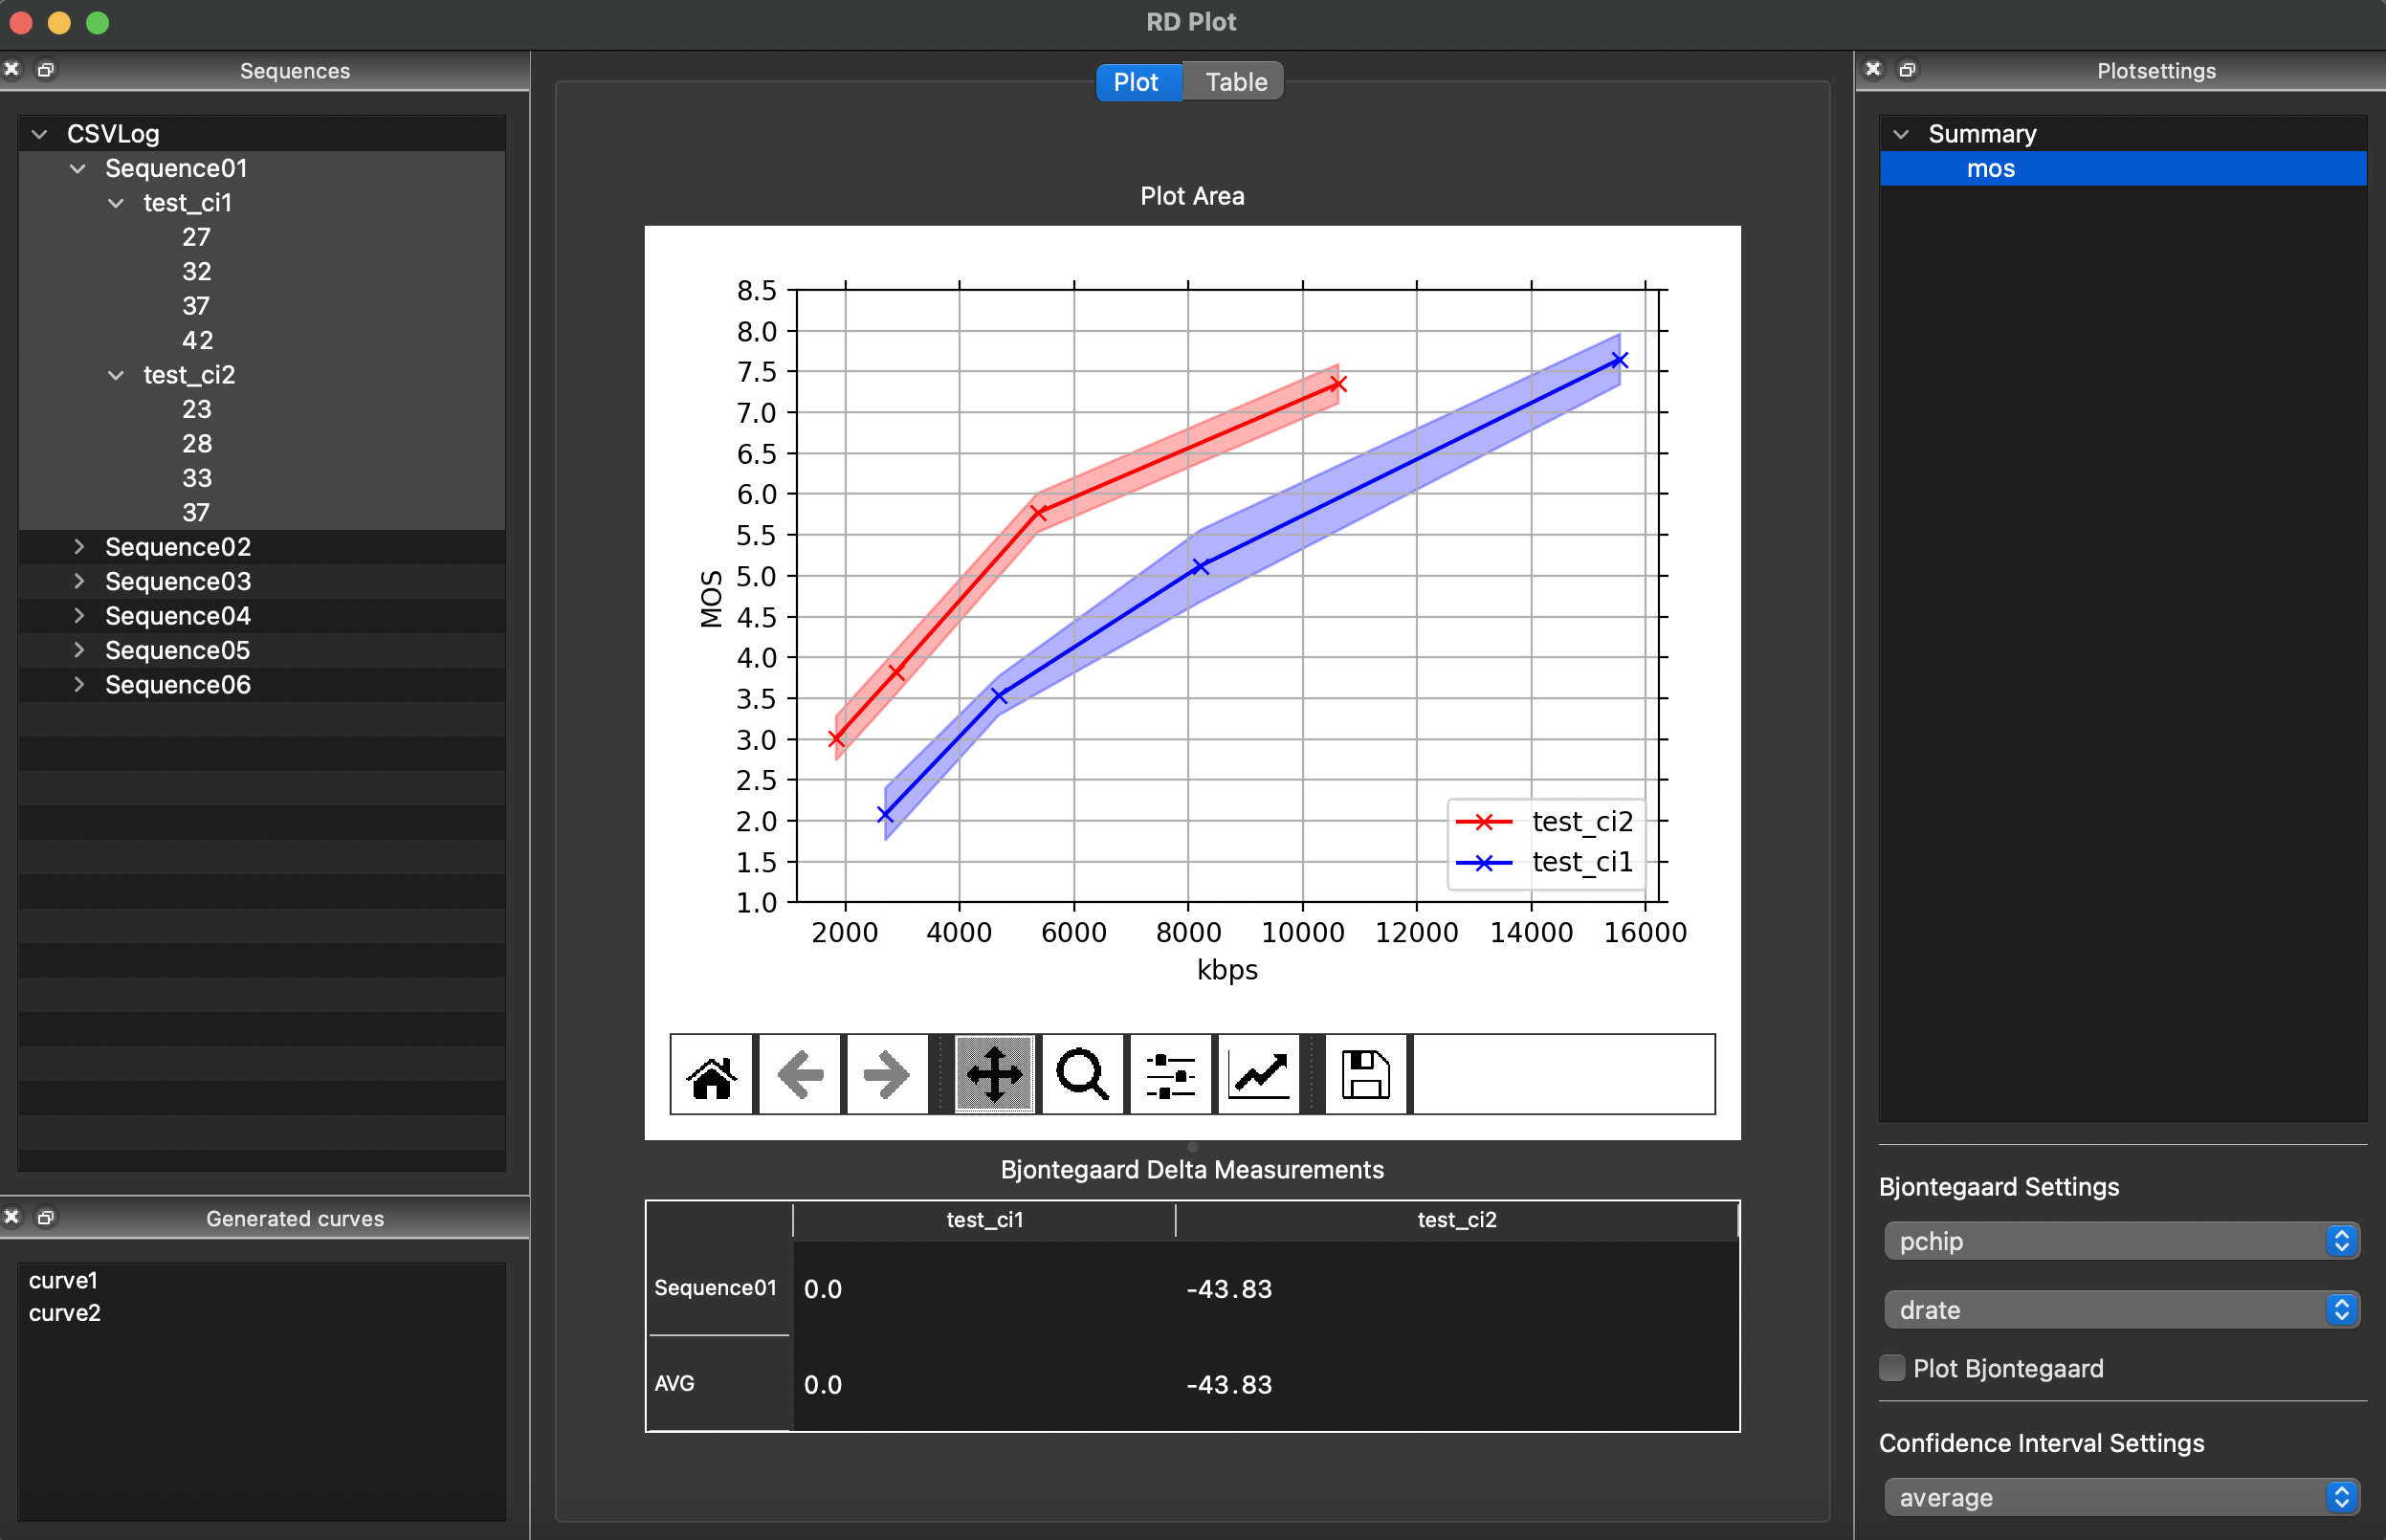
- Display rate-distortion plots
- Select component to be plotted (YUV, Y, U, V and even more)
- Plot rd plot over time (rate over time, psnr over time)
- Exporting plots (through matplotlib interface)
- Calculate and display table of bjontegaard delta measurement
- Export tables as latex style table code
You can find an instruction of the user interface and its functionalities at the wiki page Functionalities.