How to parse csv ci files
RDPlot is capable of plotting data points containing a confidence interval (CI). These confidence intervals have to be specified in the csv-file format by adding an additional column containing the CI-values with the column name <VALUE_NAME>-CI. These CI-values belong accordingly to the column with the name <VALUE_NAME>. An example is given below:
Sequence;QP;Bitrate;MOS;MOS-CI
Sequence01;27;15544.26;7.65;0.31
Sequence01;32;8207.94;5.12;0.44
Sequence01;37;4677.54;3.53;0.24
Sequence01;42;2696.16;2.08;0.32
Sequence02;30;11802.85;6.92;0.27
Sequence02;34;7243.2;5.03;0.37
Sequence02;38;4695.95;3.12;0.43
Sequence02;42;3090.75;2.02;0.33
...
RDPlot will display the confidence intervals as polygons of the lower and upper boundaries of the confidence interval around the actual data points/ curve.
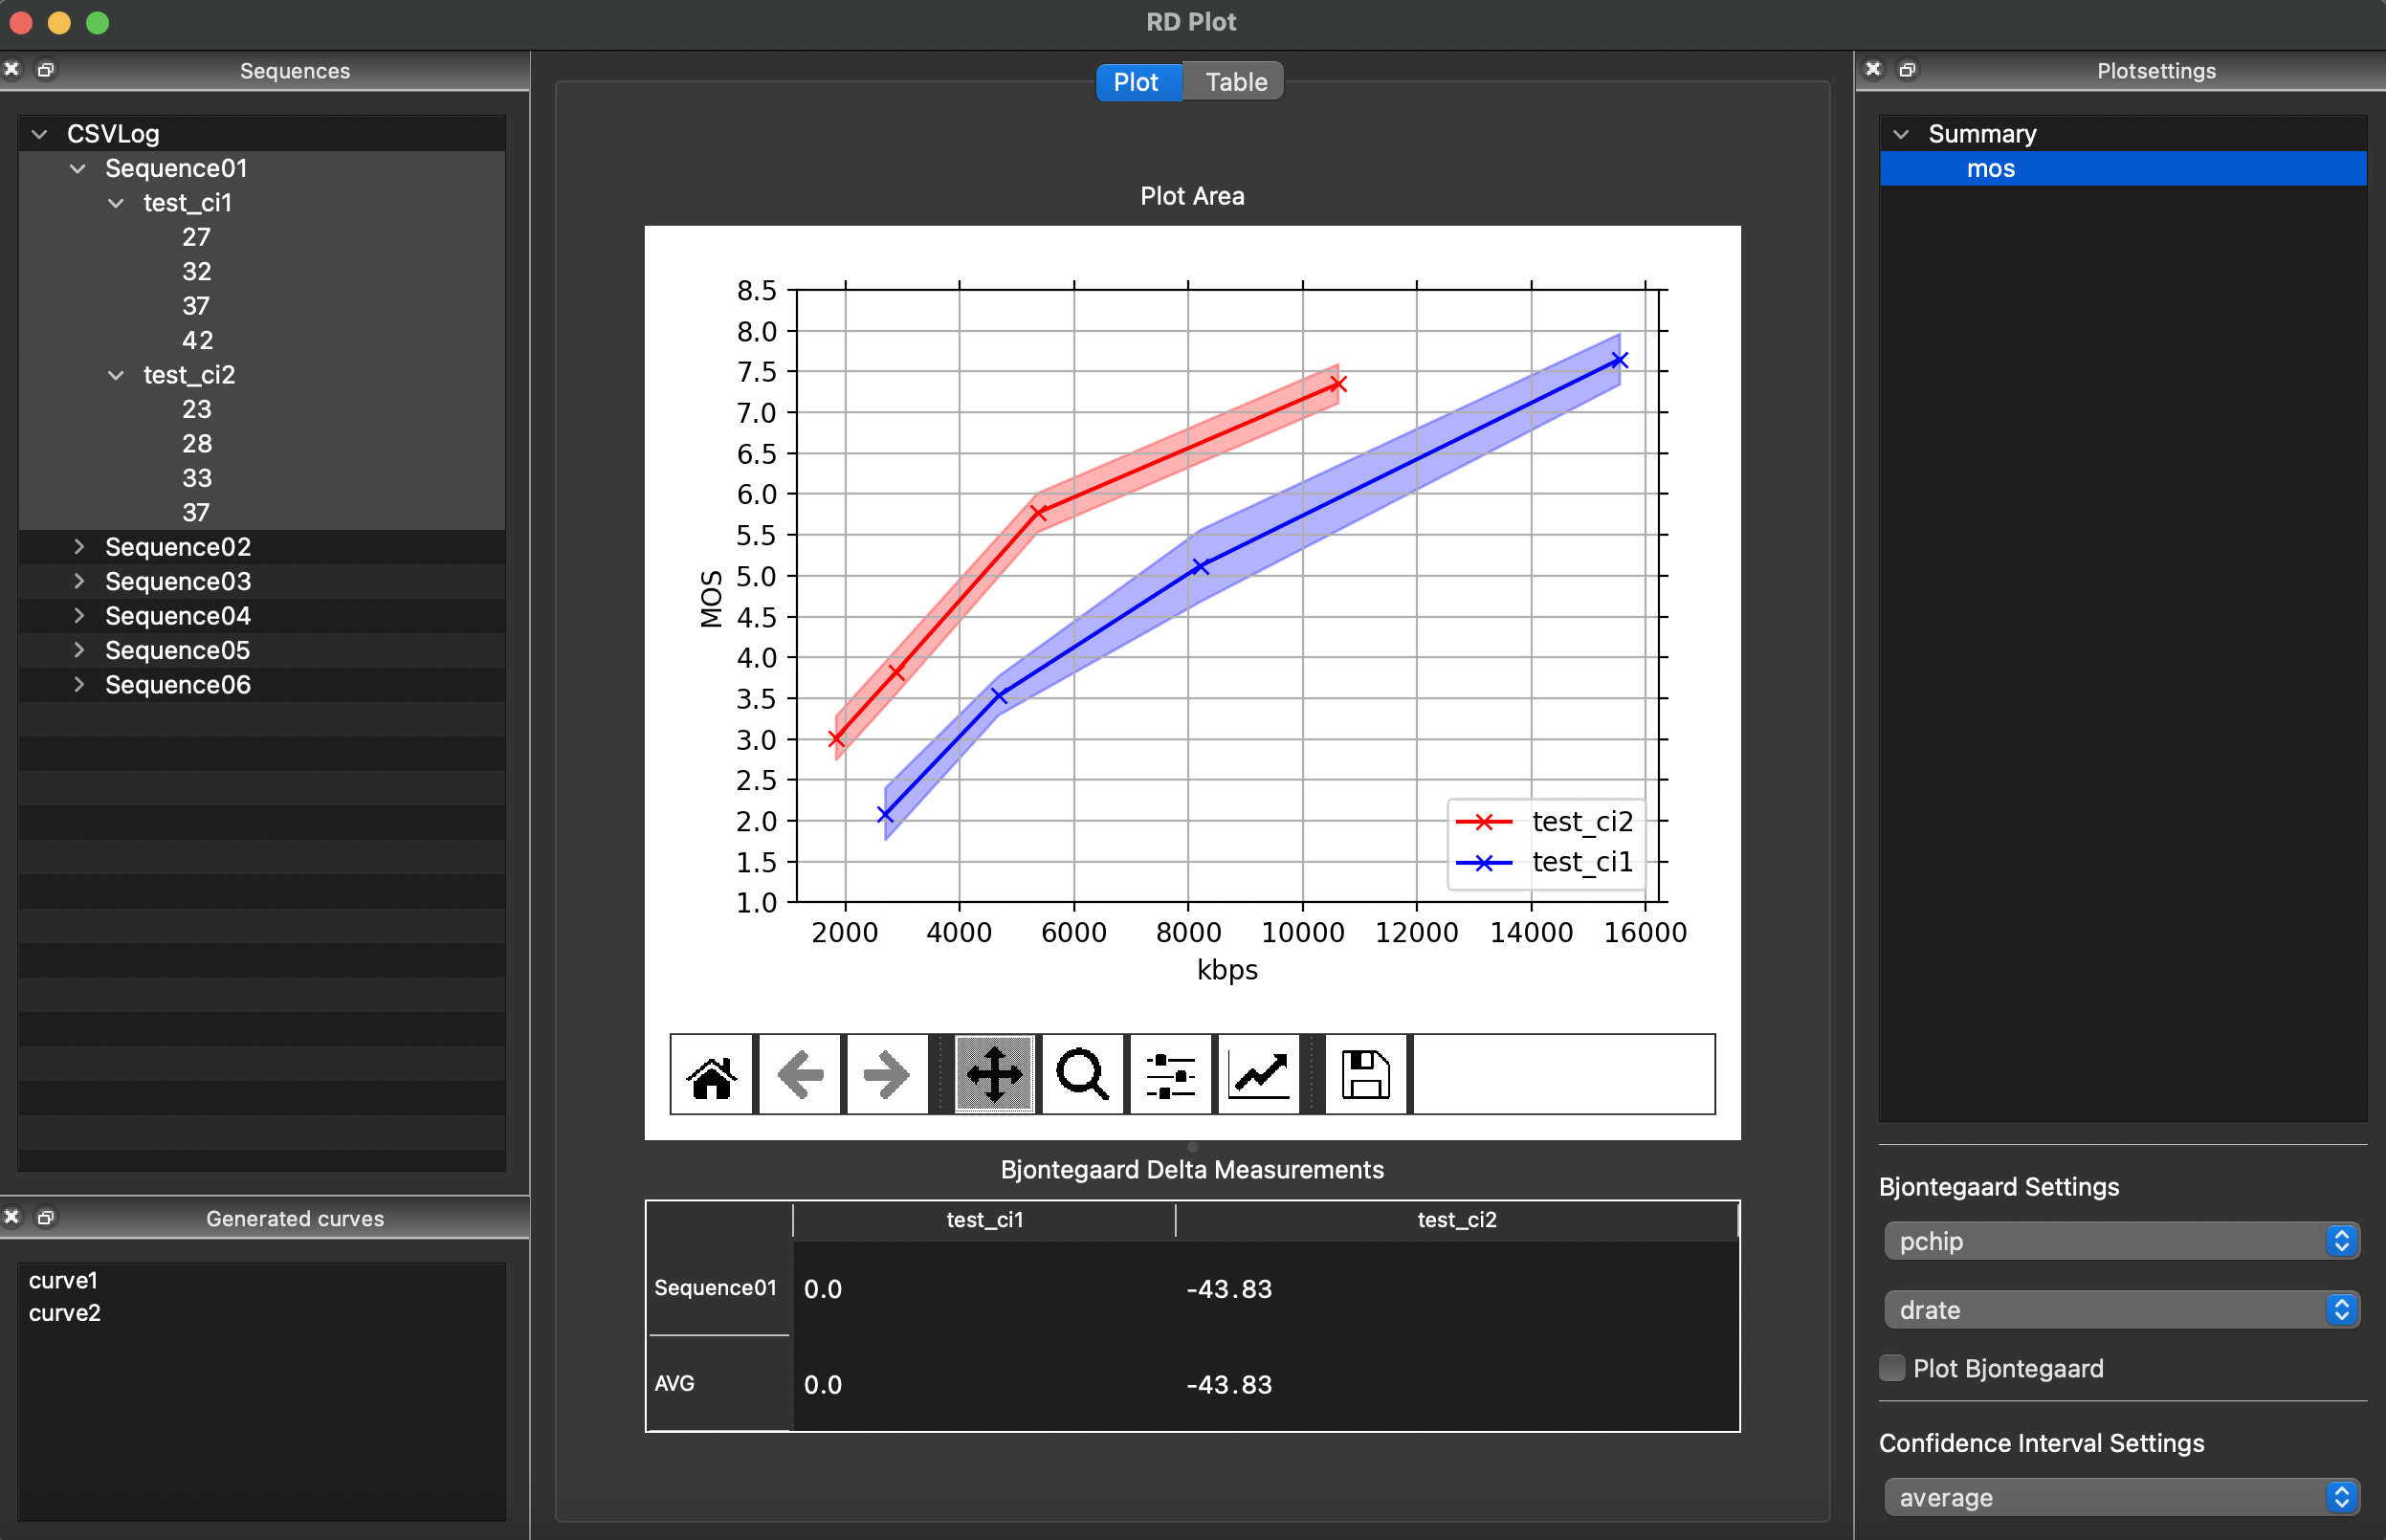
By using the combo box for the confidence interval settings (in the lower-left corner of the GUI), you can choose the CI mode (average, worst or best). RDPlot selects the corresponding upper and lower CI boundaries for the anchor and associated curves. The bjontegaard delta table will be update according to the selection.