Air Quality Dashboard
Now for the fun part. We are ready to start using the AirVisual API to create an air quality dashboard and capture the air pollution data for wherever we choose. This airquality.py script simply calls the AirVisual API using your API key and retrieves the current air pollution information. It also streams that data to your Initial State account, which will allow you to create an air quality dashboard.
You can the access the script through the Github repository that we cloned earlier. First thing we need to do is make sure we are in the AirVisual directory:
$ cd airvisual
From here, you'll be able to access the python file that we'll run to create our air quality dashboard.
We need to make some changes to the file before we run it. To open the python file, use the nano command to open the text editor:
$ nano airquality.py
Once the text editor is open, you will see the following near the top of your script:
# --------- User Settings ---------
LATITUDE = "LAT"
LONGITUDE = "LONG"
AIRVISUAL_API_KEY = "AIR VISUAL API KEY"
BUCKET_NAME = "Local Air Quality"
BUCKET_KEY = "aq1"
ACCESS_KEY = "INITIAL STATE ACCES KEY"
MINUTES_BETWEEN_READS = 5
# ---------------------------------
You need to enter your latitude, longitude, AirVisual API key, and Initial State access key. The MINUTES_BETWEEN_READS parameter will set how often your script will poll the AirVisual API for air quality information. 5 minutes enough time so that you won't go over your 10,000 API call per month limit. For the sake of short-term testing, you can set this to 0.5 minutes.
Once you have your parameters entered, save and exit the text enter by typing Control+X. Now you are ready to run your script:
$ python airquality.py
If want to leave this script running uninterrupted for a long time, you can use the nohup command (no hang-up) as follows:
$ nohup python airquality.py &
Once this is running go to Initial State to view your data. Your dashboard should look something like the picture below. You have your GPS location, your air quality index value, and your main pollutant.
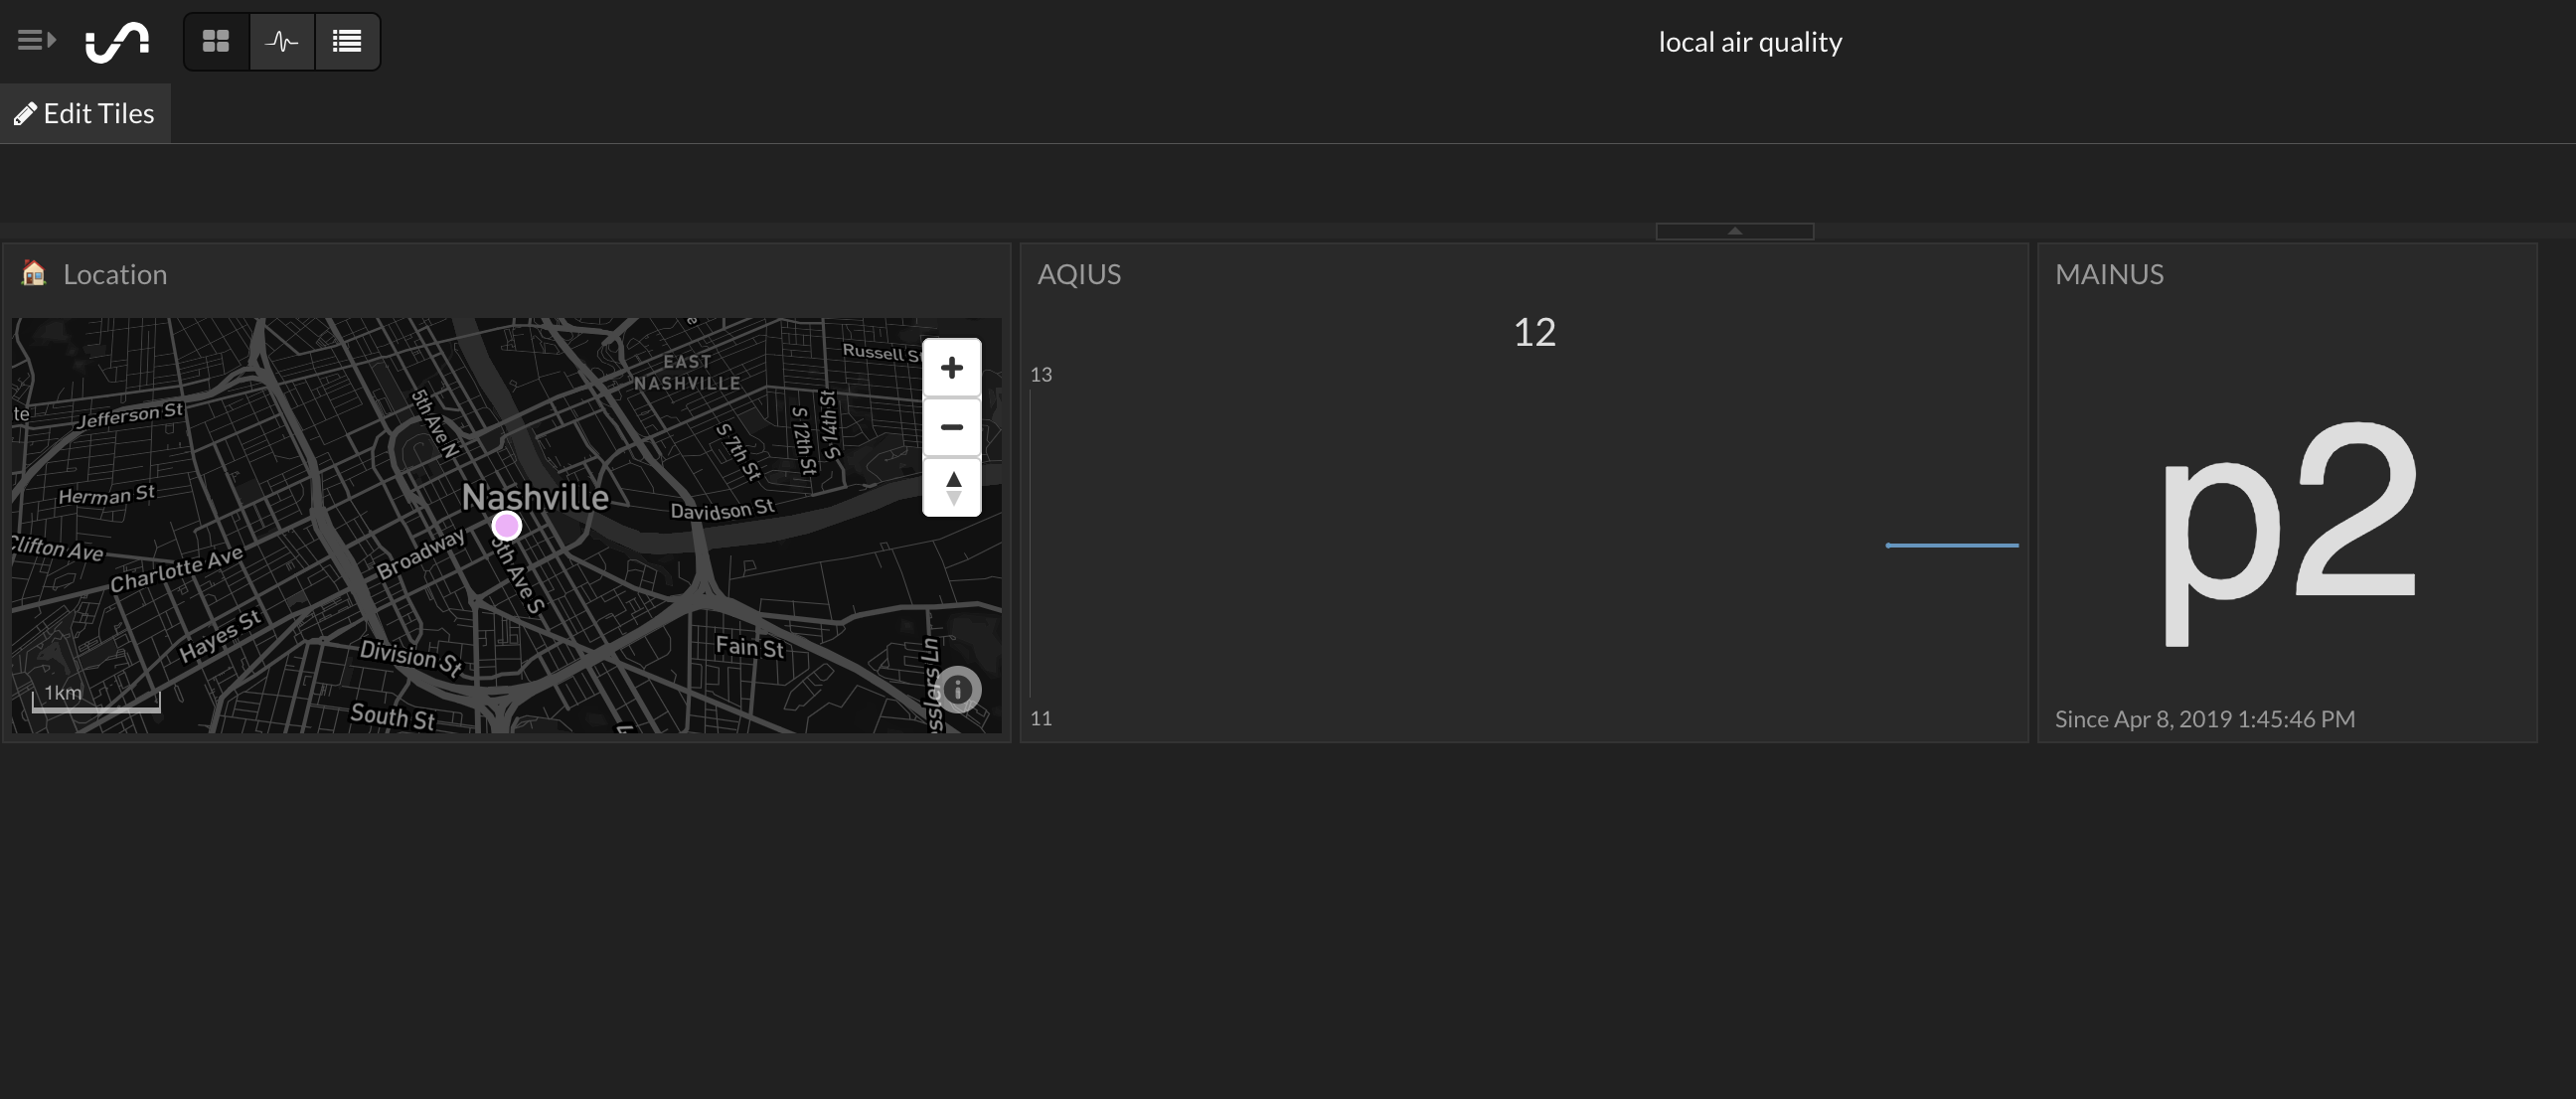
My recommendation would to change your AQI value to a gauge tile. Also, move the tiles around and resize as needed. If you are using this for an embedded dashboard, you can move these around to fit as needed.
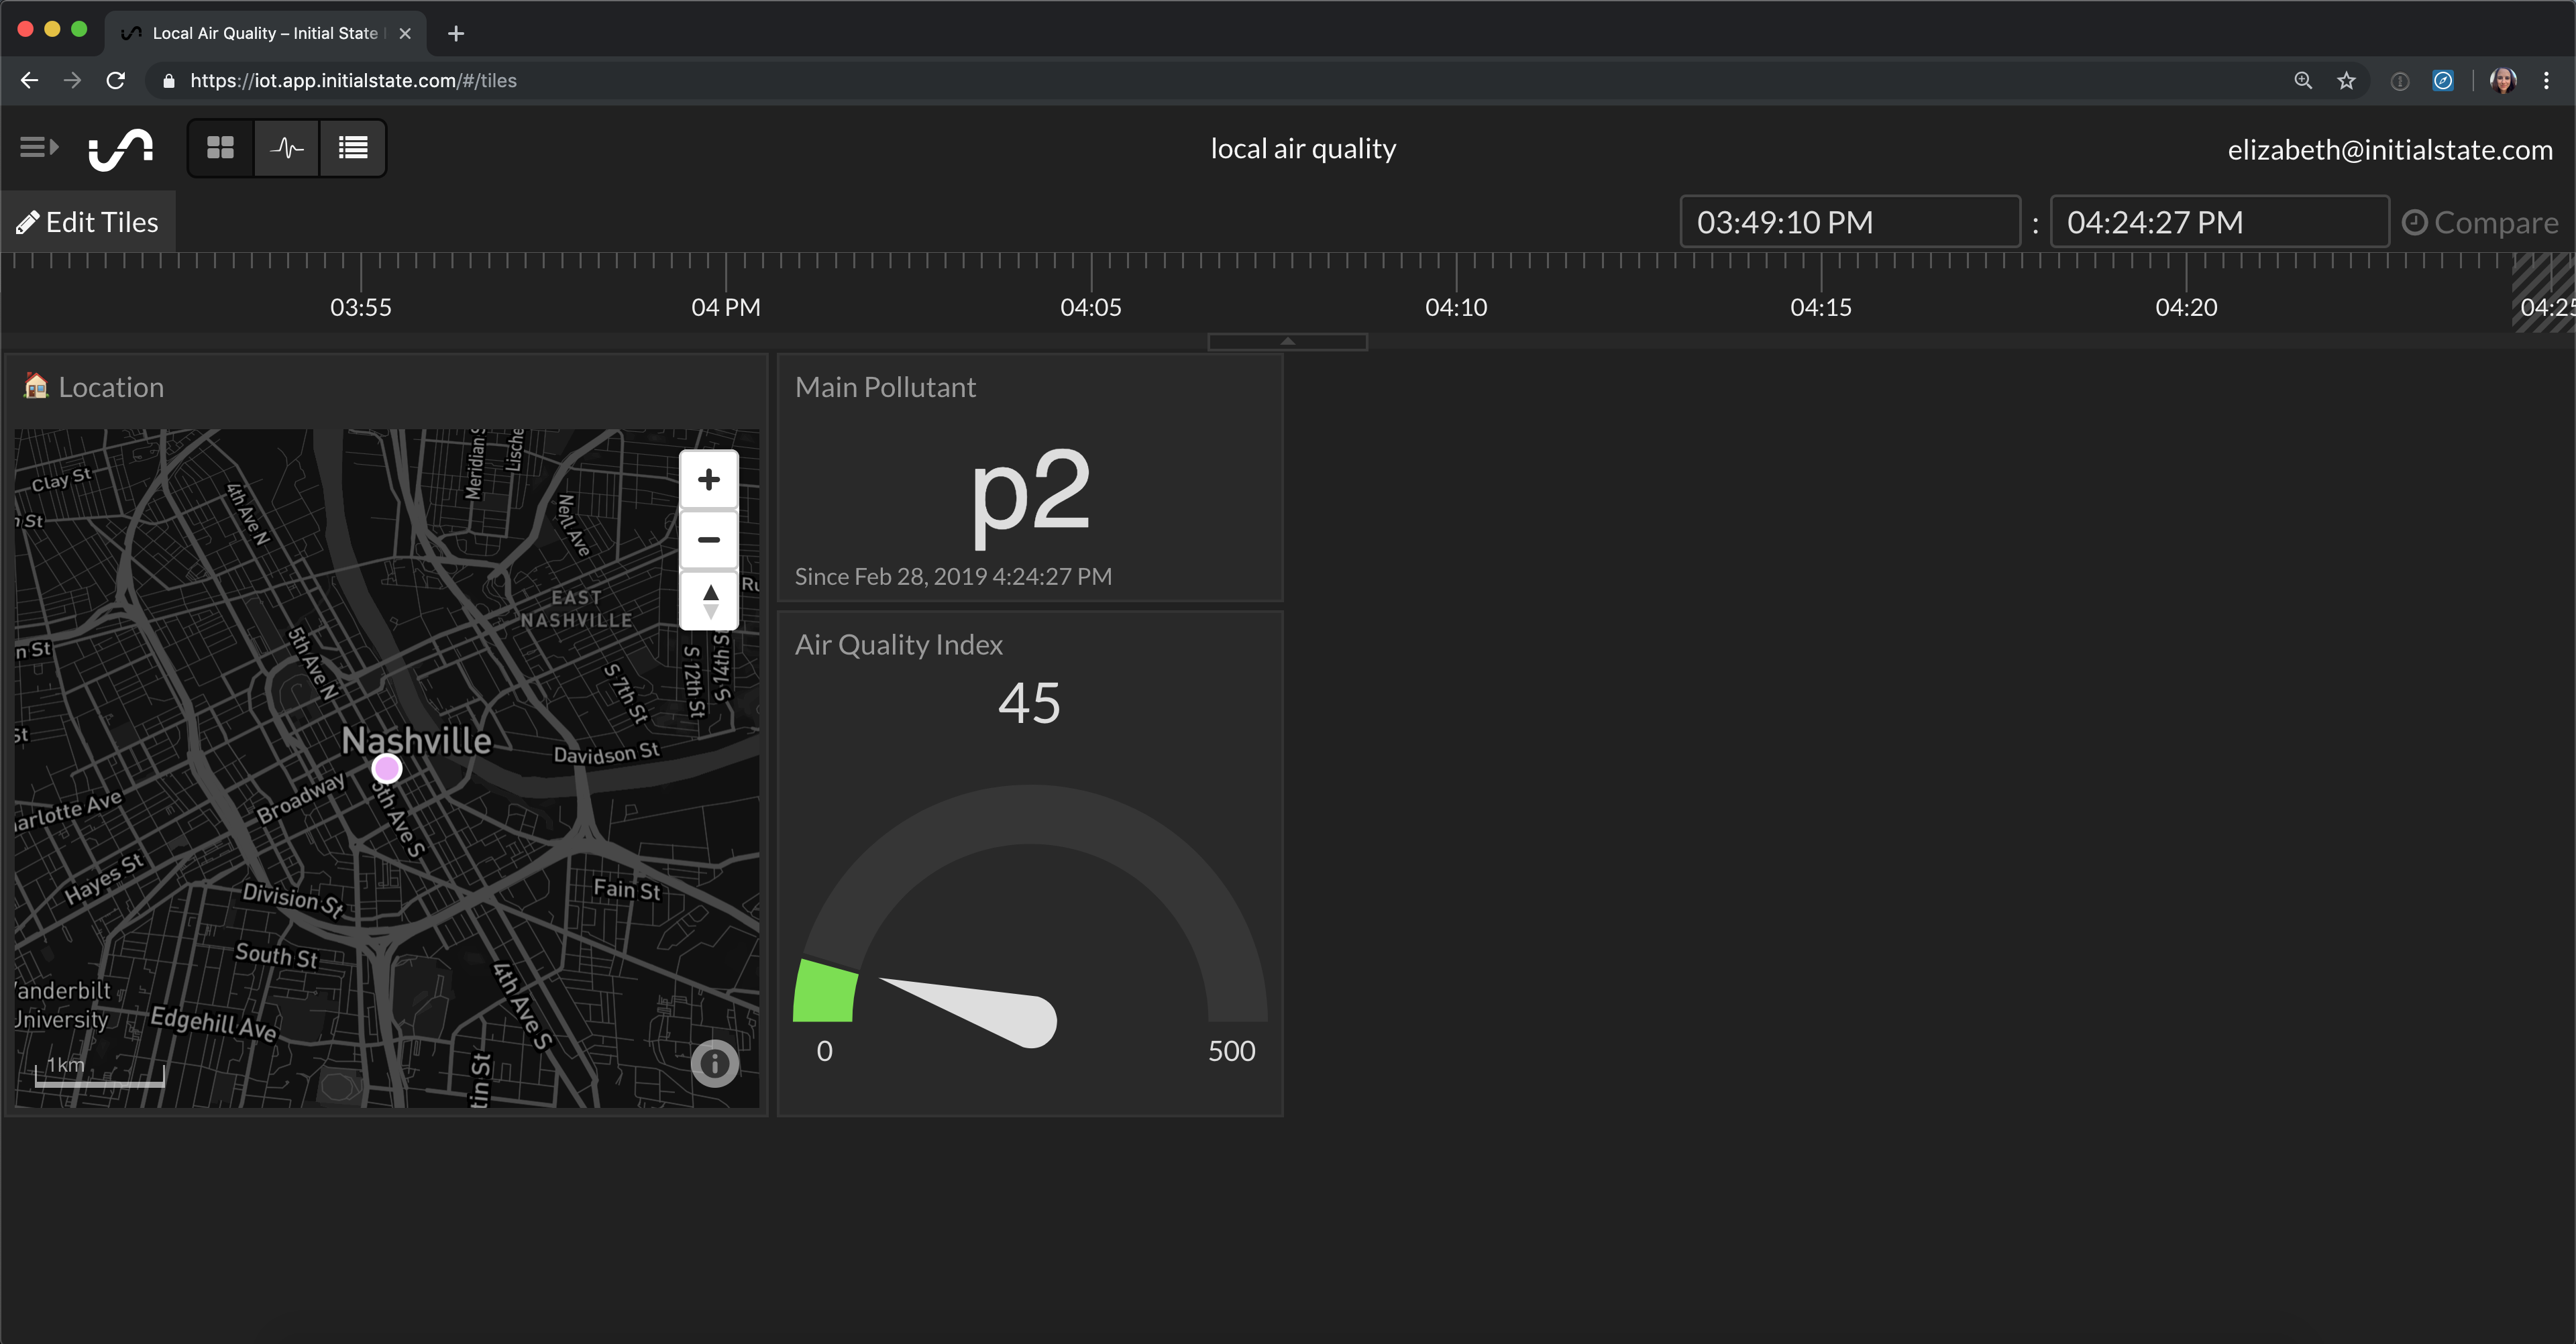
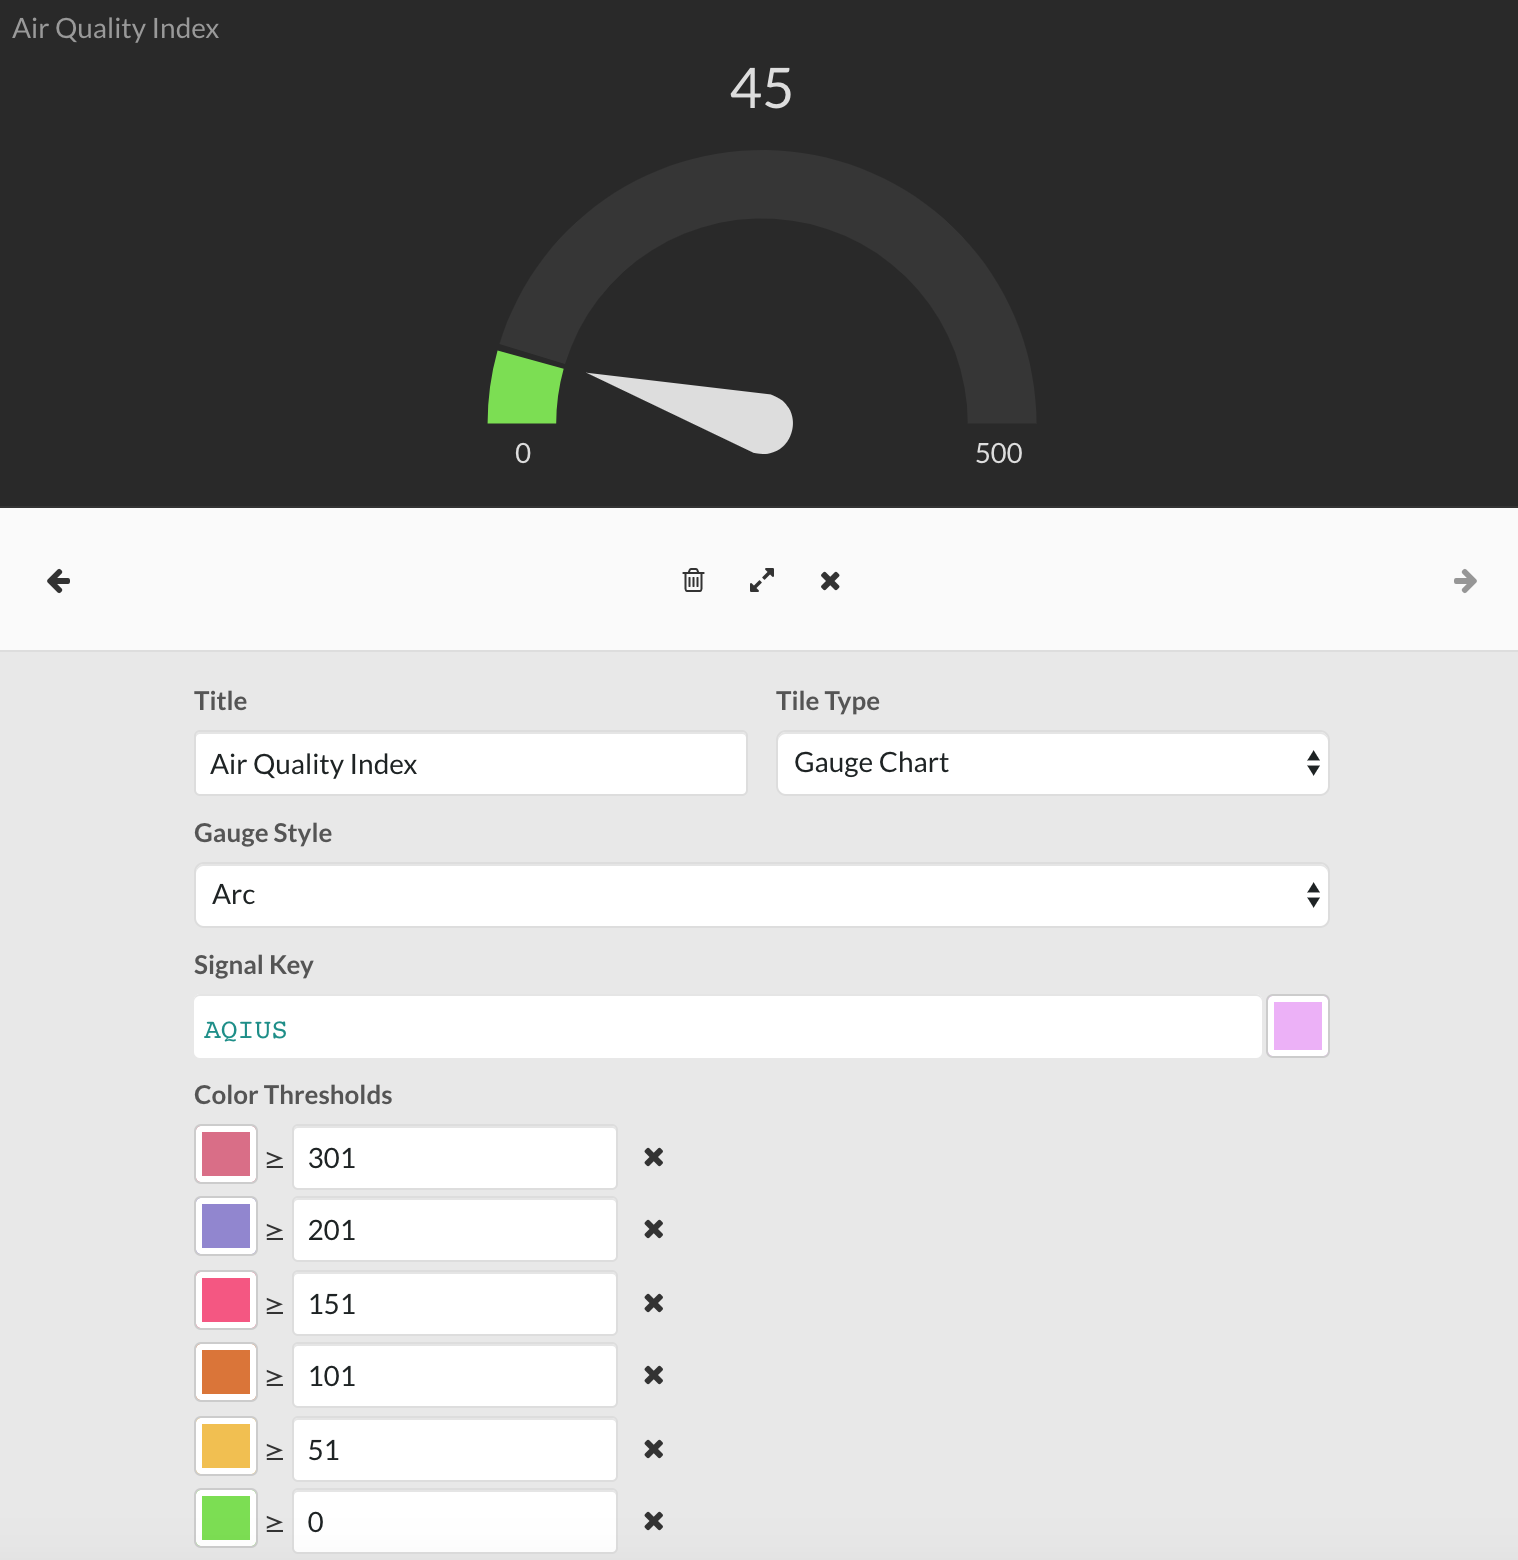
If you decide to make your AQI value a gauge, you can then set the color threshold to be similar to the air quality index chart. This gives you an instant update on where the AQI value falls on the chart when you check your dashboard.
So you have everything you need to create an air quality dashboard. But what if you want to add more or add this to a weather dashboard you've already created? If that is the case then keep reading!