Collecting huge amount of data of building has gained importance in the last years. Indeed, with the growth of the Internet of Things, getting data using sensors has become always simpler and cheaper. All these raw data are usually stored in big databases, ready to be used for all kind of applications.
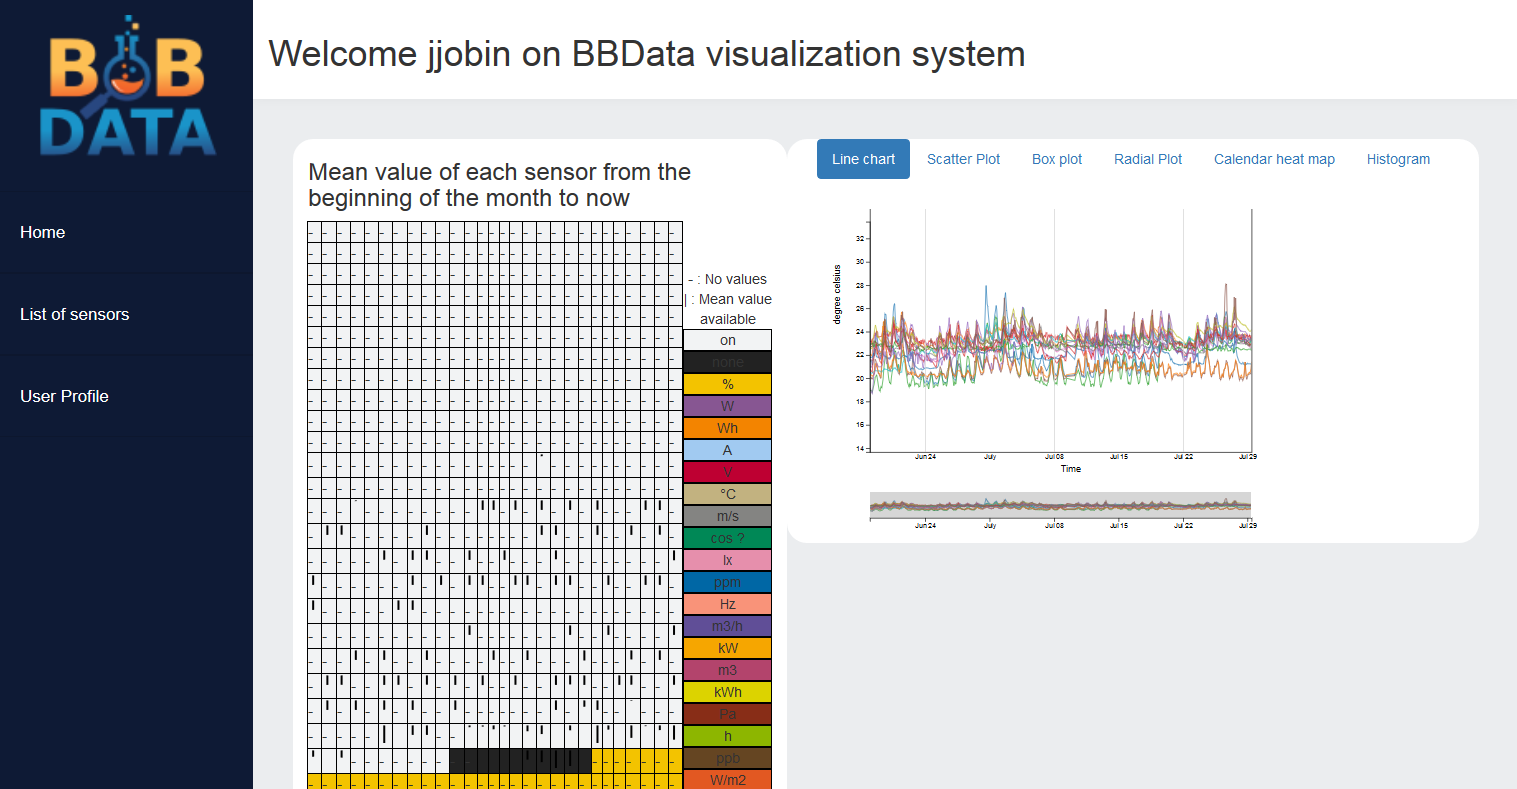
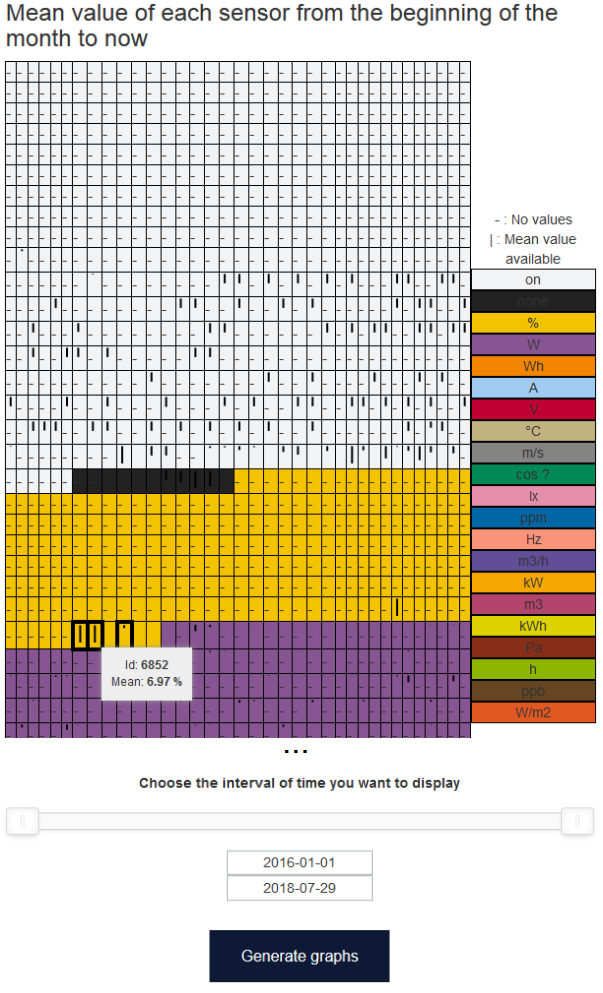
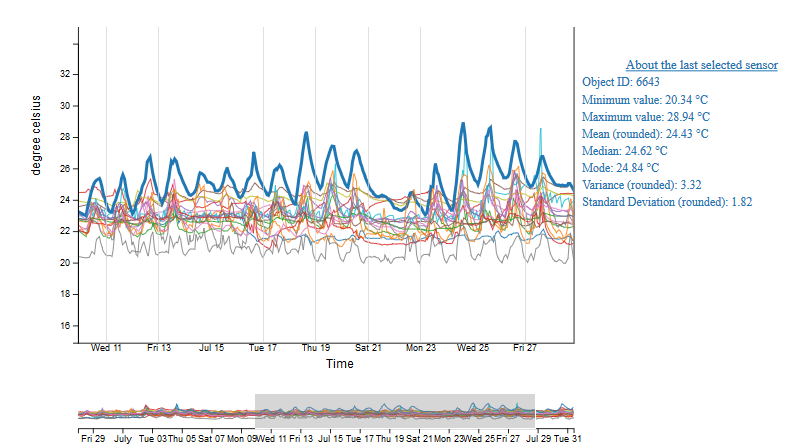
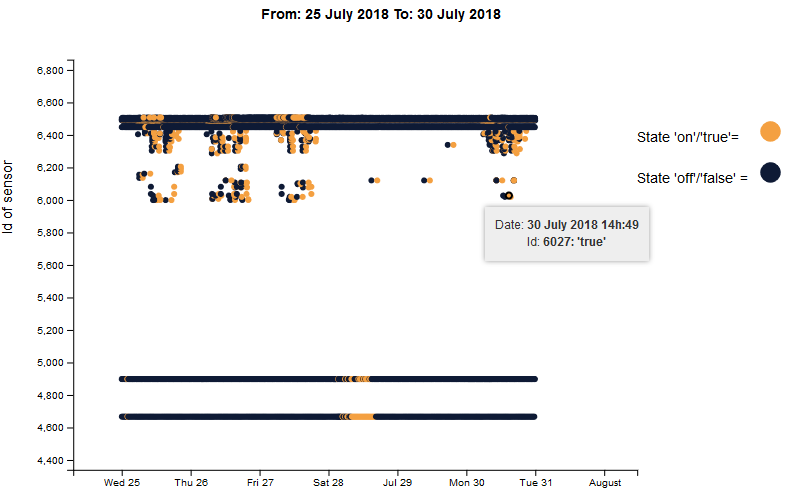
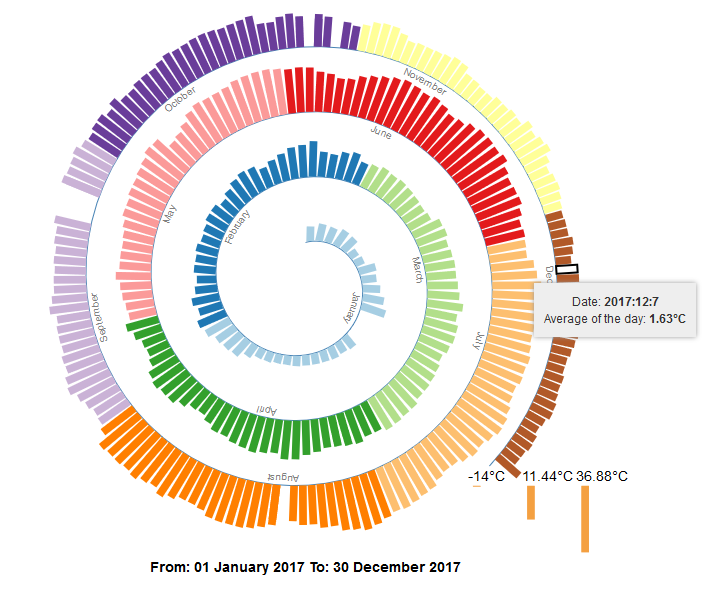
That's exactly what was done in the "Smart Living Lab", a smart building in Fribourg, in which almost 3000 sensors were installed to measure temperature, carbon dioxide, power, energy, electric potential etc. All these data are stored in a database which is accessible through a RESTful service that can be queried to get measures of specified sensors for a given interval of time.\ Hence, this work consists in giving a visual meaning to the data through different visualizations, allowing the user of the system to have a better understanding of the building. Therefore, the first part of this work was devoted to develop the web platform that hosts the visualization system. Then, the second step was to use D3.js, a JavaScript library dedicated to the creation of visualizations based on SVG, JavaScript and CSS technologies, to create many visualizations. Finally, the last task was to put all visualizations together on the web platform and to create a user-friendly interface such that exploring data of the building is simple and clear.