This is the same functionality as networkstatic/cloud-bandwidth but using InfluxDB and Grafana only (not whisper, carbon etc).
- InfluxDB time series DB and Grafana. The advantage is less moving parts and some powerful aggragate functions from InfluxDB along with data rollups and some other key differentiators from other TSDBs. It uses the Graphite plugin to enable simple time series entries.
- Grafana 2.0+ which has recently been re-rolled in Go. InfluxDB 0.9+ changed the API significantly so Grafana required significant work also. The combination still misses a few things but overall is close to being super usable.
If this all looks foreign:
- The Docker free training site is great for all levels of users at Docker Training
- If unfamiliar with Grafana, check out Grafana Play.
- If you prefer a GUI to get to know Docker, check out Kitematic by Docker
I only have the integration tests migrated. I will add the run.sh script to use it for real bandwidth next weekend.
git clone https://github.com/nerdalert/ts-net.git
cd ts-net/
docker-compose -f run_demo.yml up
Then point a browser to http://<DOCKER_IP>:8000
To stop and remove the demo containers running with compose simply run the following in the same directory as the .yml file:
docker-compose -f run_demo.yml kill
docker-compose -f run_demo.yml rm -f
To run the tests from a Docker Machine VM use the following instructions. If you have a native instance running you simply use the native keyword with the run.sh wrapper shown later in the readme. In a new terminal, your docker machine should have at least a virtualbox machine defined.
Note: The machine (VM) naming needs to match the pattern of driver-foo. 'driver' being one of the dozen or so docker machine drivers and foo being whatever you want to end it with. Both of those with a - delimiting them. For example, vmwarefusion-machine,
Here are the driver names as defined by docker machine:
- amazonec2
- azure
- digitalocean
- openstack
- rackspace
- softlayer
- virtualbox
- vmwarefusion
- vmwarevcloudair
- vmwarevsphere
You can test both source and destination polling for testing on the same machine. Here we will use the virtualbox driver as an example:
This is only required if you aren't running a native instance of Docker on Linux for example. For the remote Cloud test you would use Docker-Machine unless the provider offers native Docker instances via the Docker remote API (e.g. Joyent).
If an instance is not already running, start one with a docker-machine create:
$ docker-machine create \
    --driver virtualbox \
    virtualbox-machine
List the machines:
$ docker-machine ls
NAME                   ACTIVE   DRIVER         STATE     URL                         SWARM
virtualbox-machine     *        virtualbox     Running   tcp://192.168.99.101:2376
A simple way to get the external address is:
$ docker-machine ip vmwarefusion-machine
172.16.166.157
Then point a browser to http://<DOCKER_IP>:8000
If you dont see data in the browser but instead see datapoints outside time range then change your time to the past 12 hours and you should see the data. Javascript is notoriously finicky with timezones. You can explicitly set one or use UTC. I have run into this a couple of times with grafana but havent figured out the pattern yet so will patch the config when I do.
git clone https://github.com/nerdalert/ts-net.git
cd ts-net
docker-machine create --driver virtualbox virtualbox-machine
eval "$(docker-machine env virtualbox-machine)"

docker-machine ls
# NAME                   ACTIVE   DRIVER         STATE     URL                         SWARM
# virtualbox-machine     *        virtualbox     Running   tcp://192.168.99.101:2376
Pass -f and the demo yml file to docker-compose which tells it to use run_demo.yml configurations rather then the default docker-compose.yml that is in the same directory. Again, the -f run_demo.yml is only for running the demo. Later when running with real data you simply use the defaults with docker-compose up. Note you have to use -d since the init container that creates the initial InfluxDB database will exit once it completes its API operations. If you dont use daemon mode it will shutdown the rest of the containers in the docker-compose group.
docker-compose -f run_demo.yml up -d
Since in -d daemon mode, the containers will be run in the background. To see logs of the ops run:
$ docker-compose logs
To attach to a container and open a bash shell (like ssh but cooler imo :) first get the container IDs from a docker ps:
$ docker ps
CONTAINER ID        IMAGE                  COMMAND                CREATED              STATUS              PORTS                                                                                                                               NAMES
befe91ae530d        tsnet_demo             "./generate_test_dat   About a minute ago   Up About a minute                                                                                                                                       tsnet_demo_1
b58938c88098        tsnet_grafana          "/usr/sbin/grafana-s   About a minute ago   Up About a minute   0.0.0.0:3000->3000/tcp                                                                                                              tsnet_grafana_1
52c3bcb00e50        tsnet_influxdb         "/opt/influxdb/influ   About a minute ago   Up About a minute   0.0.0.0:2003->2003/tcp, 0.0.0.0:8083->8083/tcp, 0.0.0.0:8086->8086/tcp, 0.0.0.0:8125-8126->8125-8126/tcp, 0.0.0.0:32947->8125/udp   tsnet_influxdb_1
ca959836fb92        networkstatic/iperf3   "iperf3 -s"            12 hours ago         Up 12 hours         0.0.0.0:5201->5201/tcp                                                                                                              bandwidth_agent
Pass the CID (Container ID)
docker exec -i -t b58938c88098 bash
# Which drops you into a bash shell inside of the container namespsace that looks and feels like a standalone Linux system and associated commands for the distro
root@grafana:/usr/share/grafana# ps -eaf
UID        PID  PPID  C STIME TTY          TIME CMD
root         1     0  0 09:43 ?        00:00:00 /usr/sbin/grafana-server --config /opt/conf/grafana.ini
root        13     0  0 09:46 ?        00:00:00 bash
root        19    13  0 09:46 ?        00:00:00 ps -eaf
Now point your browser to the grafana UI and see the data being graphed. Get the ip address with:
docker-machine ip virtualbox-machine
# 192.168.99.101

# or docker-machine ls and see the API ip:port '192.168.99.101:2376'

docker-machine ls
# NAME                   ACTIVE   DRIVER         STATE     URL                         SWARM
# virtualbox-machine     *        virtualbox     Running   tcp://192.168.99.101:2376
The docker-compose and dockerfile instruct grafana to use port 8000 8000
http://<MACHINE_IP>:8000
You will begin to see the following be generated:
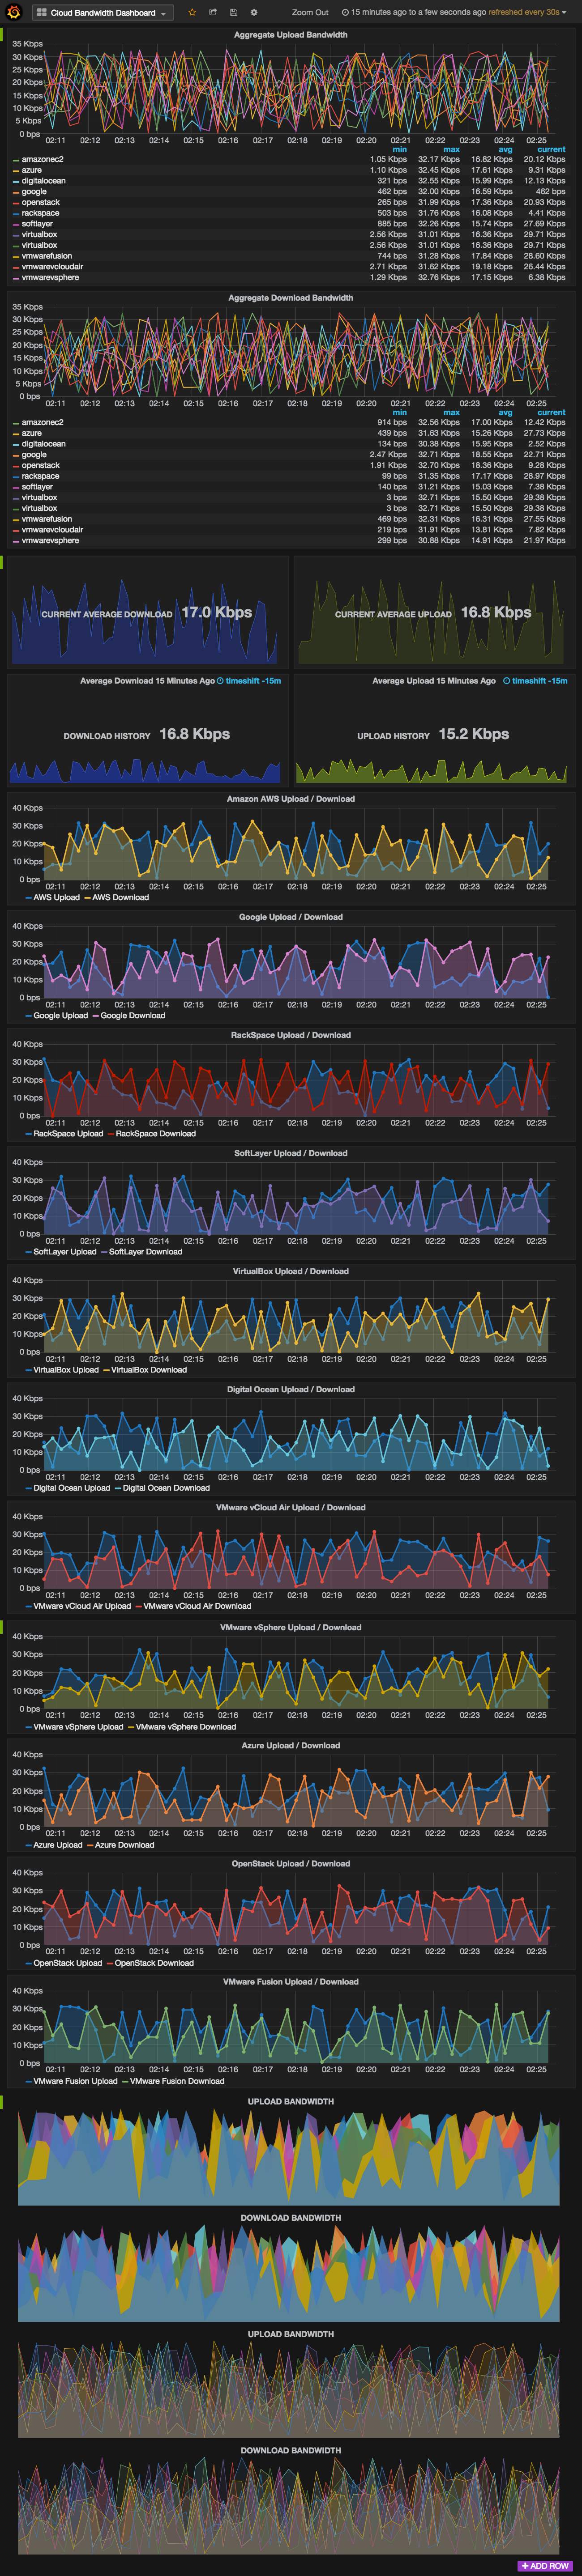
To reiterate these are mock values being written to the TSDB using docker-compose -f run_demo.yml up.
Once done with the demo stop and recreate the containers using the default yml file.
docker-compose -f run_demo.yml kill
docker-compose -f run_demo.yml rm -f
To dispose of the current state of the containers (remove container/volumes and recreate them) simply paste:
docker-compose -f run_demo.yml rm -v -f  \
    && docker-compose -f run_demo.yml  build \
    && docker-compose -f run_demo.yml up -d
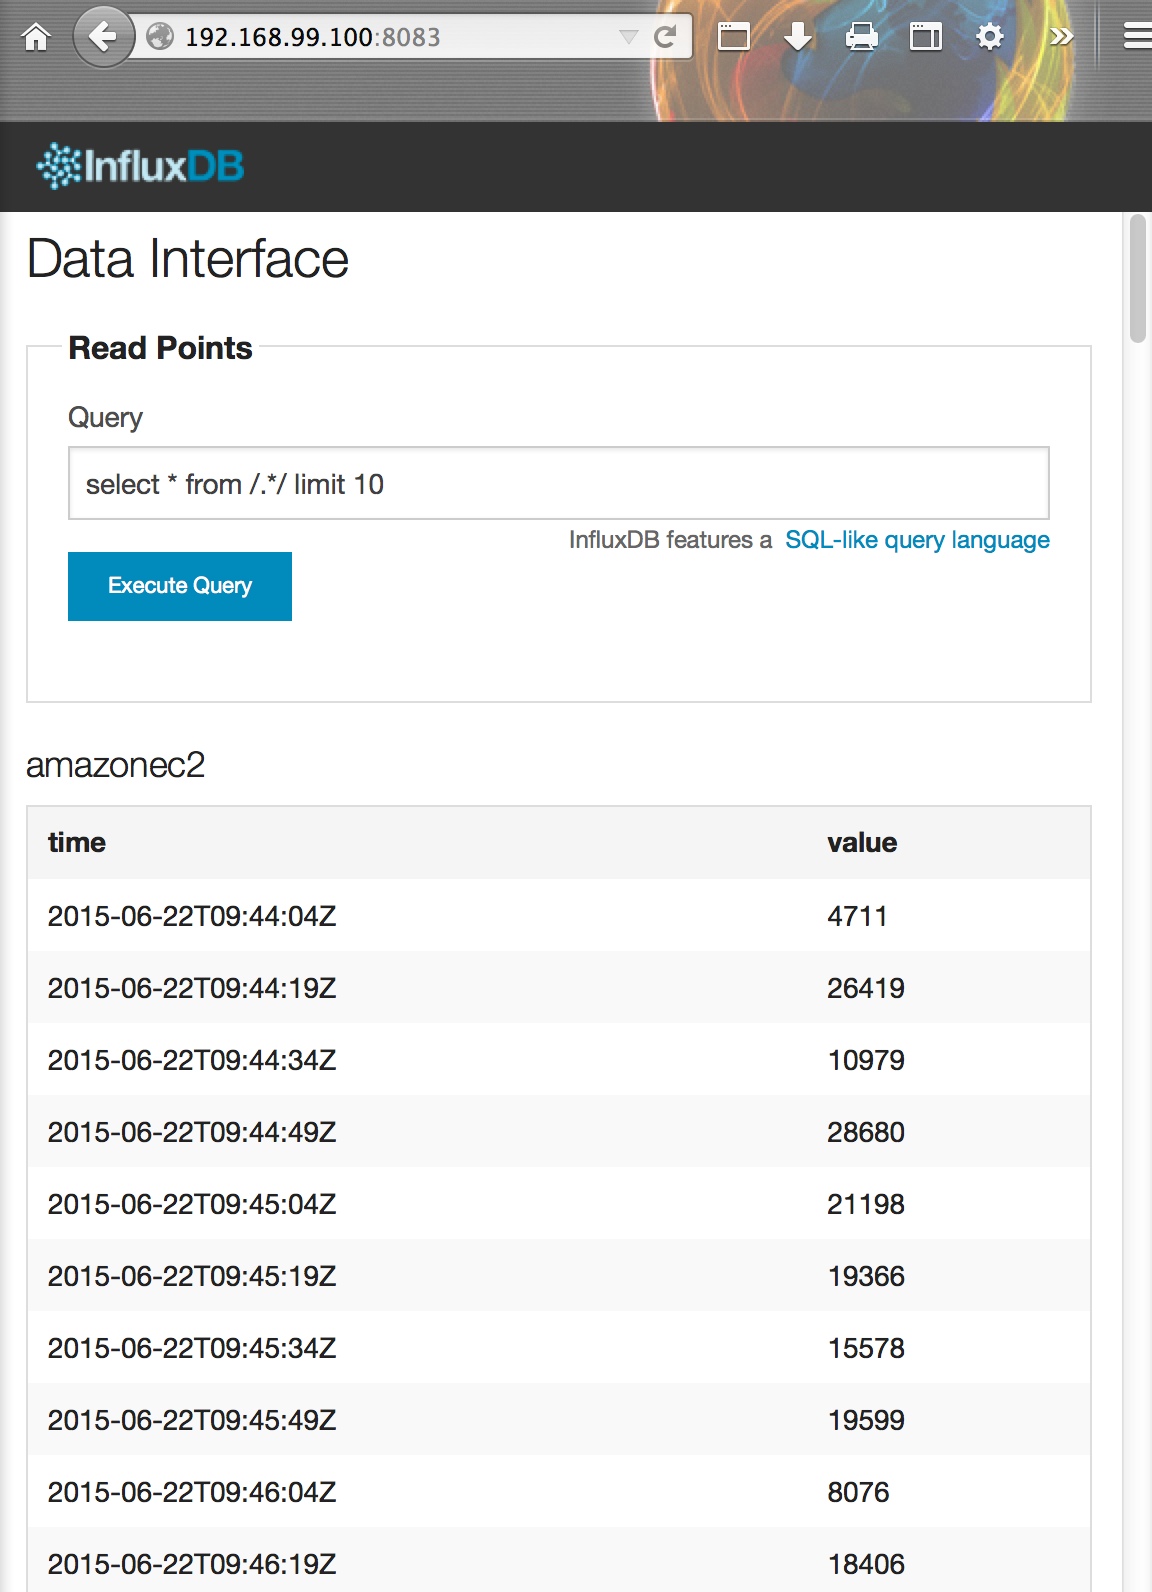
You can go to the InfluxDB admin page whose port is exposed by the compose yml file.
Example url: http://192.168.99.100:8083/
The IP is the docker host/machines IP.
Then login -> explore data (a DB named graphite should be there if the compose demo is running):
In the query box use select * from /.*/ limit 10 to query the last 10 data points in all of the series.
It should look something like this:
note I need to rename the time series as upload/download are not unique. I think its just a different opinion between whisper db and influx.
I need to change the run.sh script around to use InfluxDB. I will one night this week :)