normalize
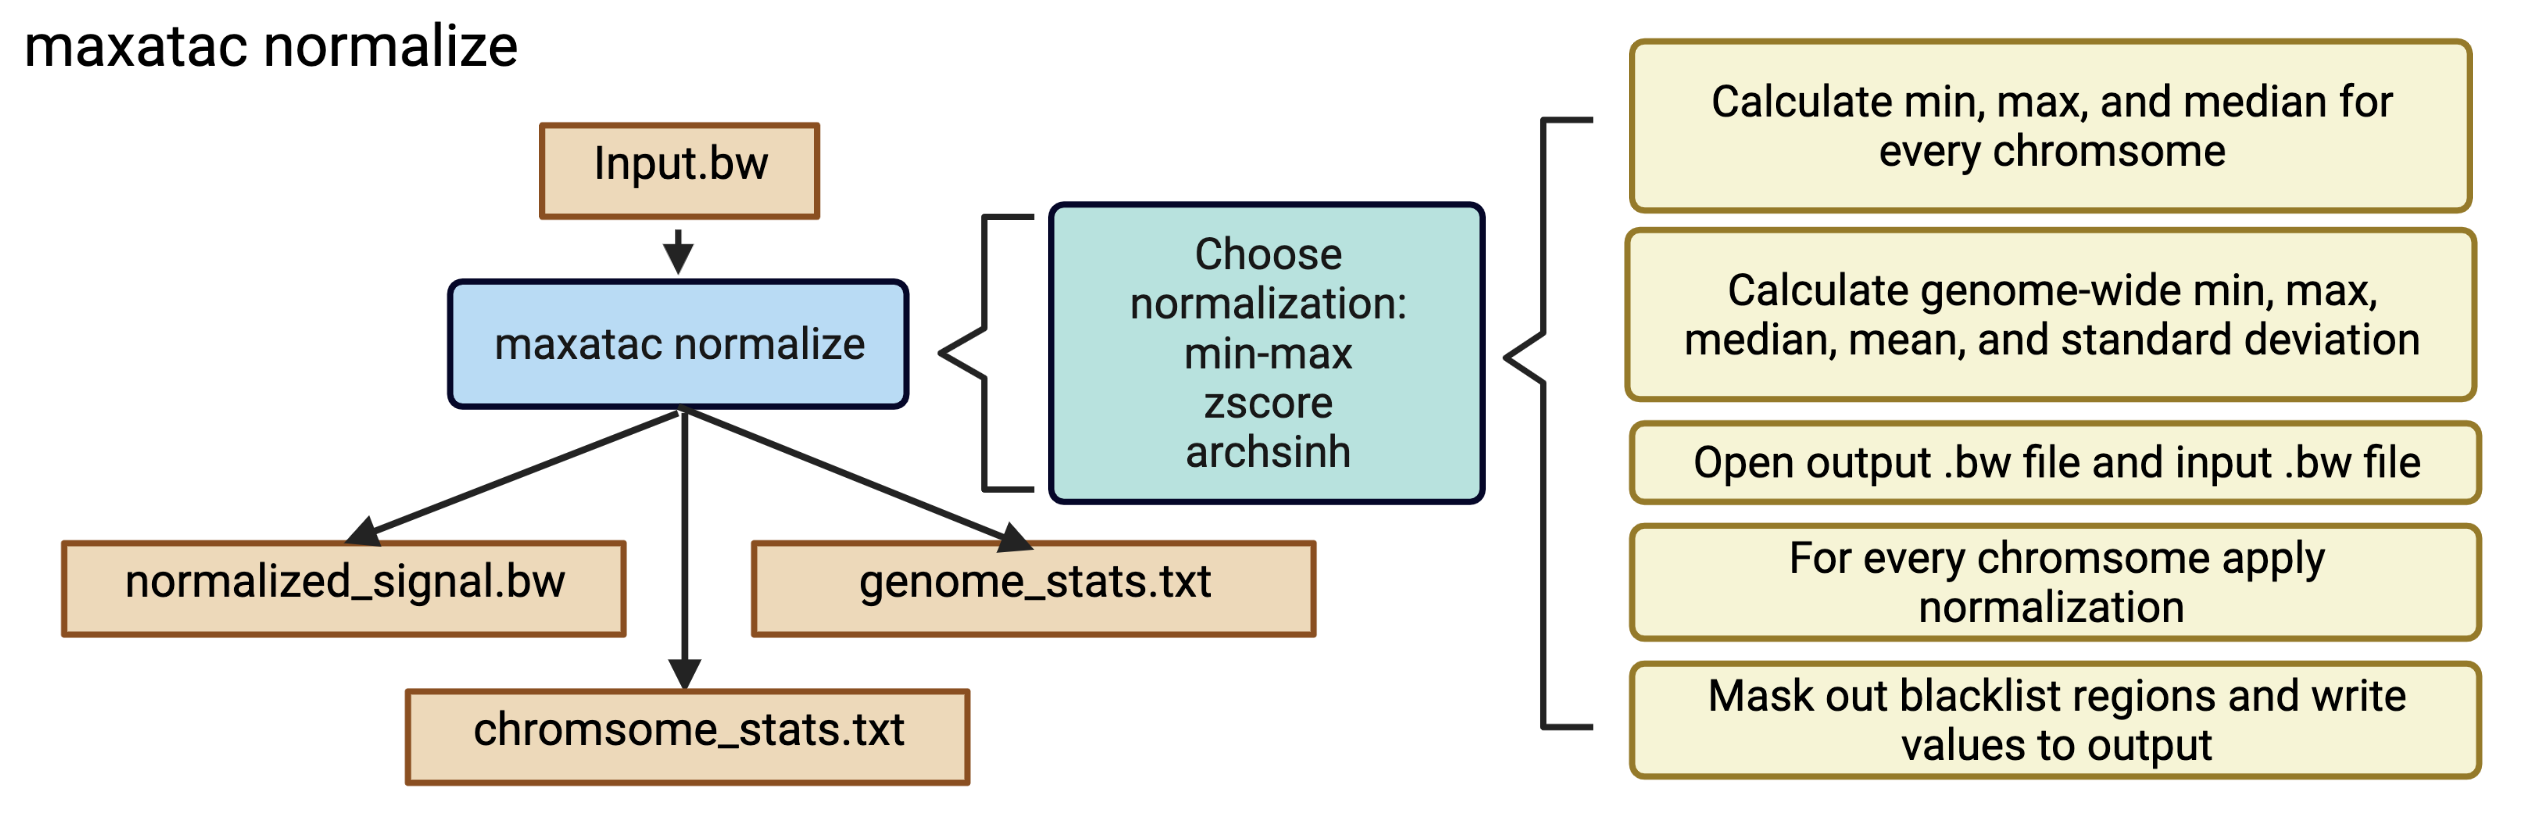
The maxatac normalize function was developed to help users normalize .bigwig files using the different approaches available in the literature. There are currently 4 different methods of normalization available:
-
min-max: Find the genomic min and max values, then scale them between [0,1] or some user-defined range. The max value can be calculated as (1) the absolute max value across the genome (traditional definition of min-max) or (2) you can set a percentile cutoff to use as the max value. Option 2 improved robustness to outlying high ATAC-seq signal and maxATAC prediction accuracy. Specifically, we use the 99th-percentile max value instead of the absolute max value, and, given important performance ramifications, is the default. -
zscore: Set the mean value to 0 with a standard deviation of 1. -
arcsinh: Transform the values using an inverse hyperbolic sin transformation (arcsinh)
The current default for maxatac normalize is the min-max normalization approach using the 99th percentile as the maximum value.
-
-i: The input.bigwigfile -
-n: The string to use for the filename. A.bwwill be appended to this string.
Optional flags are geared towards using other normalization methods besides min-max normalization. The optional flags such as --max, --min, and --max-percentile allow you to tune the default min-max normalization. See the maxatac normalize readme for more details. Some optional flags will be used in the tutorial section.
These instructions assume you are using the hg38 genome.
We will use the same example data file IMR-90_all_chrom.bw output from the average tutorial.
In order to use your own input data with maxATAC you must perform several signal conversion steps as described in the wiki page for ATAC-seq data processing. The last step is using maxatac normalize to min-max normalize all values between 0 and 1 based on the 99th percentile max value. This tutorial only describes the min-max normalization step.
Processing Data for maxATAC:
- Retrieve data and align to reference genome
- Filter alignments and QC
- Shift reads and find cut sites
- Window Tn5 cut sites
- Generate Tn5 counts normalized by sequencing depth
- Min-max normalize the signal tracks between 0 and 1 using the 99th percentile as the max value.
maxatac normalize -i IMR-90_all_chrom.bw -n IMR-90_minmax01_percentile99 _______ _____
/\|__ __|/\ / ____|
_ __ ___ __ ___ __ / \ | | / \ | |
| '_ ` _ \ / _` \ \/ / / /\ \ | | / /\ \| |
| | | | | | (_| |> < / ____ \| |/ ____ \ |____
|_| |_| |_|\__,_/_/\_\/_/ \_\_/_/ \_\_____|
[2022-08-03 20:20:24,435]
Normalization
Input bigwig file: IMR-90_all_chrom.bw
Output filename: IMR-90_minmax01_percentile99.bw
Output directory: /normalize_output/
Using min-max normalization
[2022-08-03 20:20:24,438]
Calculating stats per chromosome
[2022-08-03 20:20:24,438]
Calculating statistics for chr1
[2022-08-03 20:20:47,539]
Calculating statistics for chr2
[2022-08-03 20:21:10,937]
...
Calculating statistics for chr22
[2022-08-03 20:28:29,610]
Calculating genome-wide statistics.
[2022-08-03 20:31:19,319]
Sample Statistics
Genomic minimum value: 0.0
Genomic max value: 8.459489822387695
Genomic median (non-zero): 0.231856
Genomic mean: 0.69545513
Genomic standard deviation: 2.2569547
[2022-08-03 20:31:19,321]
Normalize and Write BigWig file
[2022-08-03 20:49:22,092]
Total normilization time: 0:28:57.
[2022-08-03 20:49:22,093]
Results saved to: /normalize_output
The output of the maxatac normalize function is:
- The normalized
.bwfile - A file of chromosome level statistics
- A file of genome-wide statistics
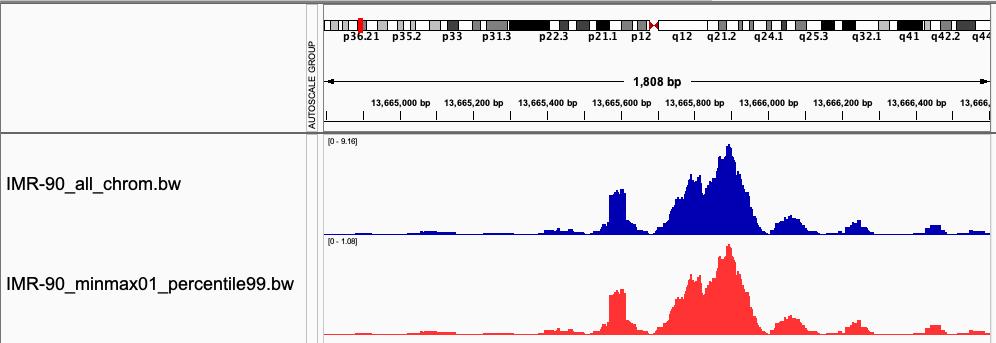
The output .bw file can be directly used by maxATAC and visualized with IGV. The screenshot below shows the comparison of the original signal track compared to the min-max normalized signal track. Notice that the shape of the distributions is the same. However, the absolute values that are shown in the top left of the signal tracks show the raw signal (blue) has a max value around 9. The min-max normalized signal (red) shows that the max value is around 1.
The values are a bit over 1, because we chose to normalize to the 99th percentile max value without clipping. This means that any value above the 99th percentile value will be over 1. You can adjust this parameter with the -clip flag.
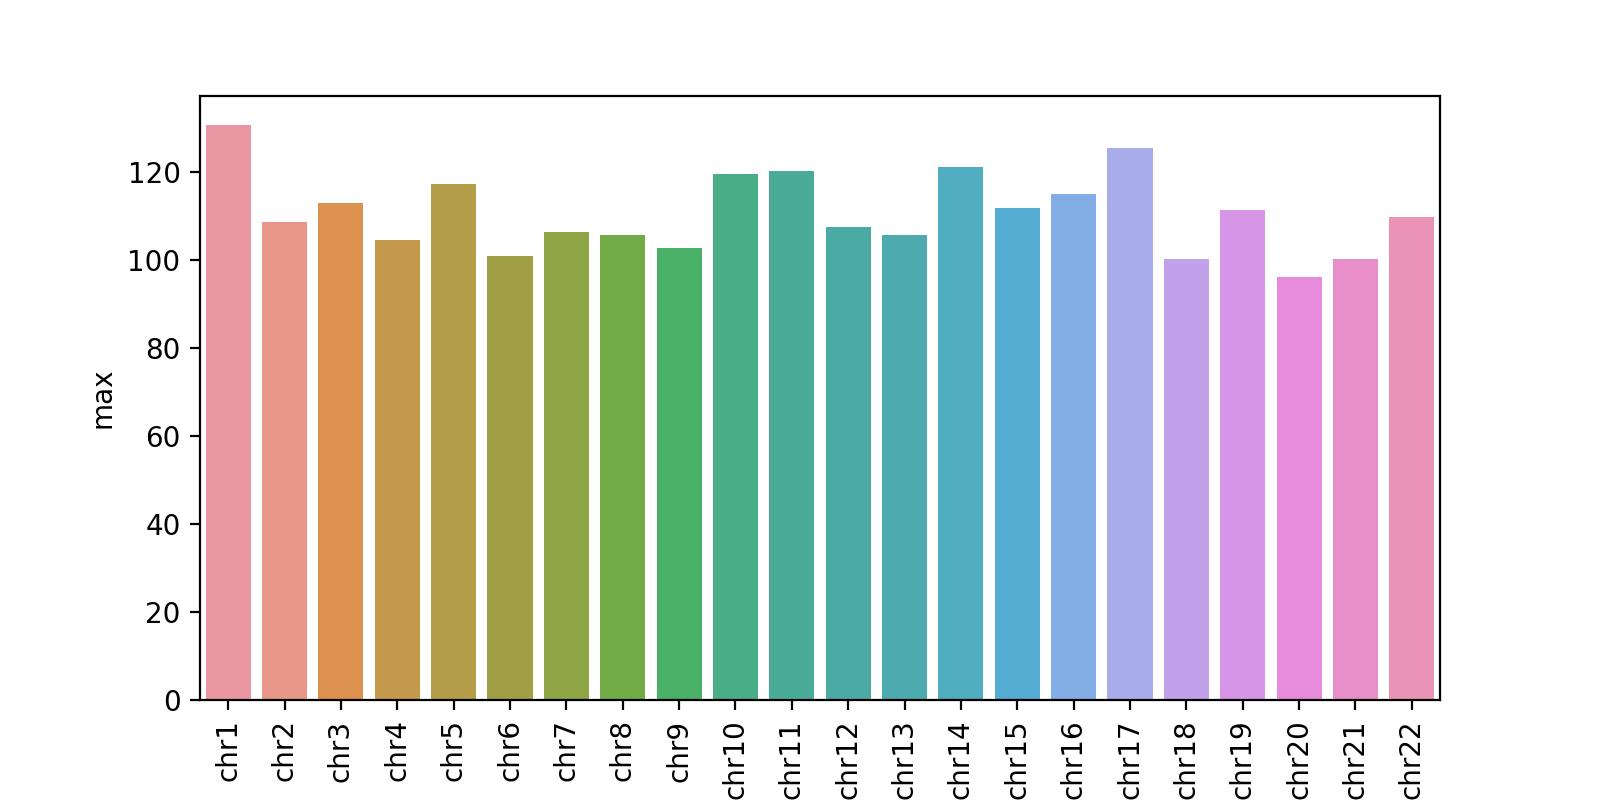
The chromosome level statistics provide the max Tn5 cut site count per chromosome. This example shows that the signal across all chromosomes is about the same, hovering around 100.
The genome level statistics file provides an overall summary of the signal across the bigwig.
Genomic minimum value: 0.0
Genomic max value: 8.459489822387695
Genomic median (non-zero): 0.231856
Genomic mean: 0.69545513
Genomic standard deviation: 2.2569547There is currently one test for maxatac normalize. The test will normalize the bigwig file that was produced from the maxatac average test.
The inputs are located in the /data/average directory of maxatac.
- IMR-90_all_chrom.bw
-
test_normalization(): Tests whether a.bwfile can be min-max normalized to the 99th percentile max value. This will run the entire normalization code for the whole file.