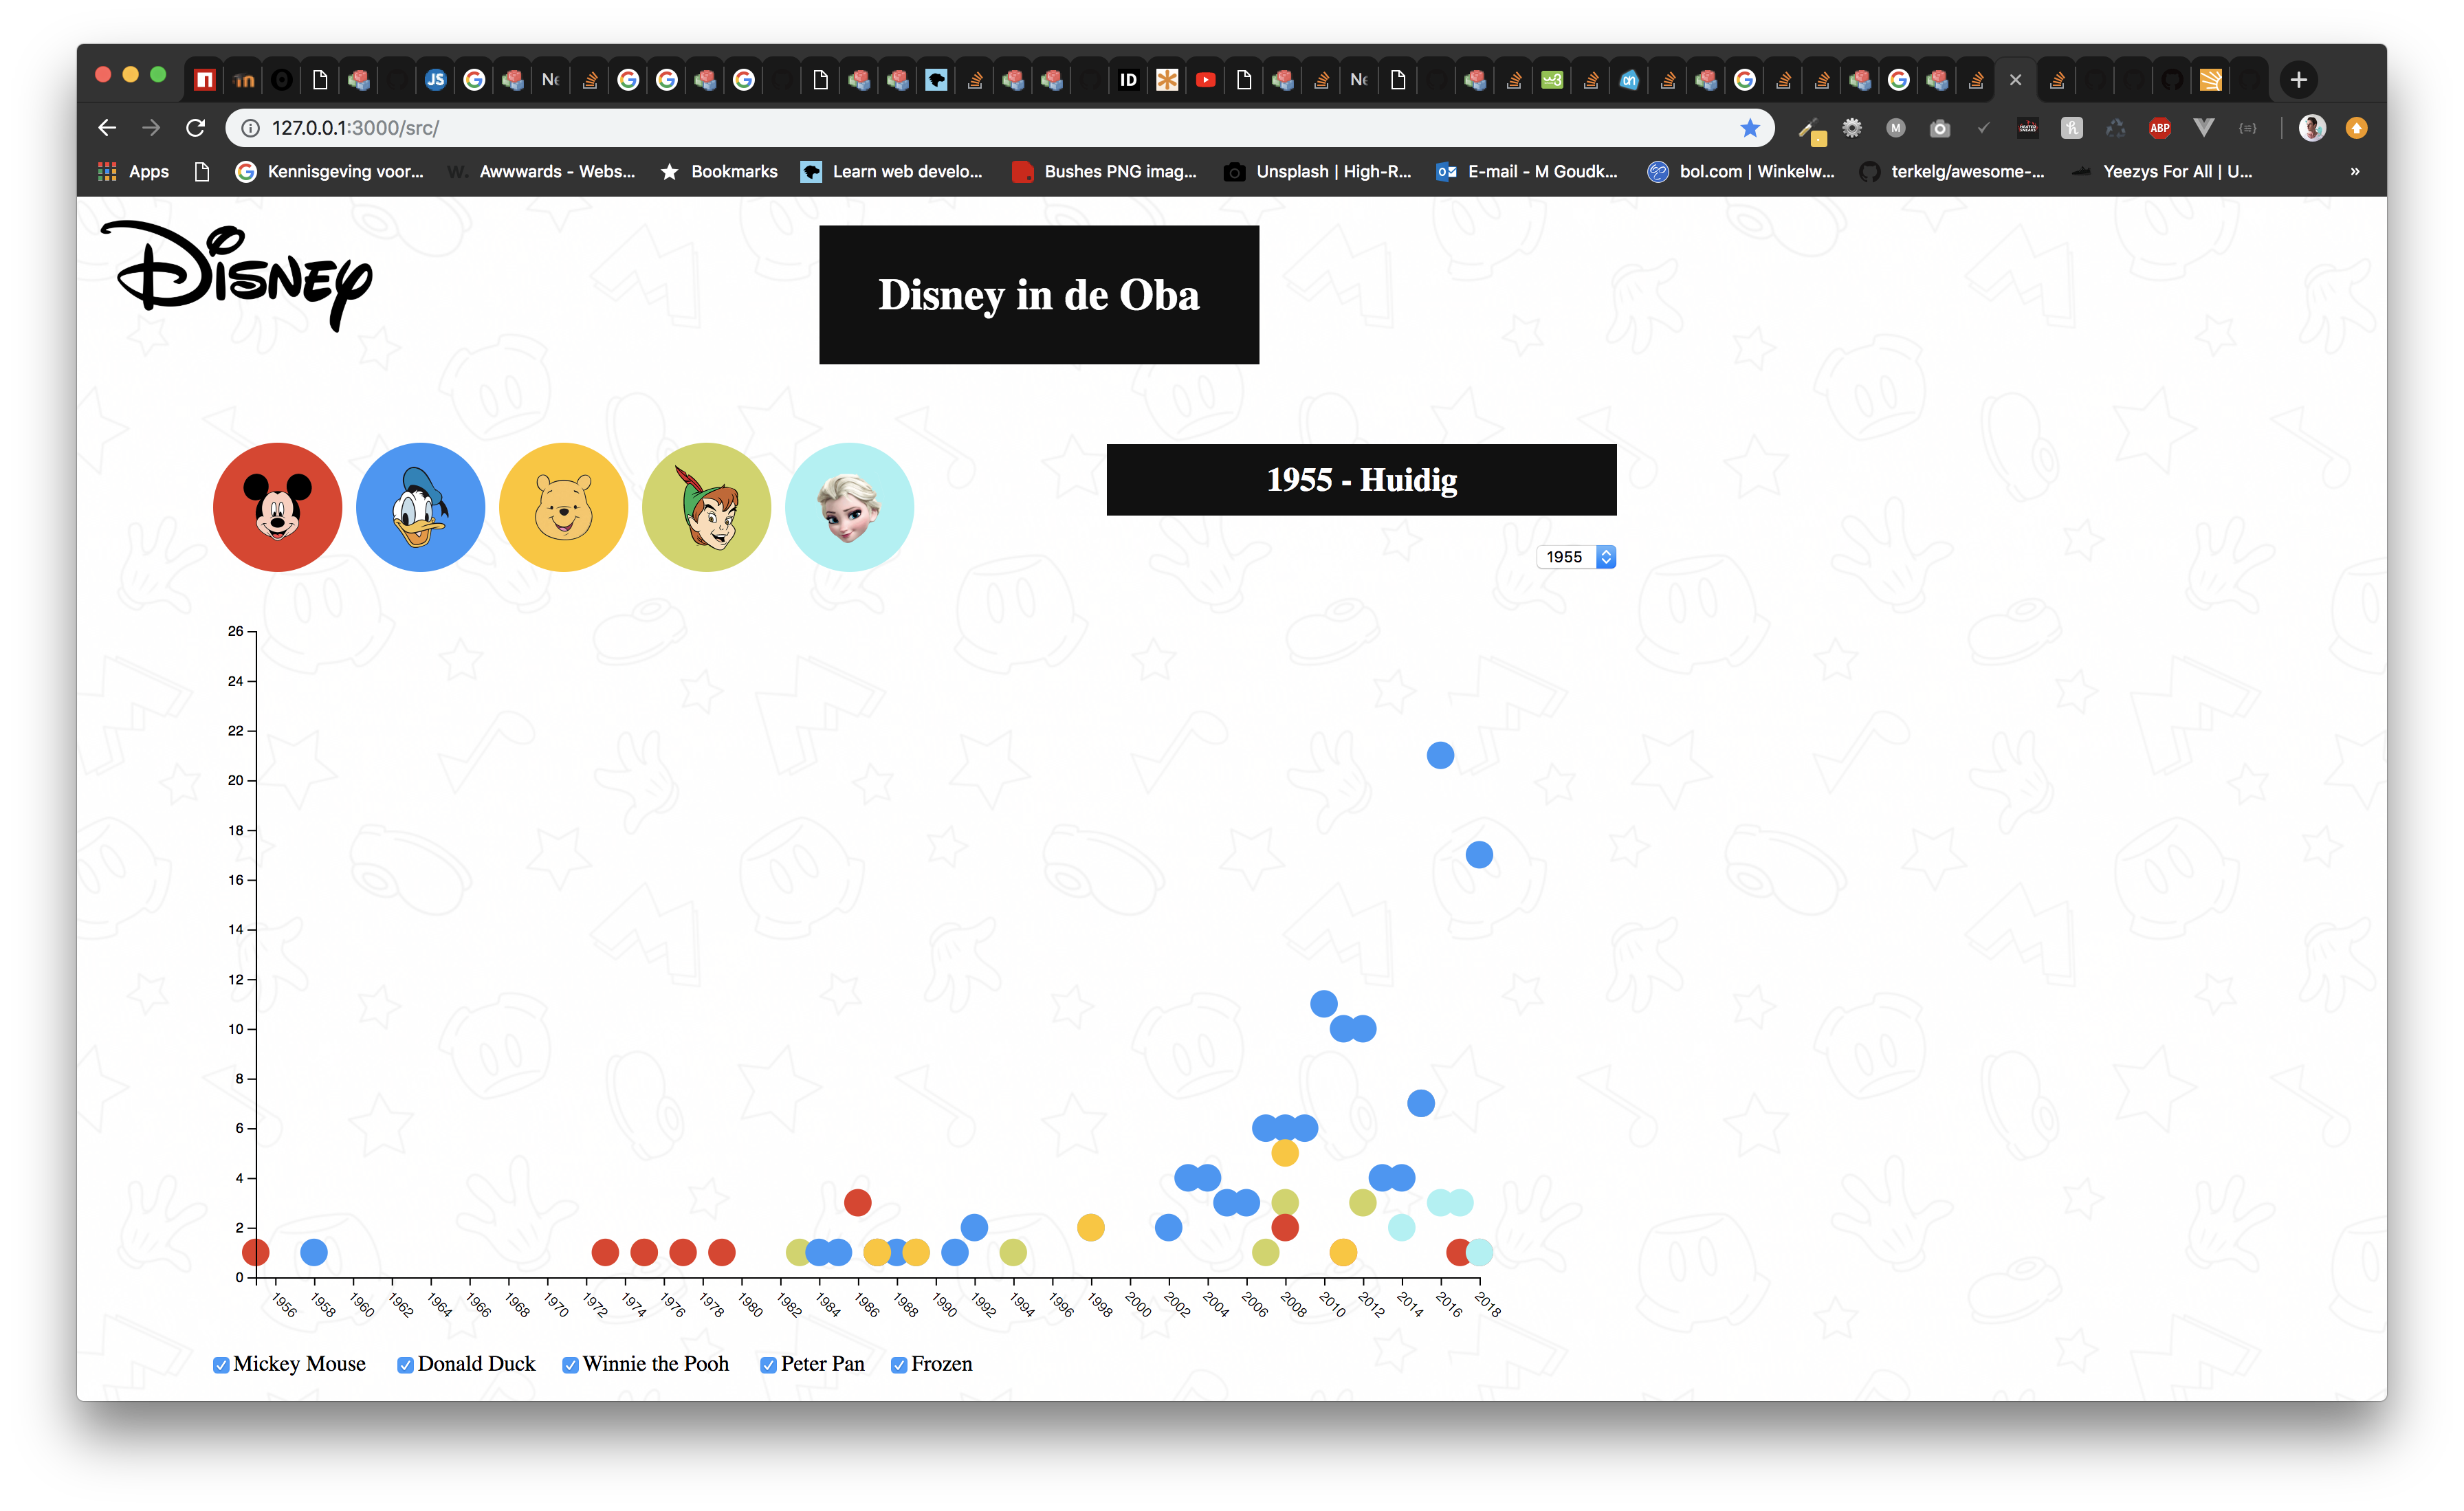
A data visualisation in which the most famous disney characters present the amount of bookt they have. Switch Characters on and off and have a look at the data if you zoom in on a specific year. The link to the interactive project can be found here
```javascript
**Clone the repository**
 git clone https://github.com/MitchGoudkuil/functional-programming

 **Enter new directory**
 cd functional-programming

 **Create a .env file**
 touch .env

 **Add public and secret key to the .env file**
 PUBLIC=987654321
 SECRET=123456789

 **Install Packages needed**
 Check the packages listed below
 npm install

 # Start application
 npm run start

 check if running on: http://localhost:30000
 ```
To get the public and secret key needed to use the Oba Api
I wanted to do something completely different in the terms of data so I decided to focus completely on all the Disney books in the Oba. This was because it were a lot of books but not that much that it was going to be a hassle with organizing the data.
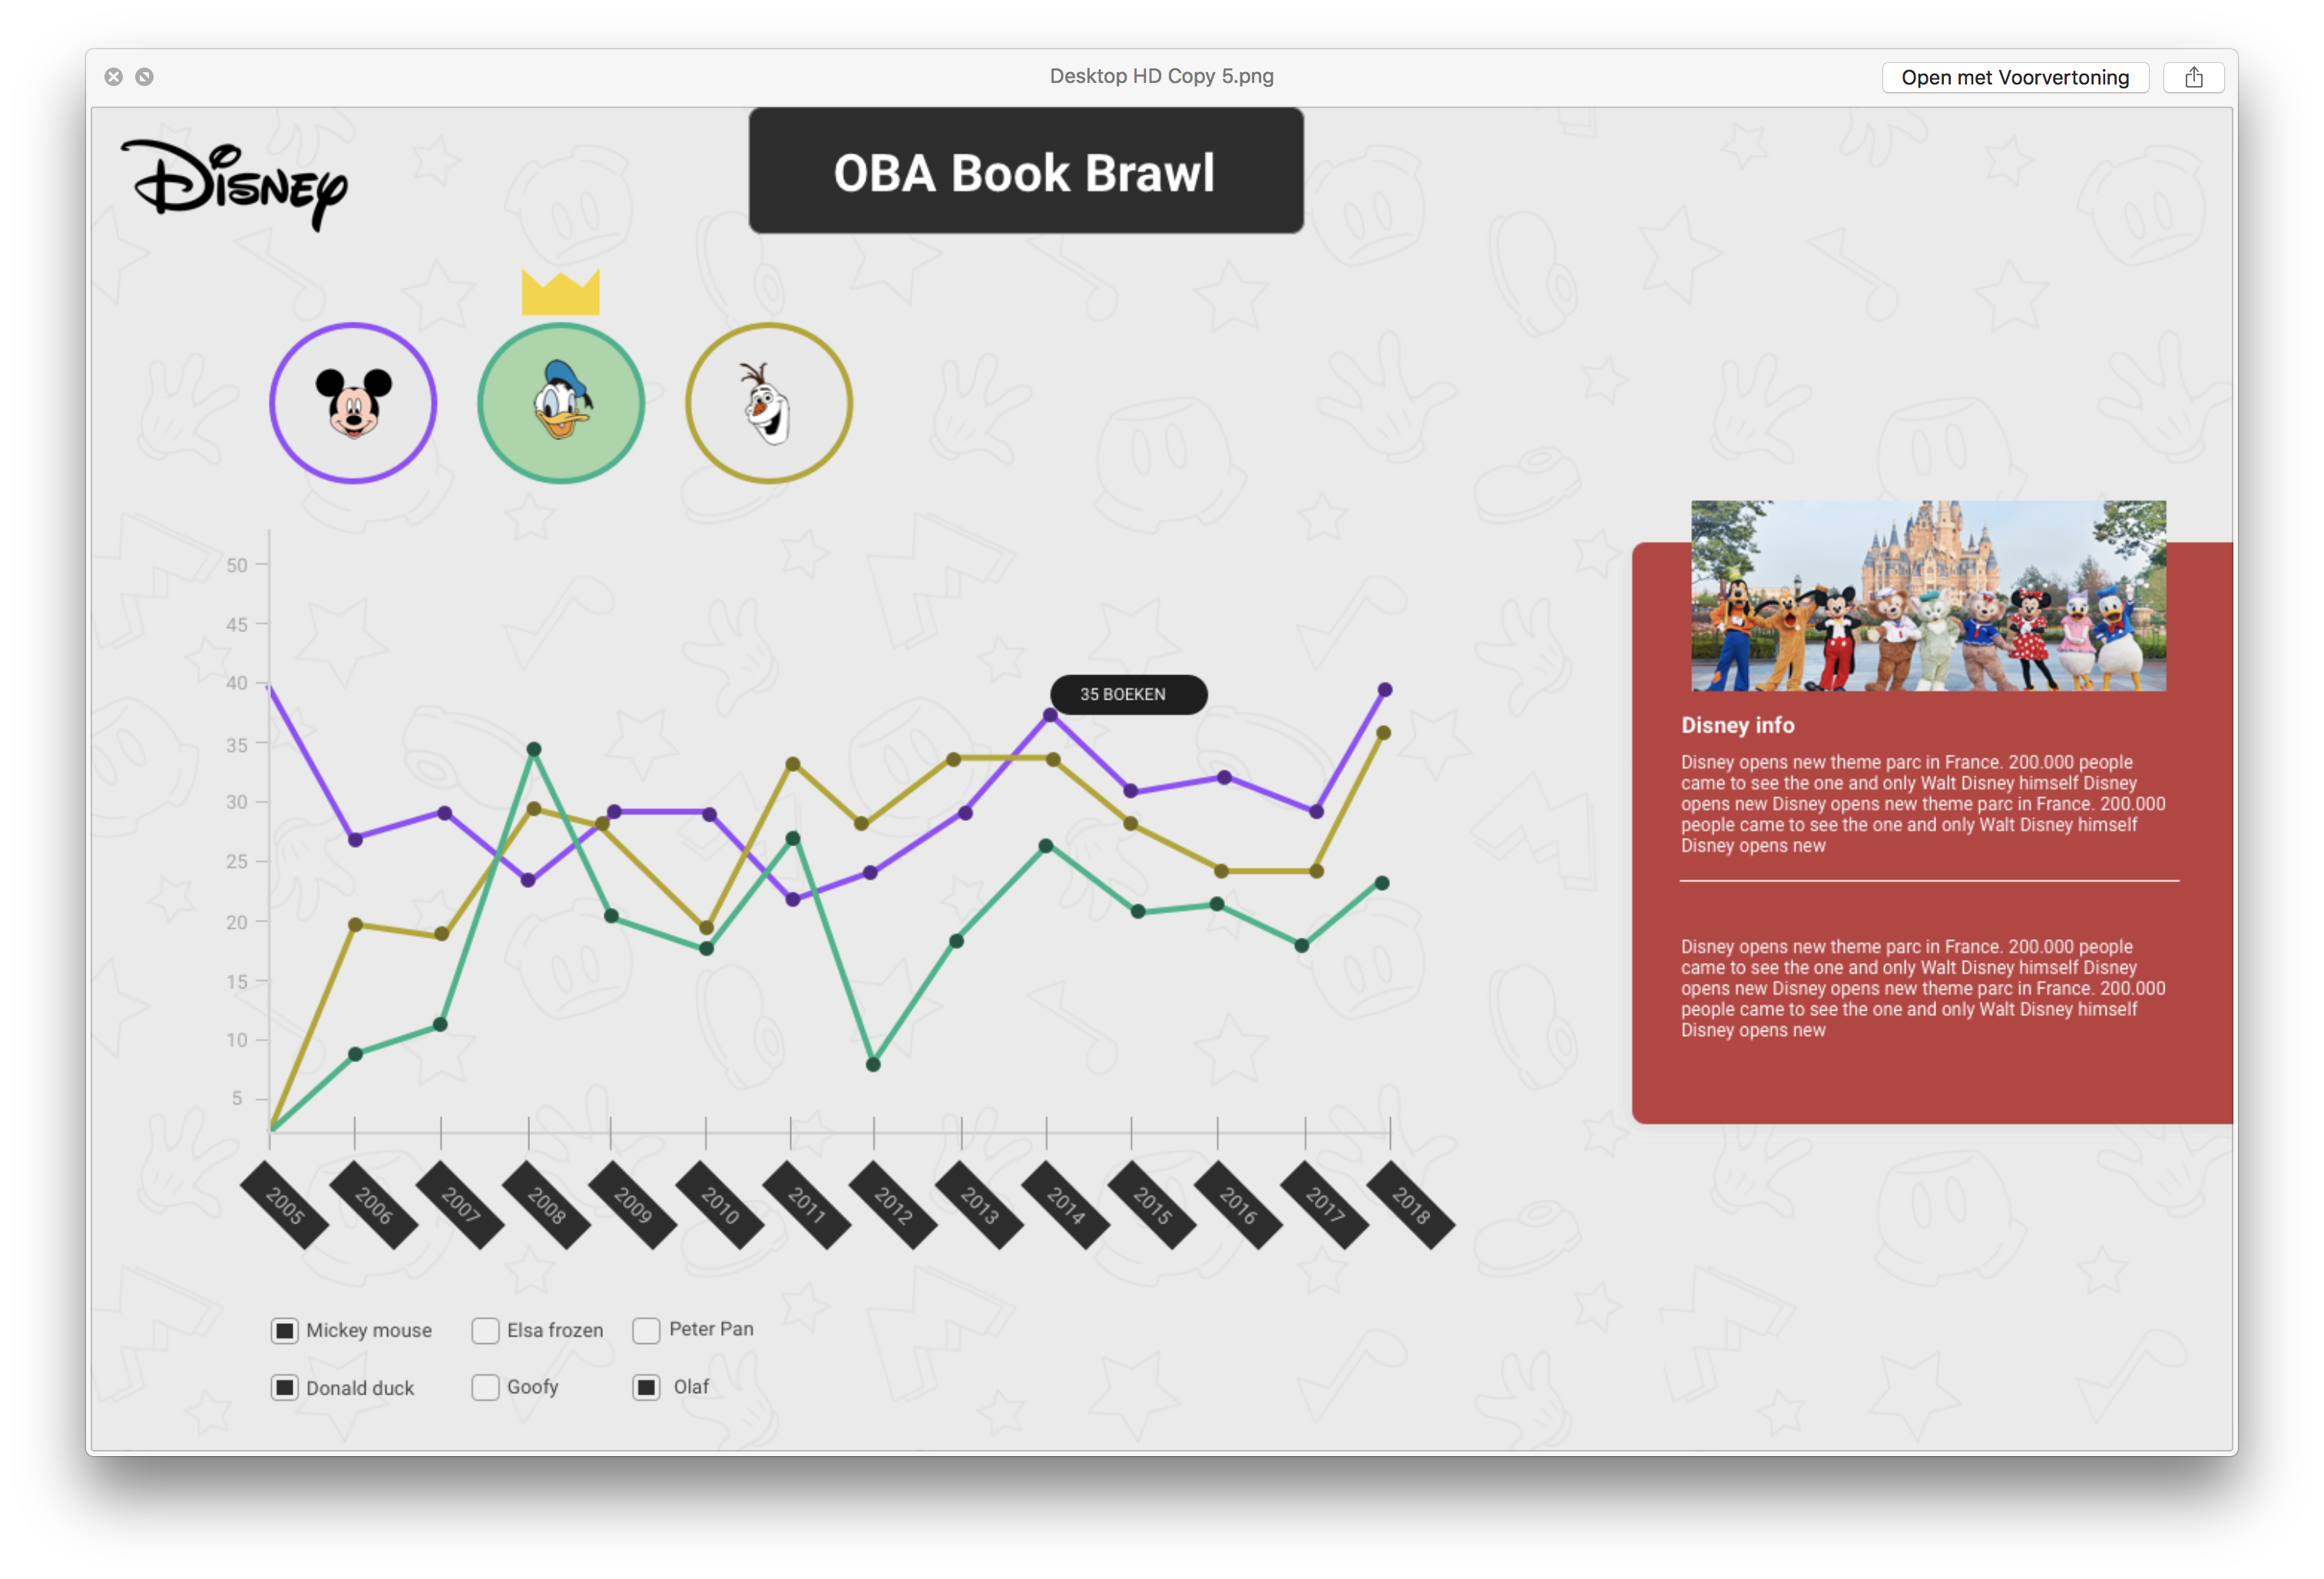
I made a design in sketch of how I wanted the visual to look like which is shown beneath.
With this design I was able to find out which data was needed.
The data needed to be able to finish the data visualisation as designed:
- Book titles
- Book book summary
- Book Author
- Book cover image
- Book year
- Book Language
- Book publisher
- Amount of pages
Once the Oba Api works its possible to obtain data. To get all disney books set the query to disney and set a maximum amount of pages in the index.js file.
client.getAll('search',
{
 q: 'disney',
 librarian: true,
 facet : "type(book)",
 refine: true
},
{
  page: 1,
  pagesize: 20,
  maxpages: 75
})
Make a new array in which all the data is going to get stored like:
let bookarray = [];Because the page count and the title of the book has a lot of extra unneeded information in them we need to use indexof and trim to actually just get the title and page count. Pagecount needs Number() as well to turn a string with a number to an actuall number.
let pageCount = book.description && book.description[0] && book.description[0]['physical-description'] && book.description[0]['physical-description'][0] ? book.description[0]['physical-description'][0]._ : null
pageCount = Number(pageCount.substring(0, pageCount.indexOf("p")).trim())

let title = book.titles[0] && book.titles[0].title[0] && book.titles[0].title[0]['_'] ? book.titles[0].title[0]._ : null
title = title.substring(0, title.indexOf("/")).trim()
Pushing the rest of the data in an Object to the bookarray with all checks included else given back null:
bookarray.push({
  bookTitle : title,
  bookSummary : book.summaries && book.summaries[0] && book.summaries[0].summary && book.summaries[0].summary[0] && book.summaries[0].summary[0]['_'] ? book.summaries[0].summary[0]._ : null,
  bookAuthor : book.authors ? book.authors[0]['main-author'][0]._ : "no author",
  bookCover : book.coverimages[0] && book.coverimages[0].coverimage[0] && book.coverimages[0].coverimage[0]._ ? book.coverimages[0].coverimage[0]._ : null,
  itemYear : book.publication && book.publication[0] && book.publication[0].year[0] && book.publication[0].year[0] ? book.publication[0].year[0]._ : null,
  itemLang : book.languages && book.languages[0]  && book.languages[0].language && book.languages[0].language[0] ? book.languages[0].language[0]._ : null,
  itemPublisher : book.publication[0].publishers[0].publisher[0]._ ? book.publication[0].publishers[0].publisher[0]._ : null,
  pageNumber : pageCount
})The actual visualisation is made in the src folder, in here the data.json file is stored together with an index.html and d3.js .
The data is loaded with a d3.promise function which imports the json file and puts all data into a variable named data. The visualisation is made inside the promise.
d3.json("newdata.json")
  .then(data => {
    //visualisation is made here
  })
I had to change the way my data was organised because the way it was set-up in my json file it was unusable to complete the task. I made an Array in which 5 charater names were stored. In this array I made a function together with Dennis Wegereef in that checked if one of the names is shown in the title of a book. If it did the book would get filtered out of all the books and stored. This way it was able to get all books(in which the character name was in the title) from all characters.
const newData = data.filter(book => {
  possibleAnswers.forEach(name => {
    if (book.bookTitle.toLowerCase().includes(name)) {
      book.disneyCharacter = name;
    }
  });
  if (book.disneyCharacter) {
    return book;
  }
});
To get the data structure I needed for the first visualisation I had to use the d3 function 'nest()'. This way I could get 5 objects with the name of the characters and al the years and data stored in those years. Its really nice but also still a bit confusing to work with the nest function. It makes it a lot easier to organise your data a different way but in my oppinion its also really difficult to make changes to it. I found out about that when I wanted to change to a single year which was almost impossible to do. Thankfully Folkert was able to make it work. I know what the whole code does but I never could have written it myself.
const goodData = organizedByCharacter.map(character => {
  const byYear = d3
    .nest()
    .key(function(book) {
      return book.itemYear;
    })
    .entries(character.values);
  return {
    name: character.key,
    years: byYear
  };
});
The first visualisation shows all the years possible gathered from all obtained books and thanks to d3.extend() it was easy to filter out all double years and only get the unique years from lowest to highest.
const domainYears = d3.extent(newData, function(d) {
  return d.itemYear;
});
It was not really that hard to make the scatter plot but to make an onchange event that changes the x and y axis was a pain in the ass to do. The data that I used was good but it needs a lot of extra code to actually be able to use it. This is because when you want to look at a specific year it is needed to do a new filter function in which is checked if the year exist at a character, and if it does it shows. The problem is that the d which is the data then changes.
It was fun to make the visualisation but also really hard at times. There was a lot of errors which I had no idea about how to handle them. I tried to do it but I needed a lot of help which was stressing me out and made me feel like a dumbass.
I still did a lot of code myself but when it became hard I always ended up asking classmates on how it works.
I started of by making a line chart like I designed in sketch. I soon found out that every character had a different starting point which made a lot of sense but not for me to use a multi line graph. I changed to a scatter plot because this way there were a lot of different ways I could show the data like the radius of the circles etc. I worked with a scatter plot before but this time it was different because I also had to work with an update and onchange function which changed the axis and the circles. Sadly it did not really turned out the way I wanted it to look. I could not figure out how to get the names on the x axis when it changed to a specific year. I tried for 4 hours but after that I gave up. Some sleep is needed as well.
- Import a shit load of data to the json file instead of just 20 books
- Get the tooltips working which shows the amount of books.
- Add transitions to the circles and be able to turn characters on and off.
- Show and remove characters.
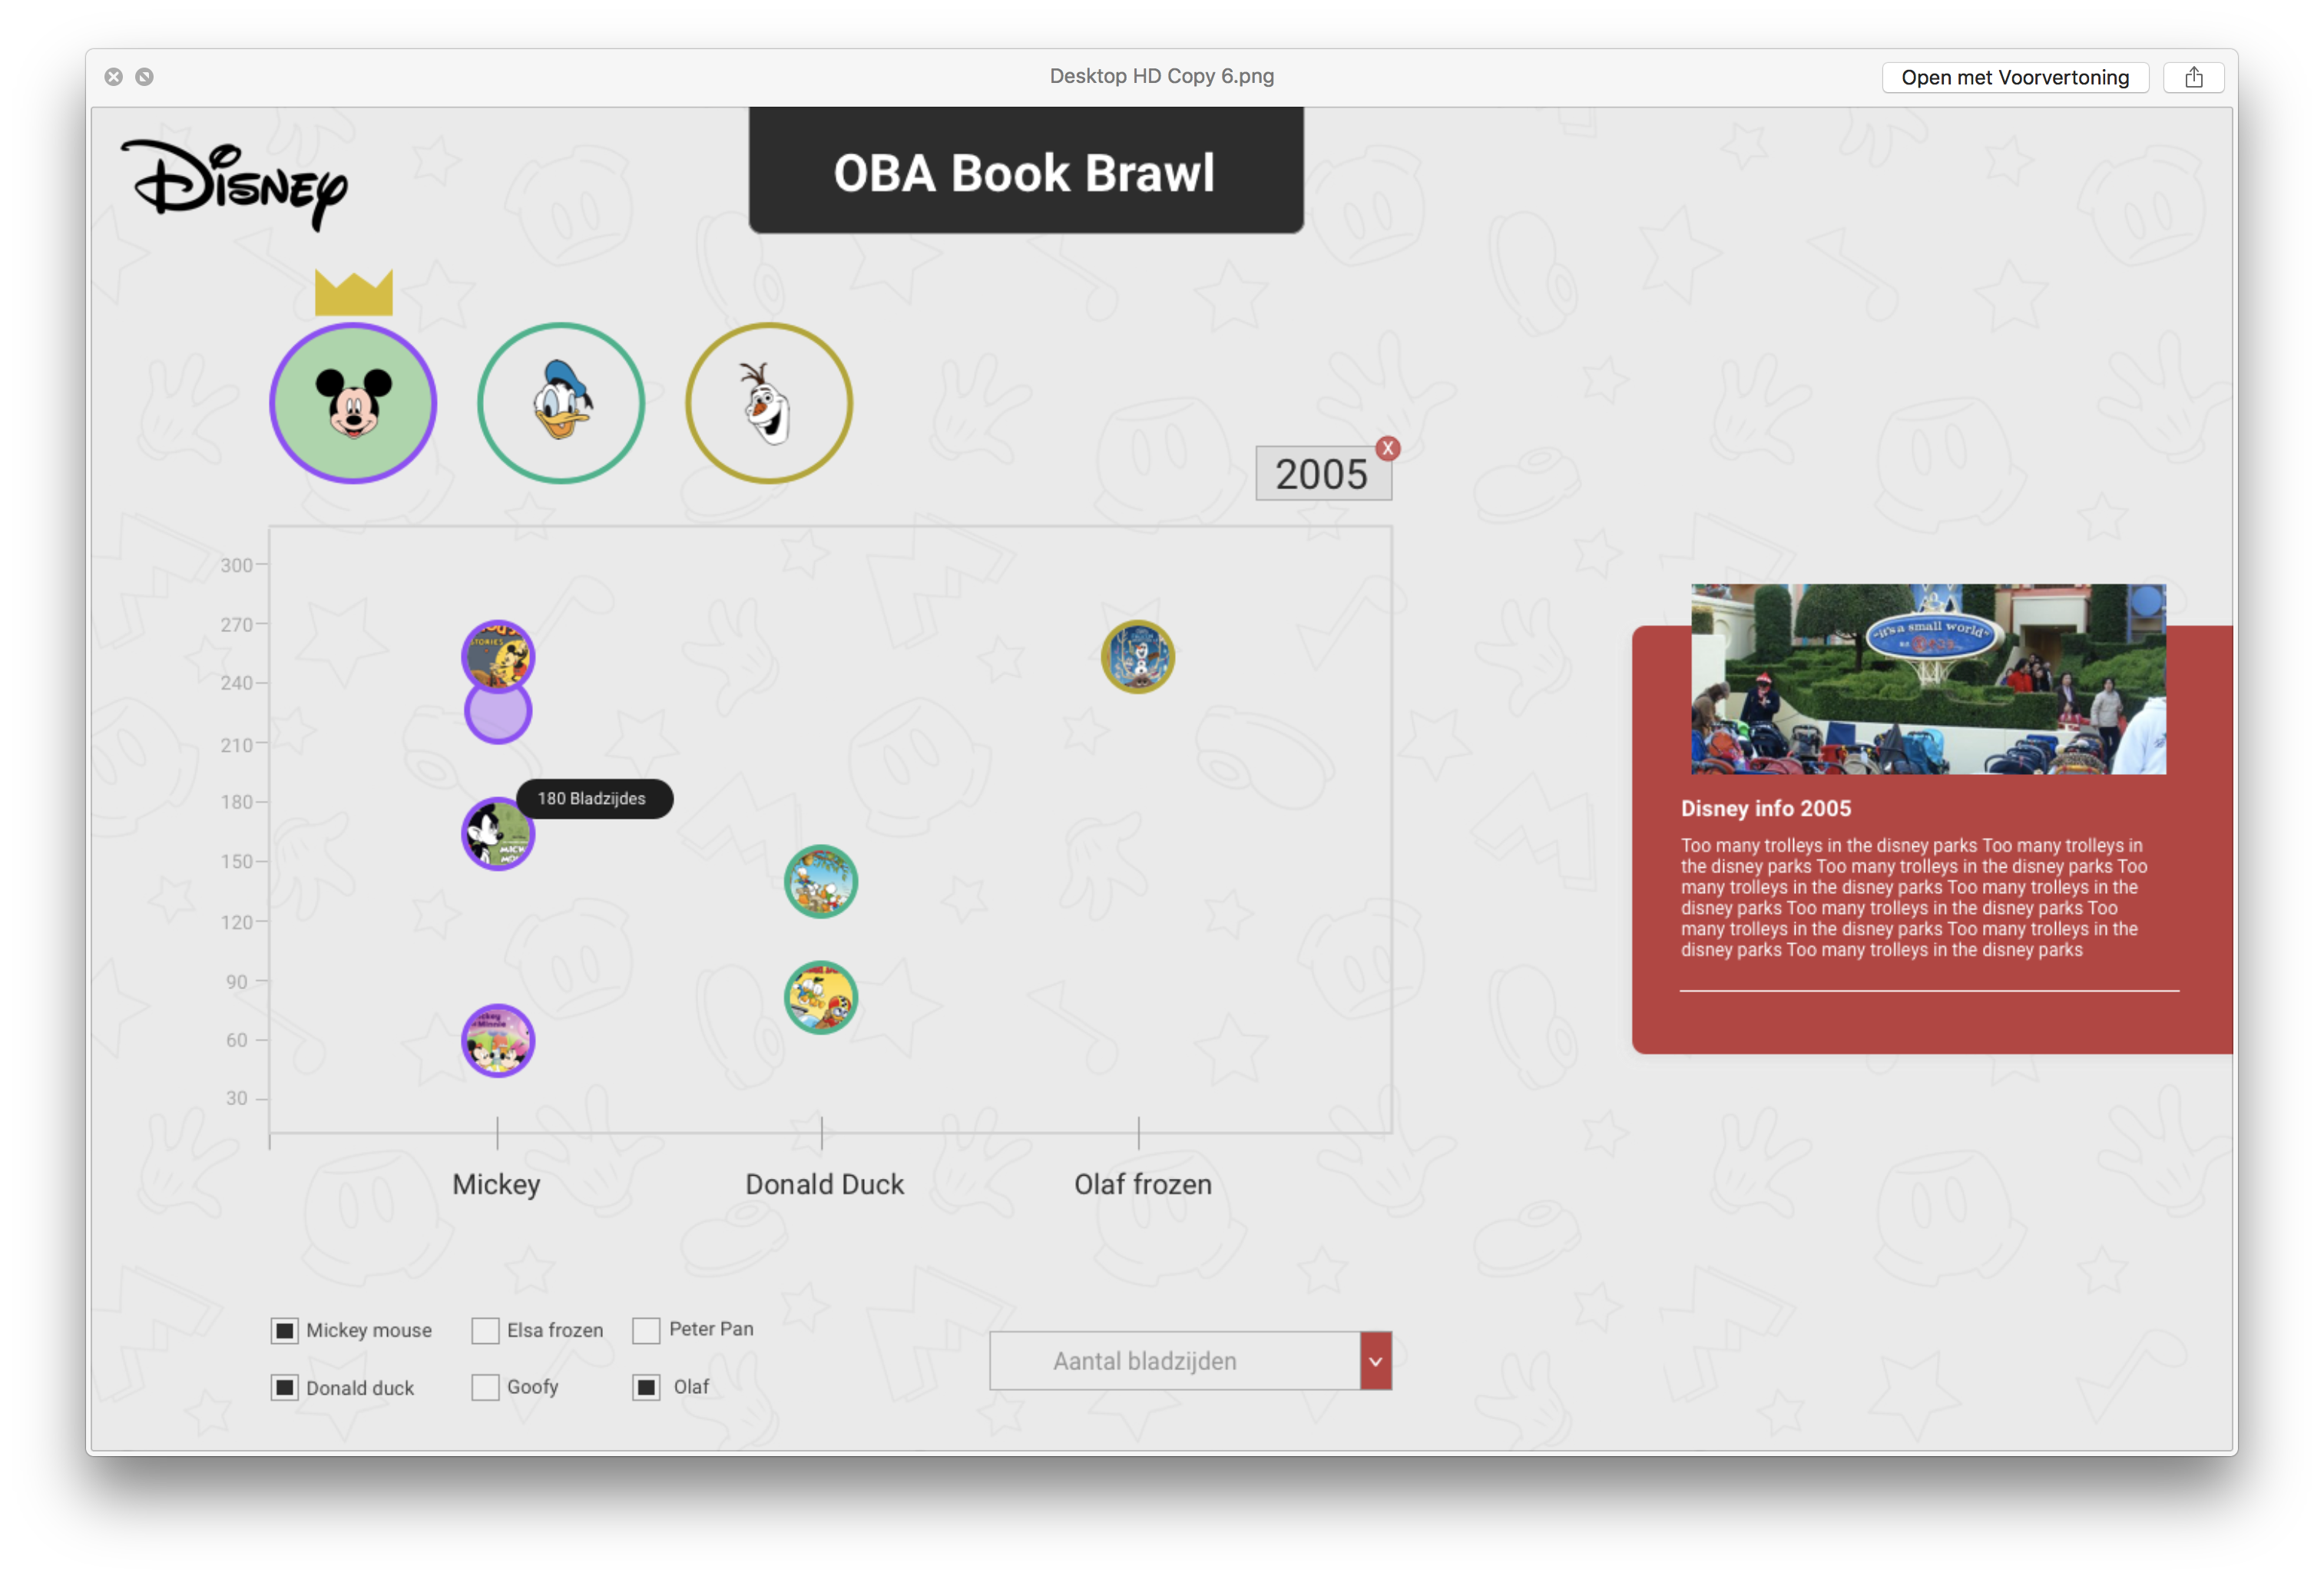
- Be able to plot books filtered by a specific year if that year is selected.
- Get used to d3.nest() function
- Make the X axis show the names of the characters.
- Plot the circles on the yaxis on the height of the pagecount and add the book cover to the background of the circles.
- Add disney data to the visual if a specific year is selected.
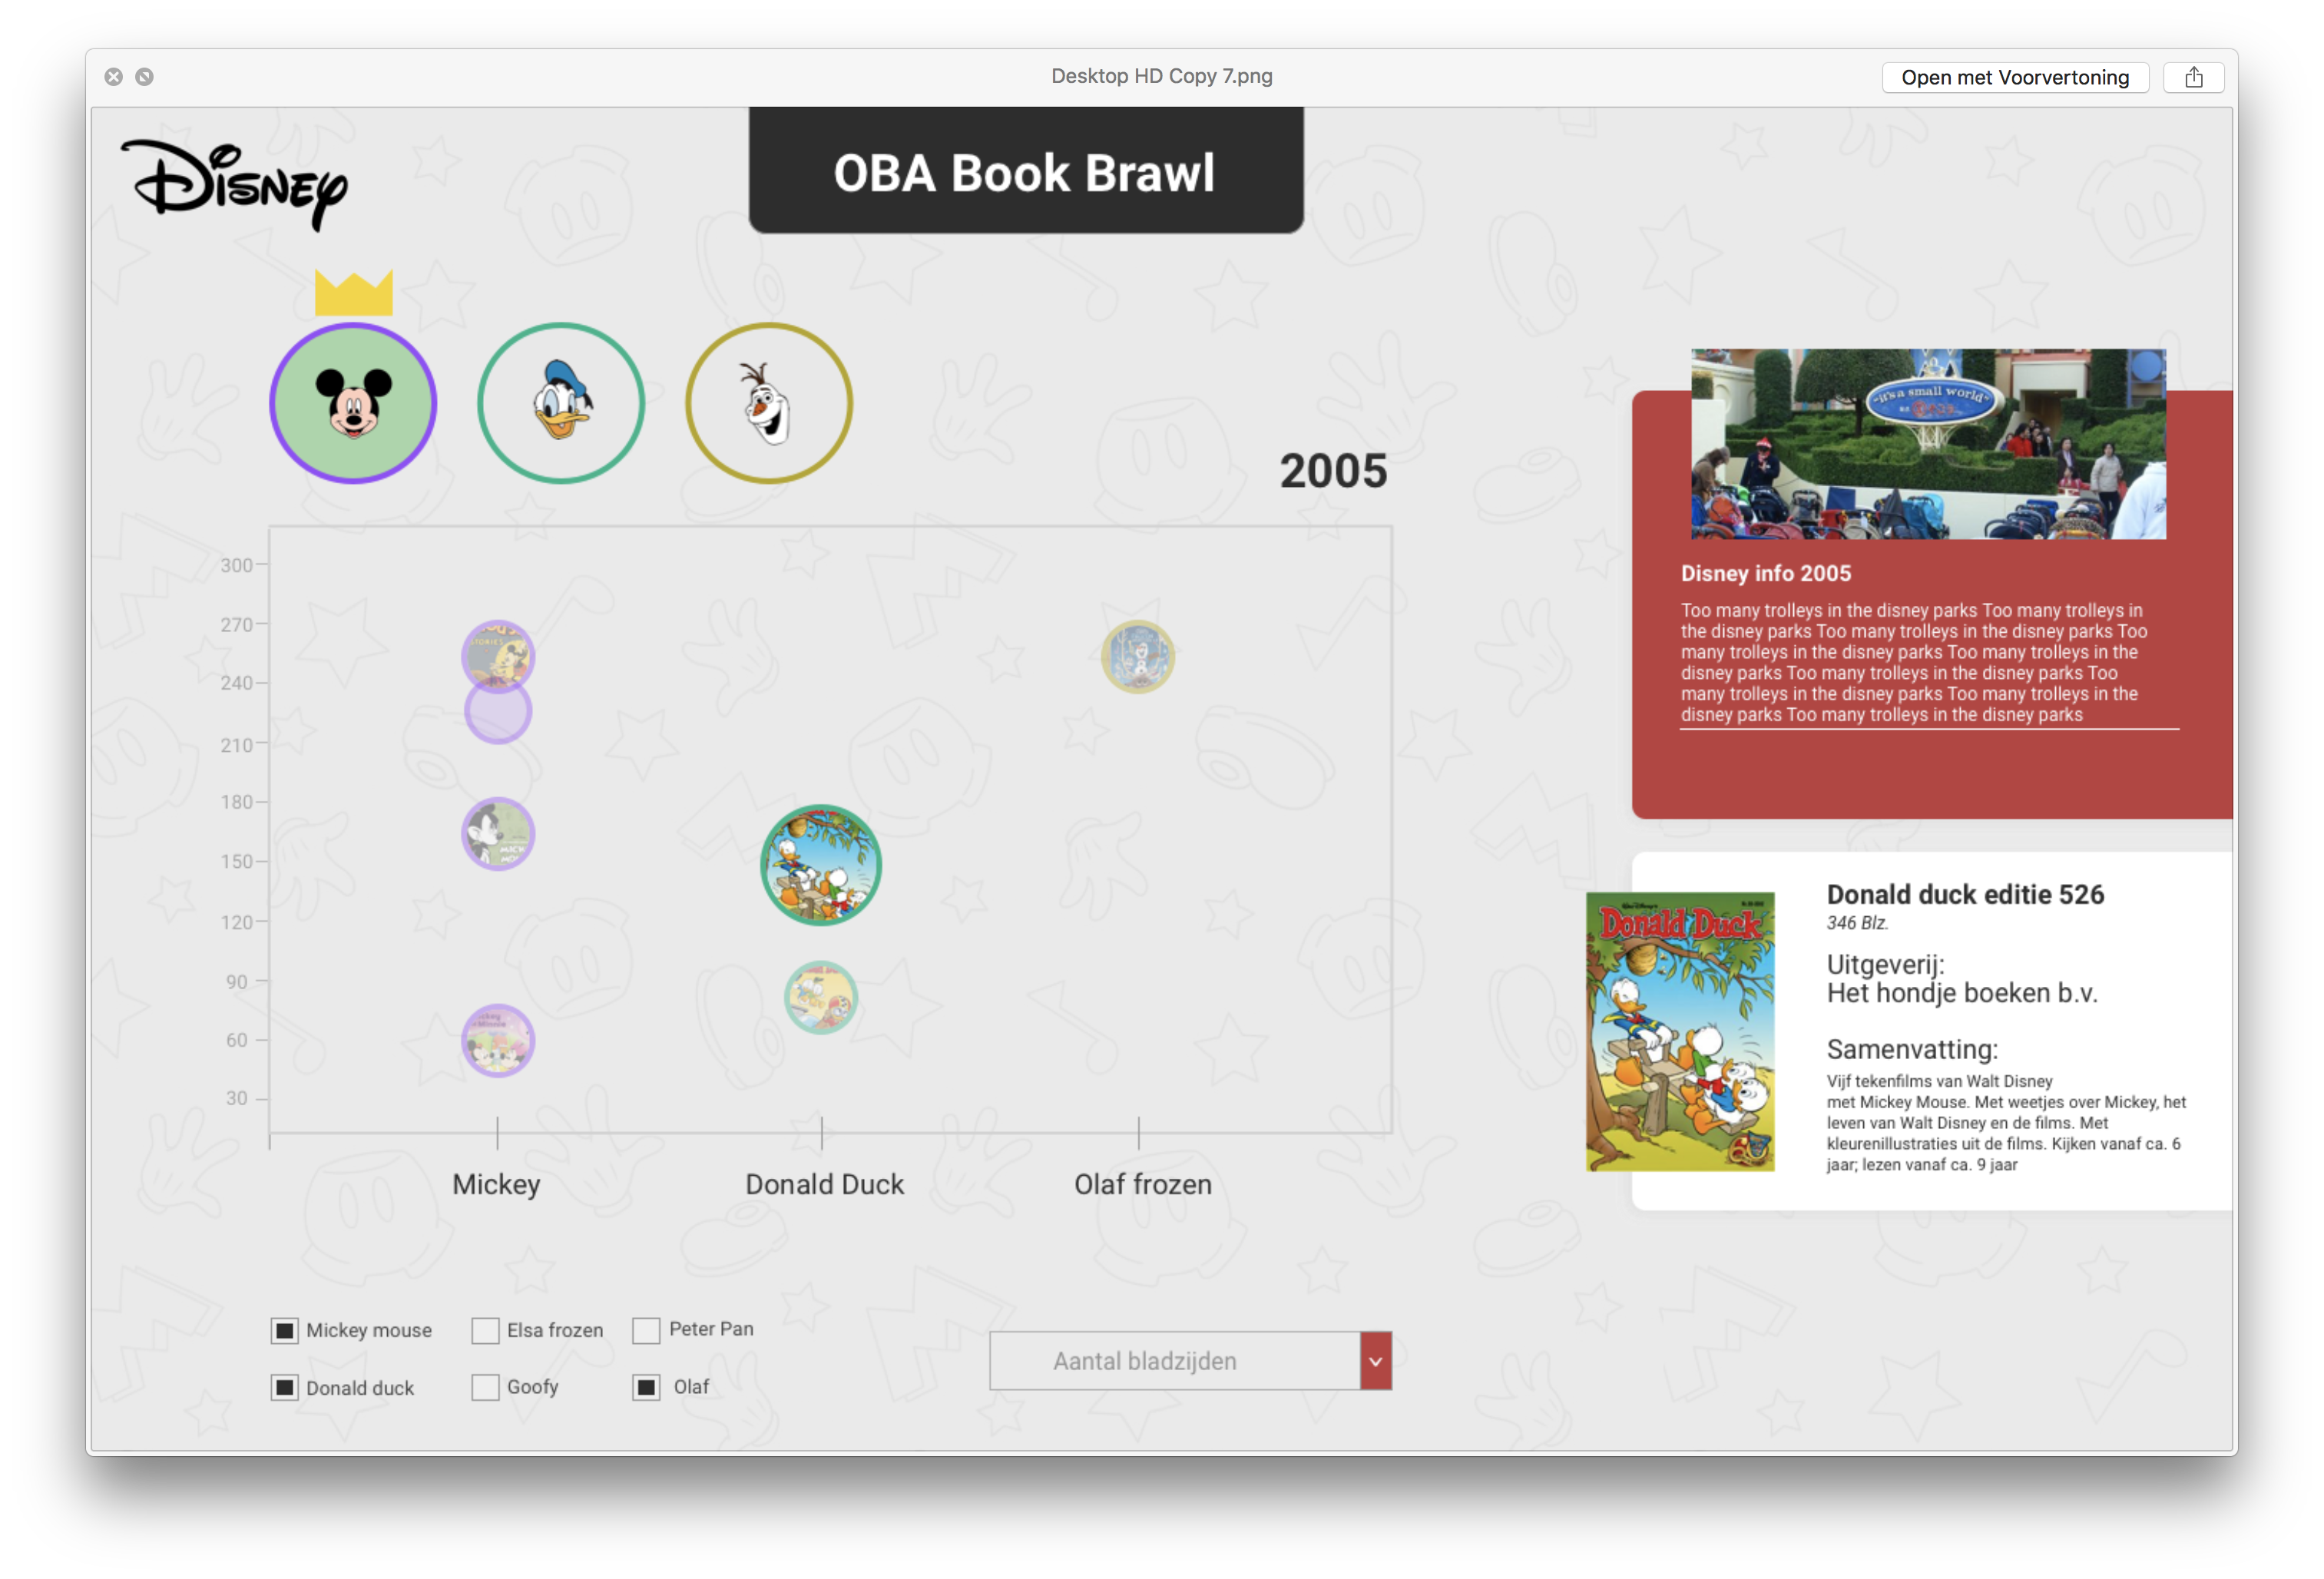
- Be able to show all book data when clicking on a circle at a specific year.
- At more styling to the webpage so it looks more like the design.
Daniel's cheatsheet to find out about all data querys in the API
Used for inspiration and first setup
Youtube Tutorial to find out more about nesting Data
Used to get to know more about d3 transitions
The code that was made by Folkert and Dennis have been commented in the d3.js file
Special thanks to the two geniuses that helped me with some of my code which were really important to make the visualisation work.
Folkert-jan a.k.a Follywolly
Dennis Wegereef a.k.a ikeacloset