MapboxGL js part 2
The link style: 'mapbox://styles/nieneb/cjg3h8yp80oi82rldxukpu0oi', contains everything what is needed to show the vector tile map:
- The vector tile source.
- The styling information.
- Fonts and Glyphs
Mapbox Studio's style editor provides the user interface where you can define your map style. Behind the scenes, Studio creates the style.json and hosts it on the Mapbox Styles API when published. This style is then accessible via endpoint to add to your map.
If we use the Mapbox hosting we need an access token. But we can also generate and host this all ourselves! We can do this by making using our own data and making our own style.json file.
The style definition is most commonly supplied in a JSON format. 🔗 Mapbox provides good documentation on the style specifications
Here we will learn how to make our own style object in JavaScript.
The map style itself is written as rules which define its visual appearance using the Mapbox GL Style Specification. It specifies:
- What data to draw: Sources
- What order to draw the data in: Layers
- How to style the data when drawing it: Layers
- Which fonts and icons to use: Glyphs & Fonts, Sprites & Icons
This is the basics of a style:
var mystyle = {
    "version": 8,
    "name": "Mijn eigen Stijl",
    "sources": {...},
    "layers": [...]
}main.js file.
The 2 most important for now are the sources and the layers. The sources tell us where our data is coming from. Vector Tiles or GeoJSON data for example. By setting layers we can style every separate layer available in the vector tiles and assigning it colours etc.
In order to use this we need to create a style object in JavaScript and add it to the map definition, instead of the mapbox url. We can also remove the access token now.
var map = new mapboxgl.Map({
        container: 'map',
        style: mystyle,
        hash: true,
        zoom: 11,
        pitch: 60,
        bearing: 62.4,
        center: [ 4.8, 52.4]
});For now we start with 1 source, namely our vector tiles that are hosted by PDOK:
"sources": {
    "pdok":{
        "type": "vector",
        "tiles":  ["http://geodata.nationaalgeoregister.nl/beta/topotiles/{z}/{x}/{y}.pbf"]
    }
},
style object.
ℹ️ The source name we give to it is pdok
ℹ️ The type of source is vector and the url to the tiles is given.
Next we can create layers, accordingly on what layers are available in the vector data. The first layer is a background layer with the background fill color white. Then we call a admin layer which is available in the vector tiles. We apply a filter to the layer in order to get only the province boundaries.
"layers":[
        {
            "id":  "background",
            "type": "background",
            "paint": {
                "background-color":"#FFFFFF"
                }
        },
        {
            "id": "admin",
            "type": "fill",
            "source": "pdok",
            "source-layer": "admin",
            "maxzoom": 22,
            "minzoom": 0,
            "filter": ["==", "lod1", "province"],
            "paint": {
                "fill-color" :"#54D8CC",
                "fill-outline-color": "#ffffff"
            }
        }
    ]
layers to your style object.
ℹ️ The "id" is a custom name you give to the layer. You can give it any name you like.
ℹ️ The "source" is the name of the source provided in the beginning of the style object. We called it "pdok".
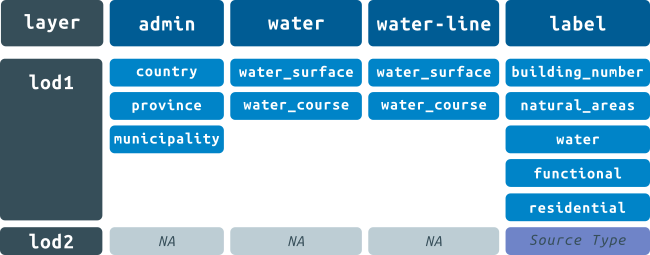
ℹ️ The "source-layer" is the name of the data layer in the vector tiles. This information is fixed. We provided all the names of the layers for you already. A bit further on we will explain how you can request the vector tile information.
ℹ️ "type" is the rendering type of the layer. It can be one of fill, line, symbol, circle, fill-extrusion, raster or background.
ℹ️ "paint" Default paint properties for this layer.
There are more options you can give to a layer. For example:
- filter
- minzoom
- maxzoom
We can go on and on with adding layers.

We can add multiple sources to our style spec. Let's add some points from the GeoJSON.
main.js make a GeoJSON object
// Make a GEOJSON
var wurjson = {
    "type": "FeatureCollection",
    "name": "15yrMGI",
    "crs": { "type": "name", "properties": { "name": "urn:ogc:def:crs:OGC:1.3:CRS84" } },
    "features": [
        { "type": "Feature", "properties": { "fid": 0, "height": 60 }, "geometry": { "type": "Point", "coordinates": [5.66647, 51.98514] } },
        { "type": "Feature", "properties": { "fid": 1, "height": 45 }, "geometry": { "type": "Point", "coordinates": [5.66801, 51.9864] } },
        { "type": "Feature", "properties": { "fid": 2, "height": 100 }, "geometry": { "type": "Point", "coordinates": [5.66361, 51.98531] } },
        { "type": "Feature", "properties": { "fid": 3, "height": 30 }, "geometry": { "type": "Polygon", "coordinates": [[[5.66554, 51.98675], [5.66832, 51.9875], [5.66778, 51.98825], [5.66602, 51.98779], [5.66591, 51.98784], [5.66501, 51.98758], [5.66498, 51.98753], [5.66554, 51.98675]]] } }
    ]
};We can add extra Sources and Layers to the map, after the style is loaded.
// On Load add GeoJSON SOURCE and LAYER
map.on('load', function (e) {
    // ADD GEOJSON SOURCE
    map.addSource('punten', {
        'type': 'geojson',
        'data': wurjson
    });
    // ADD an extra layer
    map.addLayer({
        'id': 'geojson-points',
        'type': 'circle',
        'source': 'punten',
        'layout': {},
        'paint': {
            'circle-color': '#000fff',
            'circle-radius': 10
        }
    });
});map.on('load, function(){}) in your main.js file to add the GeoJSON object.
ℹ️ with map.addSource we add an extra source to the map.
ℹ️ map.addLayer adds an extra layer to the map, on top off the map.
🔗 Read about GeoJSON format here
Change your map settings so you get a nice view. Change colors, add extrusions and layers. Also see if you can use filters.
🔗 Make use of the Mapbox style spec: https://www.mapbox.com/mapbox-gl-js/style-spec/
🔗 Mapbox also provides a lot of examples: https://www.mapbox.com/mapbox-gl-js/example/simple-map/
🔗 and use the PDOK Vector Tile documentation on how the vector tile set is build up.
🔗 Use and copy some inspiration from this complete style.json
For inspiration: :link: Have a look at https://www.mapbox.com/resources/guide-to-map-design-part-1.pdf
- The order of the layers in your
styleis the order of drawing. So first defined layer, "background", is drawn first, the next layer is drawn on top, etc. - The labels placing priority is also dependend on the layer order. Layers at the top have less drawing priority, layers at the bottom of the file have more drawing priority!
- Is your map slow? Check out 🔗 Improve the performance of your MapboxGL map
- Using a lot a fill-extrusions will also make your map slow.

In MapboxGL js part 3 we give you more information about the possibilities of styling the map and interaction on the map
- Adding multiple sources
- Fill-extrusion
- Interaction
- WebGL support
- Glyphs & Fonts
- Sprites & Icons
➡️ Go to the next step MapboxGL js part 3 for more advanced mapping!
➡️ When you are happy with your map go put it online with hosting on github!