Code used to generate the Research synthesis figures.
- MATLAB (R2017 and on)
- This repository (add all folders and subfolders to your MATLAB path)
- The npy-matlab repository
- The Allen Mouse Brain Atlas volume and annotations
- For Python code:
Update the paths to the table and meshes in the python scripts to point where you downloaded the files.
- For Matlab code:
After adding all folders and subfolders to your MATLAB path. Update the paths to the table in the matlab scripts to point where you downloaded the files.
The database used to perform our research synthesis is available as a table. This table has the following columns: the year of the study, the short publication reference, the PFC region name used in the original publication, the inactivation method used, the stereotaxic triplet provided in the original article. The averaged coordinates used for the 3D plot into the Allen reference Atlas (ARA) CCFv3, the correction applied to the DV value to translate it into the ARA (see also below), the 3 scores; complexity index, sensory modality and task type, obtained for every publication, 7 logical values (in MOs, in ACA, in PL, in ILA, in ORBm, in ORBvl and in ORBl) indicating in which PFC region the study is found when plotted into the ARA CCFv3 with our method and the name of the Allen PFC region containing the stereotaxic triplet provided in the original publication. The full database table can be downloaded in the following link:
The primary sensory modality utilized in the studies was simply reported as a score from 1 to 6; auditory (1), visual (2), somatosensory (3), olfactory (4), gustatory (5) or multisensory (combination of two or more modalities; 6), respectively. The task type in the studies was also reported with a score from 1 to 3; sensorimotor transformation (1), context/rule (2), or memory/delay (3), respectively. A complexity index (ranging from 1 to 10) was calculated for each study. The behavioral task in each study was scored according to eight criteria: number of stimuli, complexity of the stimuli (0, 1, or 2), number of actions to perform, complexity of the action to perform (0, 1, or 2), presence of a cue indicating the beginning of a trial (0 or 1), presence of a delay between task events (0 or 1), presence of a short- or long-term memory component (0 or 1), freely moving (1) or head-fixed (0) task. The full table can be downloaded in the following link:
Download the details of the complexity index
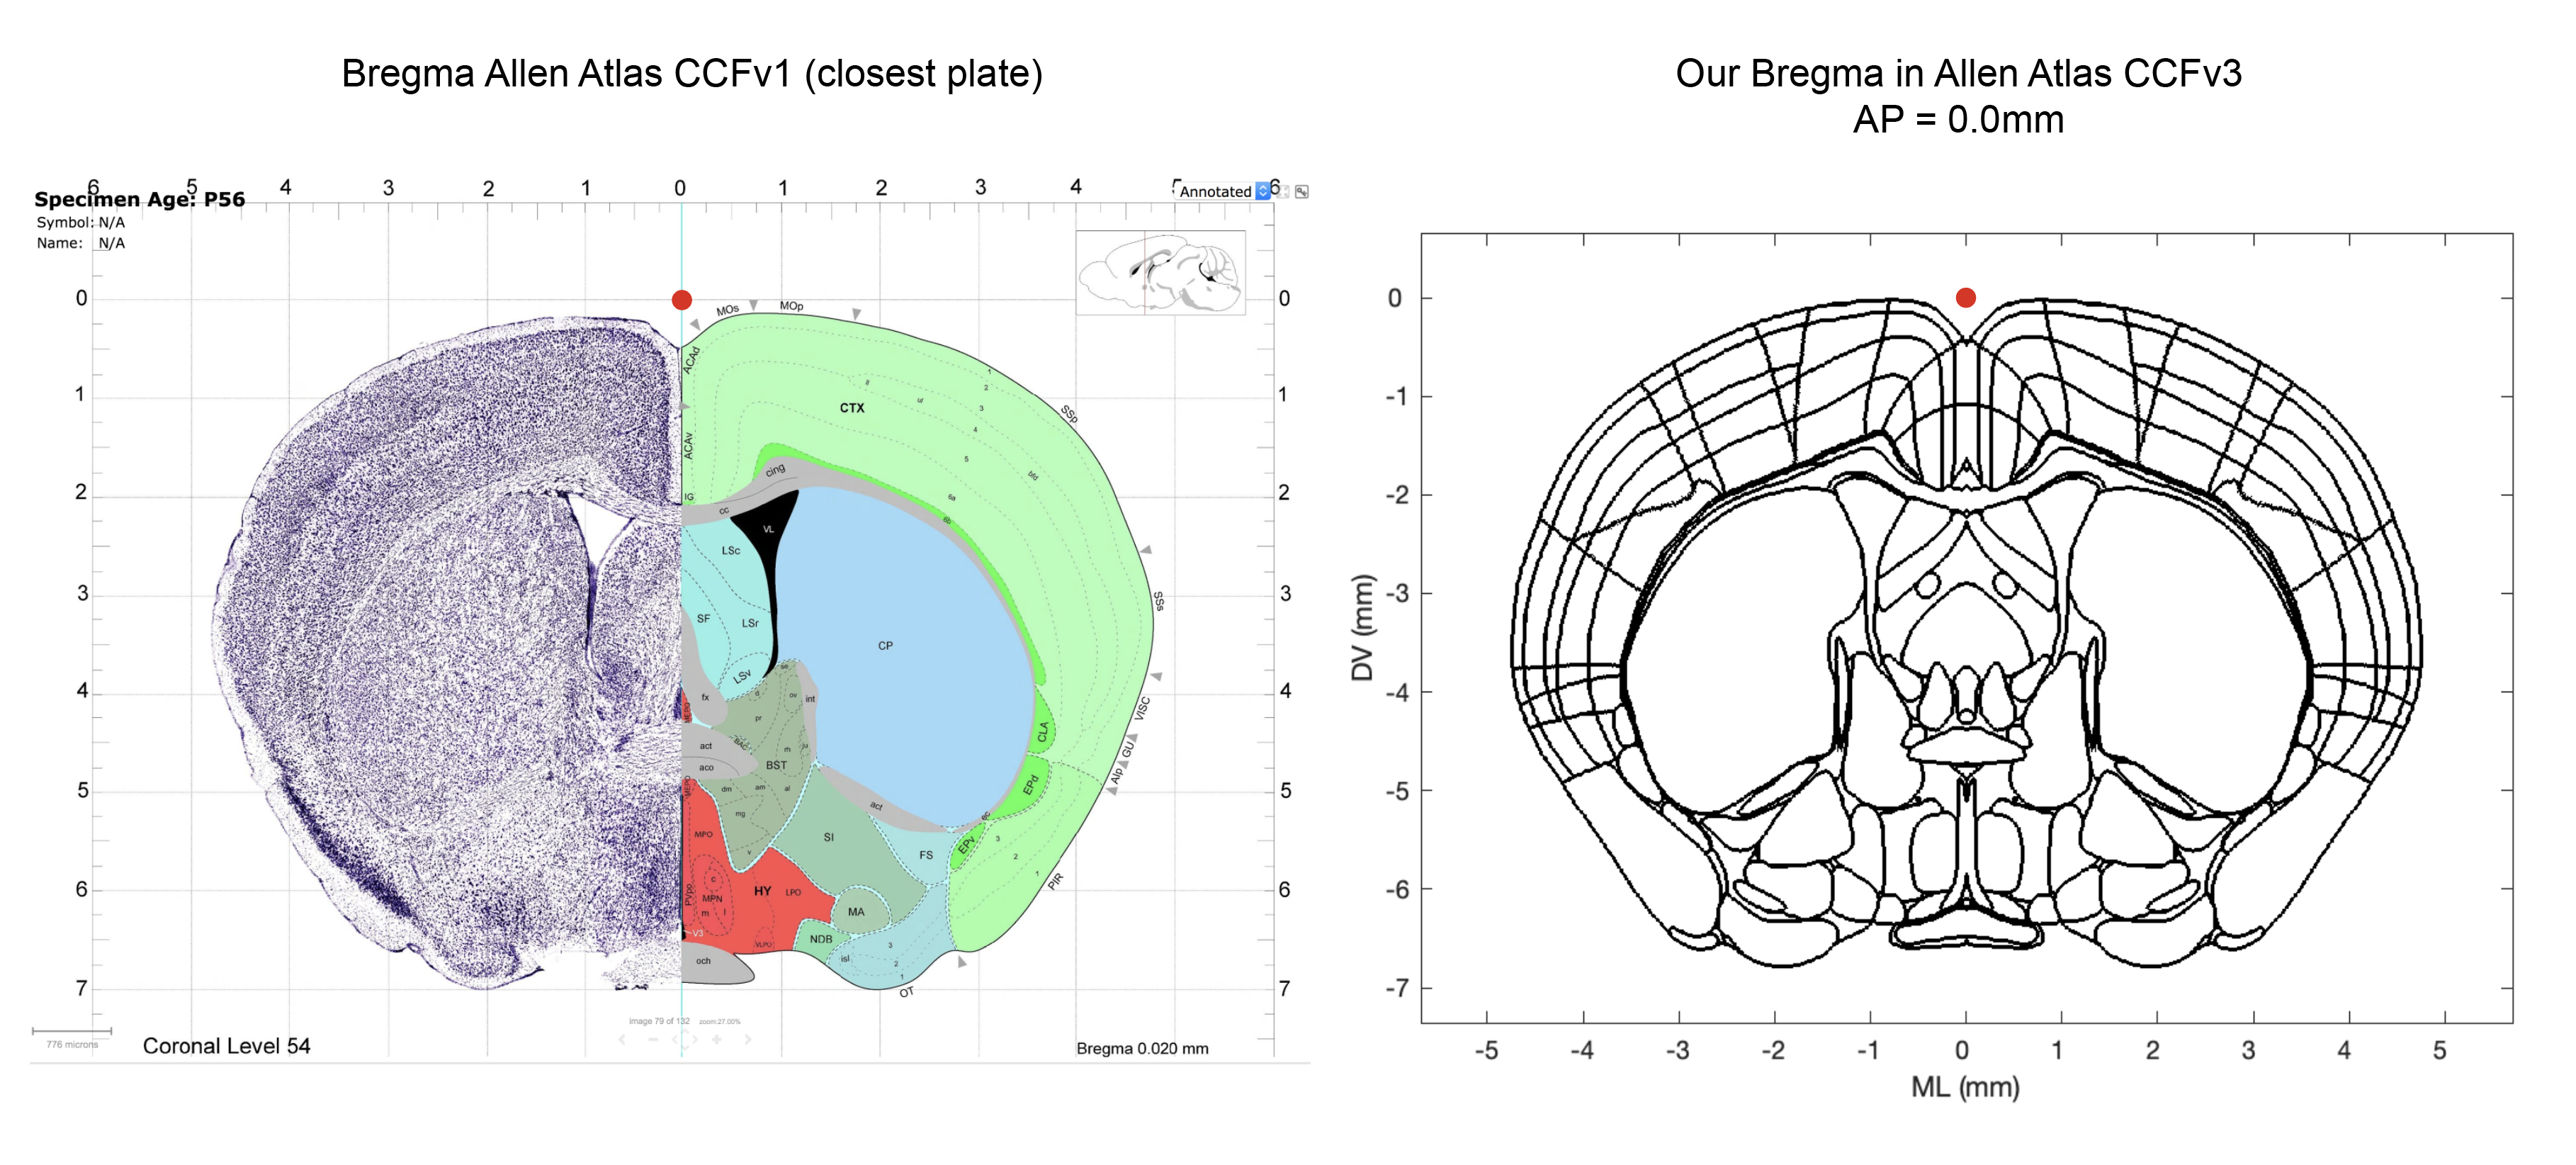
The Allen Institute explicitly state that they do not have a definition for Bregma for the ~1600 adult mouse brains used to construct the CCFv3: “Each one of those brains was dissected from a skull, and every skull has a slightly different Bregma location; hence the CCF does not have a single brain-in-skull as a source (which would have a corresponding Bregma coordinate), but is made from brains out-of-skull that have been registered to achieve an ‘average’ volume that is defined by the brain itself, ex cranio. “ (source here). Therefore we had to place Bregma ourselves in the CCFv3. We placed Bregma based on the information available in the first version (CCFv1) of the ARA and how others labs have placed it (see the great Github repo of the Cortex lab from where we derived our scripts). Below, you can appreciate graphically where we place Bregma in the CCFv3. The matlab script “AllenCCFBregma.m” is carefully commented in regards to our coordinate triplet to provide transparency and reproducibility for other users.
Experimenters report the Bregma DV coordinate either relative to Brain surface or relative to Bregma 0 (skull landmark). In the Table1-Database we performed DV corrections to obtain the DV coordinate into the CCFv3. When Bregma was reported from the brain surface, we performed a correction with the matlab script “Bregma_DV_correction.mat”. This script plots the contours of the coronal section for the AP and ML coordinates provided in the referenced publication and finds the distance between the brain surface and the CCFv3 Bregma. This value needs to be added to the mean DV value provided in the original publication: column "Brain surface DV Corr" in Table1-Database. When Bregma was reported from Bregma 0 (skull landmark) no correction is needed.

The CCFv3 version of the Allen Atlas is a 10um voxel resolution space and our analysis using this Atlas has some limitations. We generated 3D meshes for the brain outline, for each PFC region (MOs, ACA, PL, ILA, ORBm, ORBvl and ORBl) and for the PFC sudivisions described in the section of our Perspective "Parcellations of the PFC" (dmPFC, vmPFC and vlPFC) by using the MATLAB "isosurface.m" function (see folder Brain_meshes). To detect in which Allen PFC region each publication was peformed we used the "inpolyhedron.m" function (Copyright © 2015, Sven Holcombe). The thickness of the borders in the actual version of the CCFv3 is around 30um (3 voxels). As a result some triplet of coordinates are allocated to 2 regions while performing our “inpolyhedron.m” detection procedure. We inspected manually each triplet of coordinates whithin its respective ARA plate (see folder AllenAtlasLocationCCFv3_individualstudies) and visually assesed for these ambiguous cases to which Allen PFC region they belong to. Our level of incertitude regarding PFC region assignment needs to be put into perspective because, as accurate as we can be as experimenters, the provided stereotaxic coordinates in every publication are only averaged values reflecting the mean location of the targetted brain structures. This experimental incertitude is by itself an important limitation of our analysis and needs to be taken into consideration.
© 2015 Allen Institute for Brain Science. Allen Mouse Brain Atlas (2015) with region annotations (2017).