In this repository you can find how to create a dot plot using Python and Seaborn package. Dot plots are not included in Seaborn, but you can use a little tweak to the scatterplot and convert it with few simple steps.
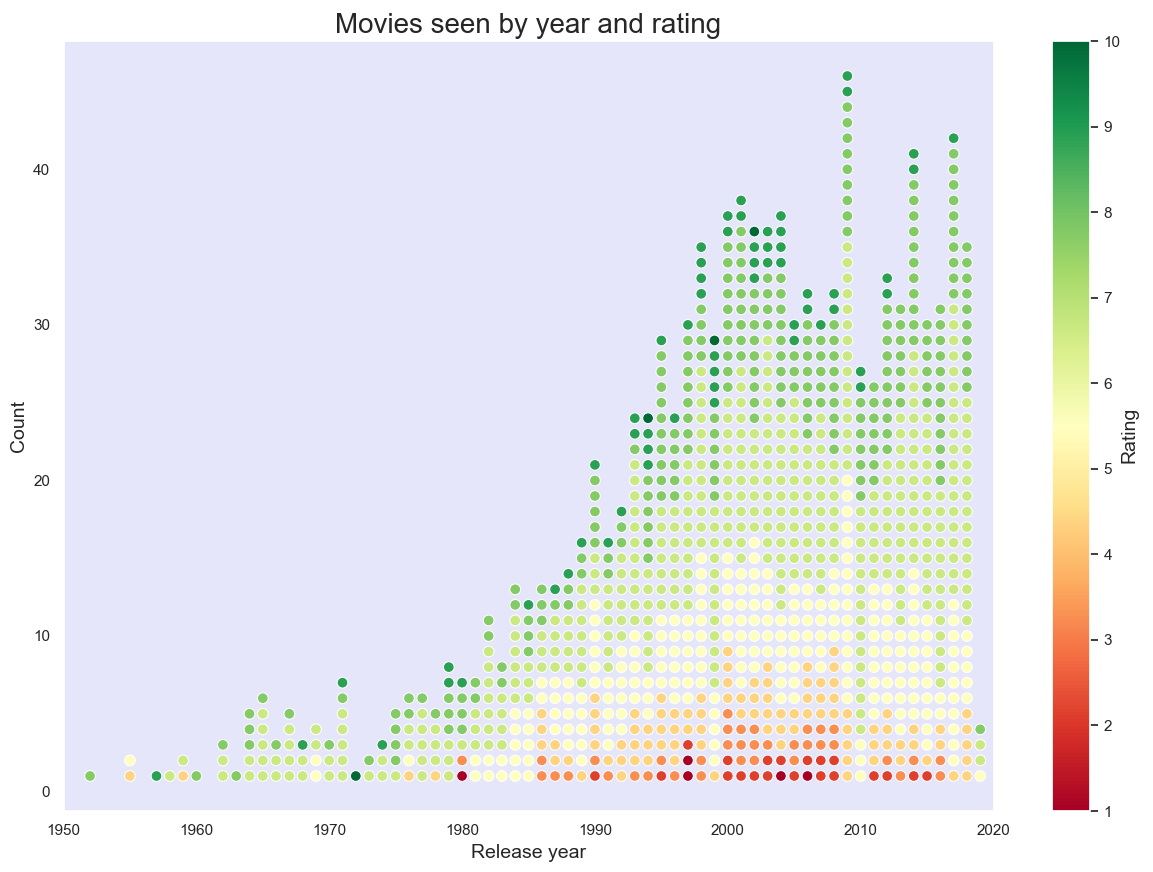
If you are interested just in the code, you should check the Python script used to create a dot plot of movies I watched sorted by release year and rating. Raw dataset will help you recreate my findings.
You should also read this Jupyter notebook, which explains how the loop let to convert scatterplot to a dot plot.
Here is the final chart: