Chrome Dev-Tools error? #389
Comments
|
i got the same ERROR with ELECTRON 1.7.X. |
|
This is not a specific issue to electron-vue. If you need further help please reach out to |
|
I had simliar issue
with yarn (1.2.0) surprisingly, with npm install && npm run dev, everything works fine (^^??) |
|
@olafahn and @emjimadhu I get same issue here using npm, does not update and this error message appears in the terminal. Does anyone know why? The terminal error ┏ Electron ------------------- Tell me about your development environment.
UPDATE |
|
anyone brought this up on yarn yet? |
|
+1 |
|
+1 UPDATE |
|
I am getting the same error has no execution c ontext", source: chrome-devtools://devtools/bundled/inspector.js (7323) |
|
+1, happens regardless of npm / yarn. |
|
same happen here...
|
|
Estoy con el mismo problema |
|
Same here |
|
Same issue, fix required |
|
Same issue :/ [3480:0819/161535.280:ERROR:CONSOLE(7323)] "Extension server error: Operation failed: : has no execution context", source: chrome-devtools://devtools/bundled/inspector.js (7323)
|
|
Any news about this issue yet? |
|
I had the same error, I didn't setup the port properly on |
|
Is this an issue with the template, or with individual projects and / or machines? If someone has a reproducible error please create a separate issue with the code or steps to reproduce. So far this doesn't seem directly related to the template. At this point it would be better to open a new issue with with a reproducible error and then referencing this issue. This issue was originally created a year ago, and we've since updated a large portion of this template (including moving to webpack 4), so any new errors with the template should be a separate issue. Thanks |
|
For now, I just forced the firebase downgrade to version 4.6.2. It seems to work for now. It may be a big technical debt, but it works. |
|
Same issue, but this issue has been closed for over a year, so... |
|
I think I found a workaround. It seems to be a temporary issue. |
|
I had the same issue, my workaround was: In main/index.dev.js: In renderer/main.js: I read somewhere about a similar issue but looking now I can't seem to find the source. In any case, it has something to due with the dom not being ready when Based on that my new work around is: In main/index.dev.js: In main/index.js: We could also bring main/index.dev.js up to date with the usage guidelines: https://github.com/MarshallOfSound/electron-devtools-installer#usage |
|
Hello, I had the same error also, and resolved it by next way. I have updated electron manually to last version and all related modules and have downgraded node to version 10 from 11. |
|
Any news on this? |
|
I had these errors. Here, the #389 (comment) solution partially helped me. As written above, this error will probably occur when the DOM is not loaded and devtools are called. I use vuetify and I have a DOM boot error that also killed the system. So the DOM boot handler here might be superfluous. |
|
Leaving notes for the future, since I've fixed the place I encountered this: The root cause for me turned out to be a long-running / non-terminating function call inside of a To figure out where the problem was coming from, starting at the root component of the vue app and commenting out sets of components helped narrow it down to the one causing the issue. |
|
This is how I fixed it: + window.webContents.on('did-frame-finish-load', () => {
if (isDev) {
window.webContents.openDevTools();
window.webContents.on('devtools-opened', () => {
window.focus();
});
}
+ }); |
|
However I'm still having this issue, which I just can't fix:
|
@daniloprates Sorry which file and lines? |
@gurpal2000 where-ever you call You have to wrap it with the |
|
So, to summarize In main/index.dev.js: - require('electron-debug')({ showDevTools: true });
+ // NB: Don't open dev tools with this, it is causing the error
+ require('electron-debug')();In main/index.js in the createWindow() function: mainWindow.loadURL(winURL);
+ // Open dev tools initially when in development mode
+ if (process.env.NODE_ENV === "development") {
+ mainWindow.webContents.on("did-frame-finish-load", () => {
+ mainWindow.webContents.once("devtools-opened", () => {
+ mainWindow.focus();
+ });
+ mainWindow.webContents.openDevTools();
+ });
+ } |
|
@SimulatedGREG That seems fix the issue. Should I open a pull request? |
|
I've tried the method above and I'm still stuck with a frozen blank screen. |
@jaysaurus it's probably a different problem. The one mentioned here doesn't prevent the renderer process to run. |
|
My suspicion, after a lot of experimentation, is that this is a thread issue (in my case). It seemed to coincide with a lot of work ongoing between the renderer thread and the main thread. Ultimately, I had to switch to a different implementation because (though I got it working on-and-off by killing the cache, removing the dist folder and completely reinstalling the NPM components) things proved to be wildly unstable. I'm now using Quasar's implementation of vue-electron and it works really well. It's a pity because - on the whole - I prefer not to use a framework on top of a framework; and the Quasar implementation doesn't support vuex-electron right now. ho hum! |
|
@jaysaurus I think the screen goes white when there's a compilation issue, likely a mis-configuration in your main or renderer scripts, could try to add some debugging code or try / catch blocks to see where / when it is bugging out. I think this boilerplate should be used more as a chance to learn about the implementing vue with webpack and electron, it still works though, try my example adjustments above. |
|
Yeah, I tried a bunch of different things to no avail. My suspicion is we're talking a lower level issue related to a file IO issue being cached. My program makes a lot of reads of a very legacy hex file (i'm effectively reading a file as if it were being read by an old piece of hardware so there's pretty much no way around throttling the file IO). My educated guess would be that - given enough file IO and an interrupt from the renderer occuring when the main thread is occupied - you end up with some kind of soft lock where V8 doesn't know which task to prioritise. Ergo, IRQ stuff. This lock then gets cached all-over-the shop and the renderer falls over. thereafter, trying to run the file racks up 1.5gb of processing (probably Electron's equivalent of Java's xmx) and i get nothing more than a blank window. |
|
@stefnotch @SimulatedGREG what is the reason that no PR on the ground already based on @stefnotch's workaround, I think this issue bothered most of the newbies who want to use this awesome project at the very first day 😅 |
|
Upgrading |
|
Any update on this issue? |
|
Describe the issue / bug.
# the foloowing error was generated for
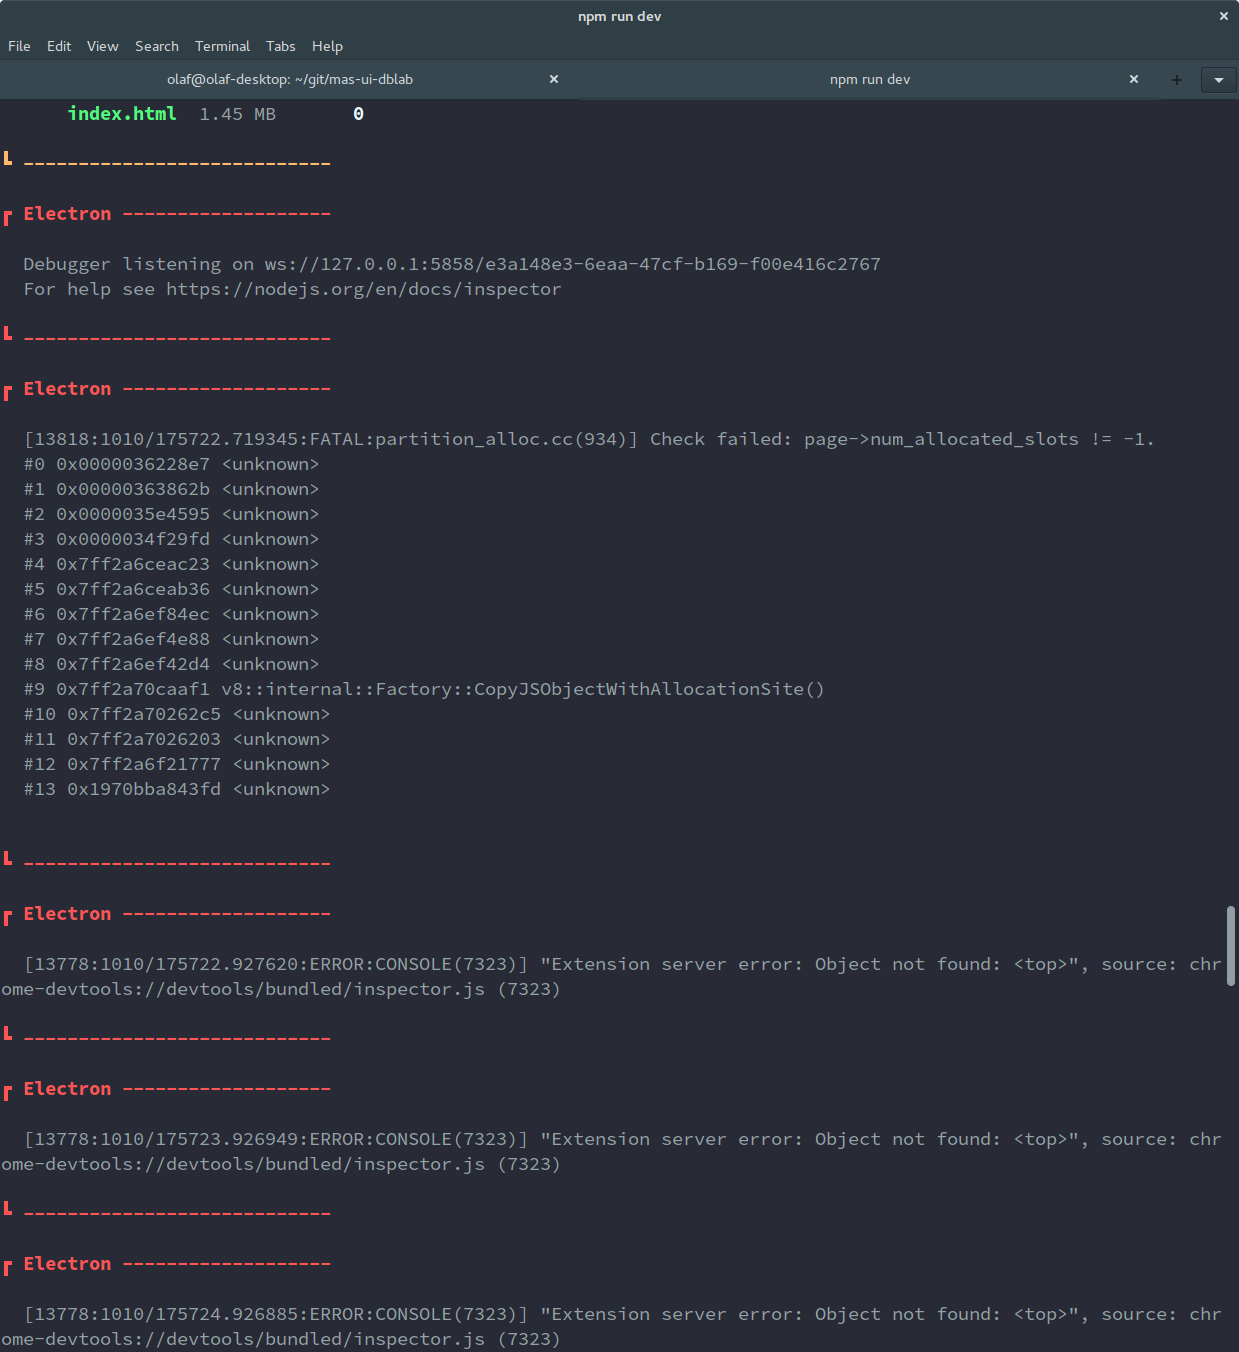
chrome dev-toolsDebugger listening on ws://127.0.0.1:5858/1b82eabb-e1e6-4815-ba86-ac09e1c88c9e For help see https://nodejs.org/en/docs/inspector[21394:0911/142528.962736:ERROR:CONSOLE(7323)] "Extension server error: Object not found: <top>", source: chrome-devtools://devtool s/bundled/inspector.js (7323)[21394:0911/142529.961727:ERROR:CONSOLE(7323)] "Extension server error: Object not found: <top>", source: chrome-devtools://devtool s/bundled/inspector.js (7323)[21394:0911/142530.391103:ERROR:CONSOLE(7323)] "Extension server error: Operation failed: http://localhost:9080/ has no execution c ontext", source: chrome-devtools://devtools/bundled/inspector.js (7323)Tell me about your development environment.
The text was updated successfully, but these errors were encountered: