Power Monitors

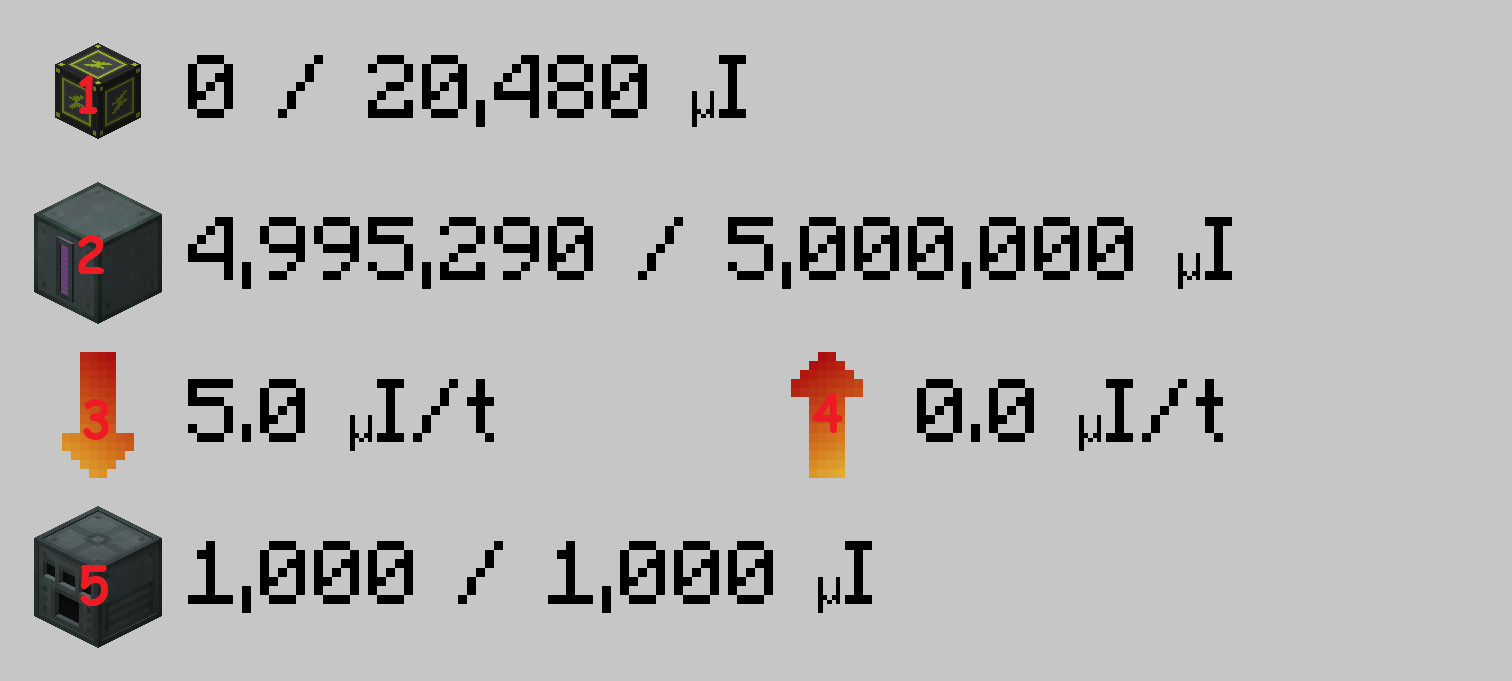
The Power Monitor is used to show statistics related to power on an attached Conduit Network. It must be touching an Ender IO Energy Conduit. You can see how much µI is stored in the Conduits (1), Capacitor Banks (2), and Machines (5) attached to the Conduit Network. You can also see separate input (3) and output (4) µI/t for the network.

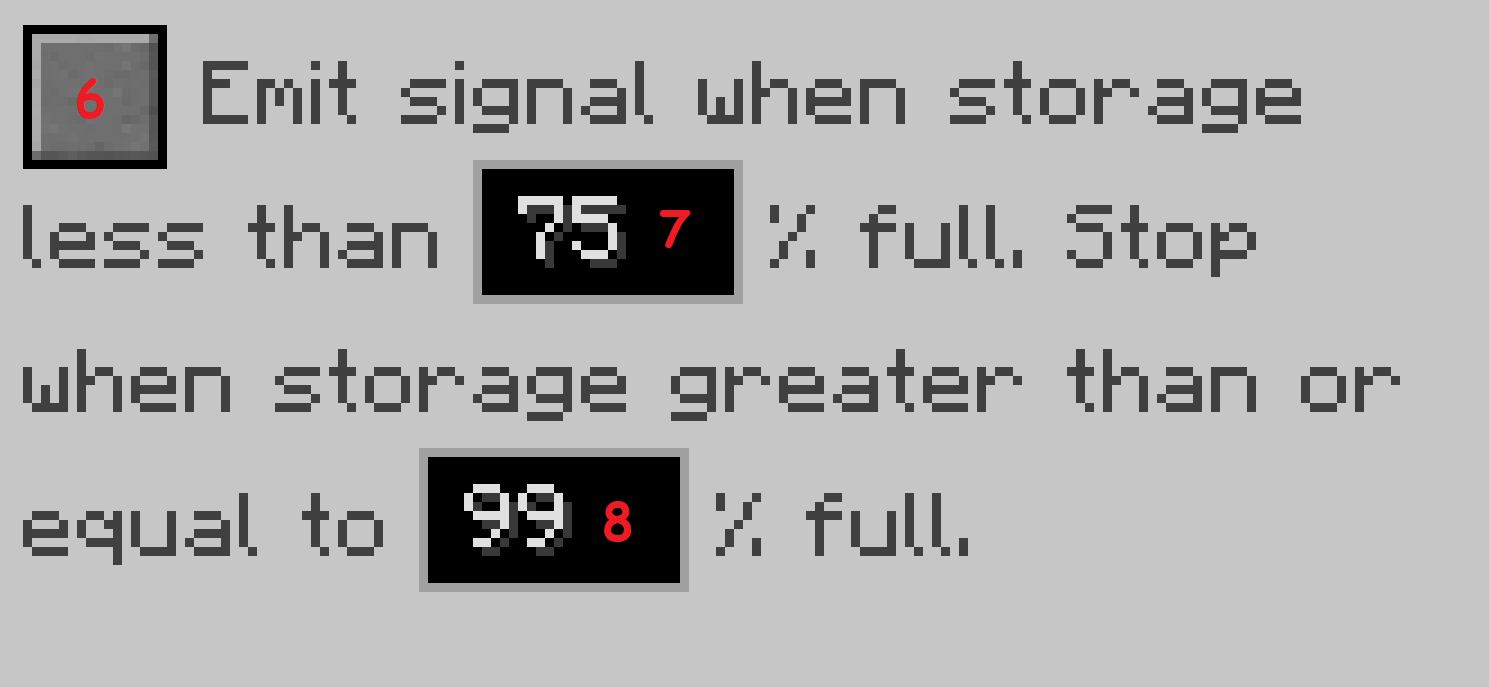
In addition, the Power Monitor features a redstone control system useful for controlling generators. When the amount of µI in storage (Capacitor Banks) drops below a certain value (7), the Power Monitor will emit a redstone signal. When the amount of µI in storage rises above another value (8), the redstone signal stops. Both of those values are configurable, and the system has to be enabled by clicking the tick box in the top left corner (6).
The Power Monitor consumes 5 µI/t and stores up to 1,000 µI.

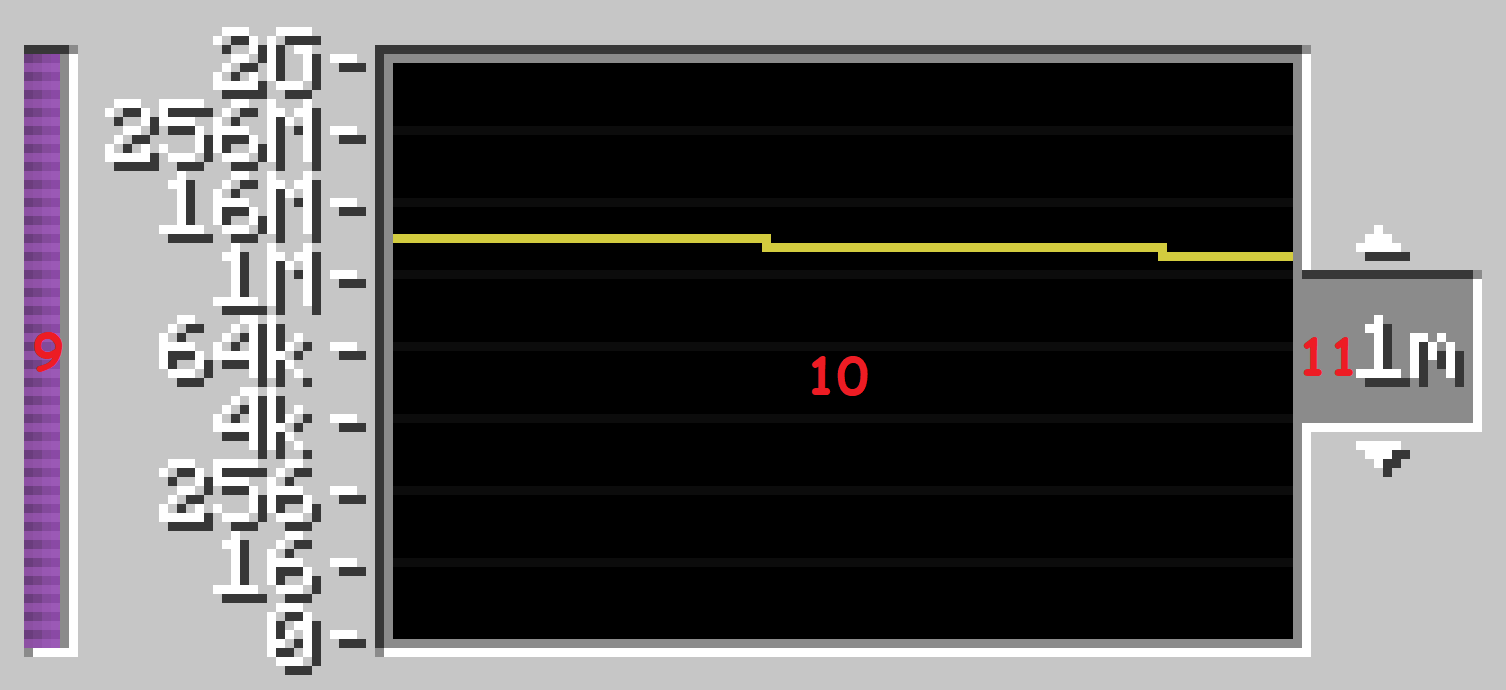
The Graphical Power Monitor includes all of the features of the normal Power Monitor, but also has a graph that shows the amount of µI in storage over time. This graph is rendered in the GUI (10), and on the front of the block. The time period described by the graph (11) can be set to different values: 10s, 1m, 10m, 1h, 10h, 24h, 7d.
The Graphical Power Monitor consumes 5 µI/t, and stores up to 1,000 µI/t (9).
This wiki is being rewritten from scratch, and mechanics may change during the mod's development. Currently, the information on this wiki is largely incomplete and may be out of date. If you want to make this wiki better, here are directions on how to Contribute to the wiki.
Energy (µI)
Alloys
Crafting Components
Dark Weapons, Tools, and Armor
Ender Weapons, Tools, and Armor
Dark Steel Upgrades
Enchantments
Simple Machines
Generators
Powered Machines
Unpowered Machines
Enhanced Machines
Obelisks
Conduits
Filters
Upgrades
Capacitor Banks
Facades
Power Monitors
Energy Gauge
Inventory Panel
Inventory Panel Remotes
Inventory System Storage
Inventory Sensor
Remote Awareness Upgrade
Alloys
Grinding Balls
Energy Conduits
Capacitors
Stellar Weapons, Tools, and Armor

