
The code can be executed on Python>=3.7, due to type specification, some code could raise exceptions on Python<=3.6.
As a good practice, generating a virtual environment is recommended (more info). A quick way to do it:
conda create -n <name_of_venv> python=3.7 # or any python>=3.7

# Activate
conda activate <name_of_venv>Note: Need version of Python of virtual environment to create installed
python -m venv <name_of_venv>
# In case you have installed Python v2
python3 -m venv <name_of_venv>

# Activate
# Windows
<name_of_venv>\Scripts\activate.bat
# Unix or MacOS
source <name_of_venv>/bin/activateUsing pip:
pip install -r requirements.txt
Note: data_mutations_extended.txt, file that contains the data extracted on mutated_genes.tsv and tml.tsv, is missing on this repository due to excessive size (0.98 GB). However, it can be downloaded from cBioPortal. Files used on this study are data_mutation_extended.txt, data_clinical_patient.txt and data_clinical_sample.txt.
Data (on training_data folder) was generated from data saved on raw_data. In case you want to regenerate, execute:
cd pipeline/01-Pre_processing
# Generates data/training_data/mutated_genes/*.tsv
python extract_mutation.py
# Generates data/training_data/clinical_data/clinical_data.tsv, not to be used
python clinical_data.py
# Generates data/training_data/clinical_data/encoded_clinical_data.tsv
python one_hot_encoding_clinical_data.py
# Generates merging between clinical data and mutated genes, data/training_data/merged_data/*.tsv
python merge_data.py
cd ../..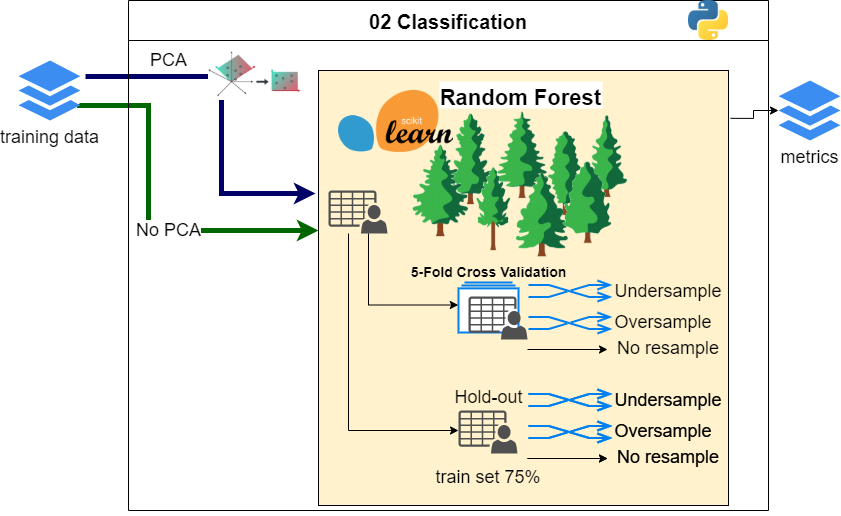
Whole classification is done in one script:
cd pipeline/02-Classification
python classify.py
# >> A long output
cd ../..
This generates the whole metrics folder. The output is saved in classify.out. The specification and parameters are on config.py file. Seed was fixes arbitrarily to make experiments reproducible.

To compare training data used on model, first, we need to summarize all obtained metrics. In order to do this, execute:
cd pipeline/03-Meta_Analysis
python process_results.py
# Generates data/meta_data/metrics.tsv
Two type of graphs are generating to compare the different data used to train the model. The first one is to compare F1-score of the M1 label (cancer has been found to have spread to distant organs or tissues*). The second one is to compare precision and recall of the same label (M1).
First type of chart is generated with the script:
python f1_score_plot.pyThis generate 4 plot:
| PCA | Model Validation | 5-Fold Cross Validation | Test Set |
|---|---|---|
| Without PCA | Plot | Plot |
| With PCA | Plot | Plot |
Second type of chart is generated by using:
python precision_recall.pyThis generate 4 plot:
| Model Validation | Link to plot |
|---|---|
| 5-Fold Cross Validation | Plot |
| Test Set | Plot |
Third type is generated with:
python roc_curve.py
cd ../..
To extract feature importance:
cd pipeline/04-Feature-Importance
python extract_feature_importance.py
# And to plot
python plot_feature_importance.py
cd ../..
This generates .tsv files on folder meta_data.