This application show metrics about Github repos.
The dashboard should display these metrics over the period of the last 30 days:
-
Average Issue Close Time
-
Average Pull Request Merge Time
-
Top 5 contributors to pull requests
-
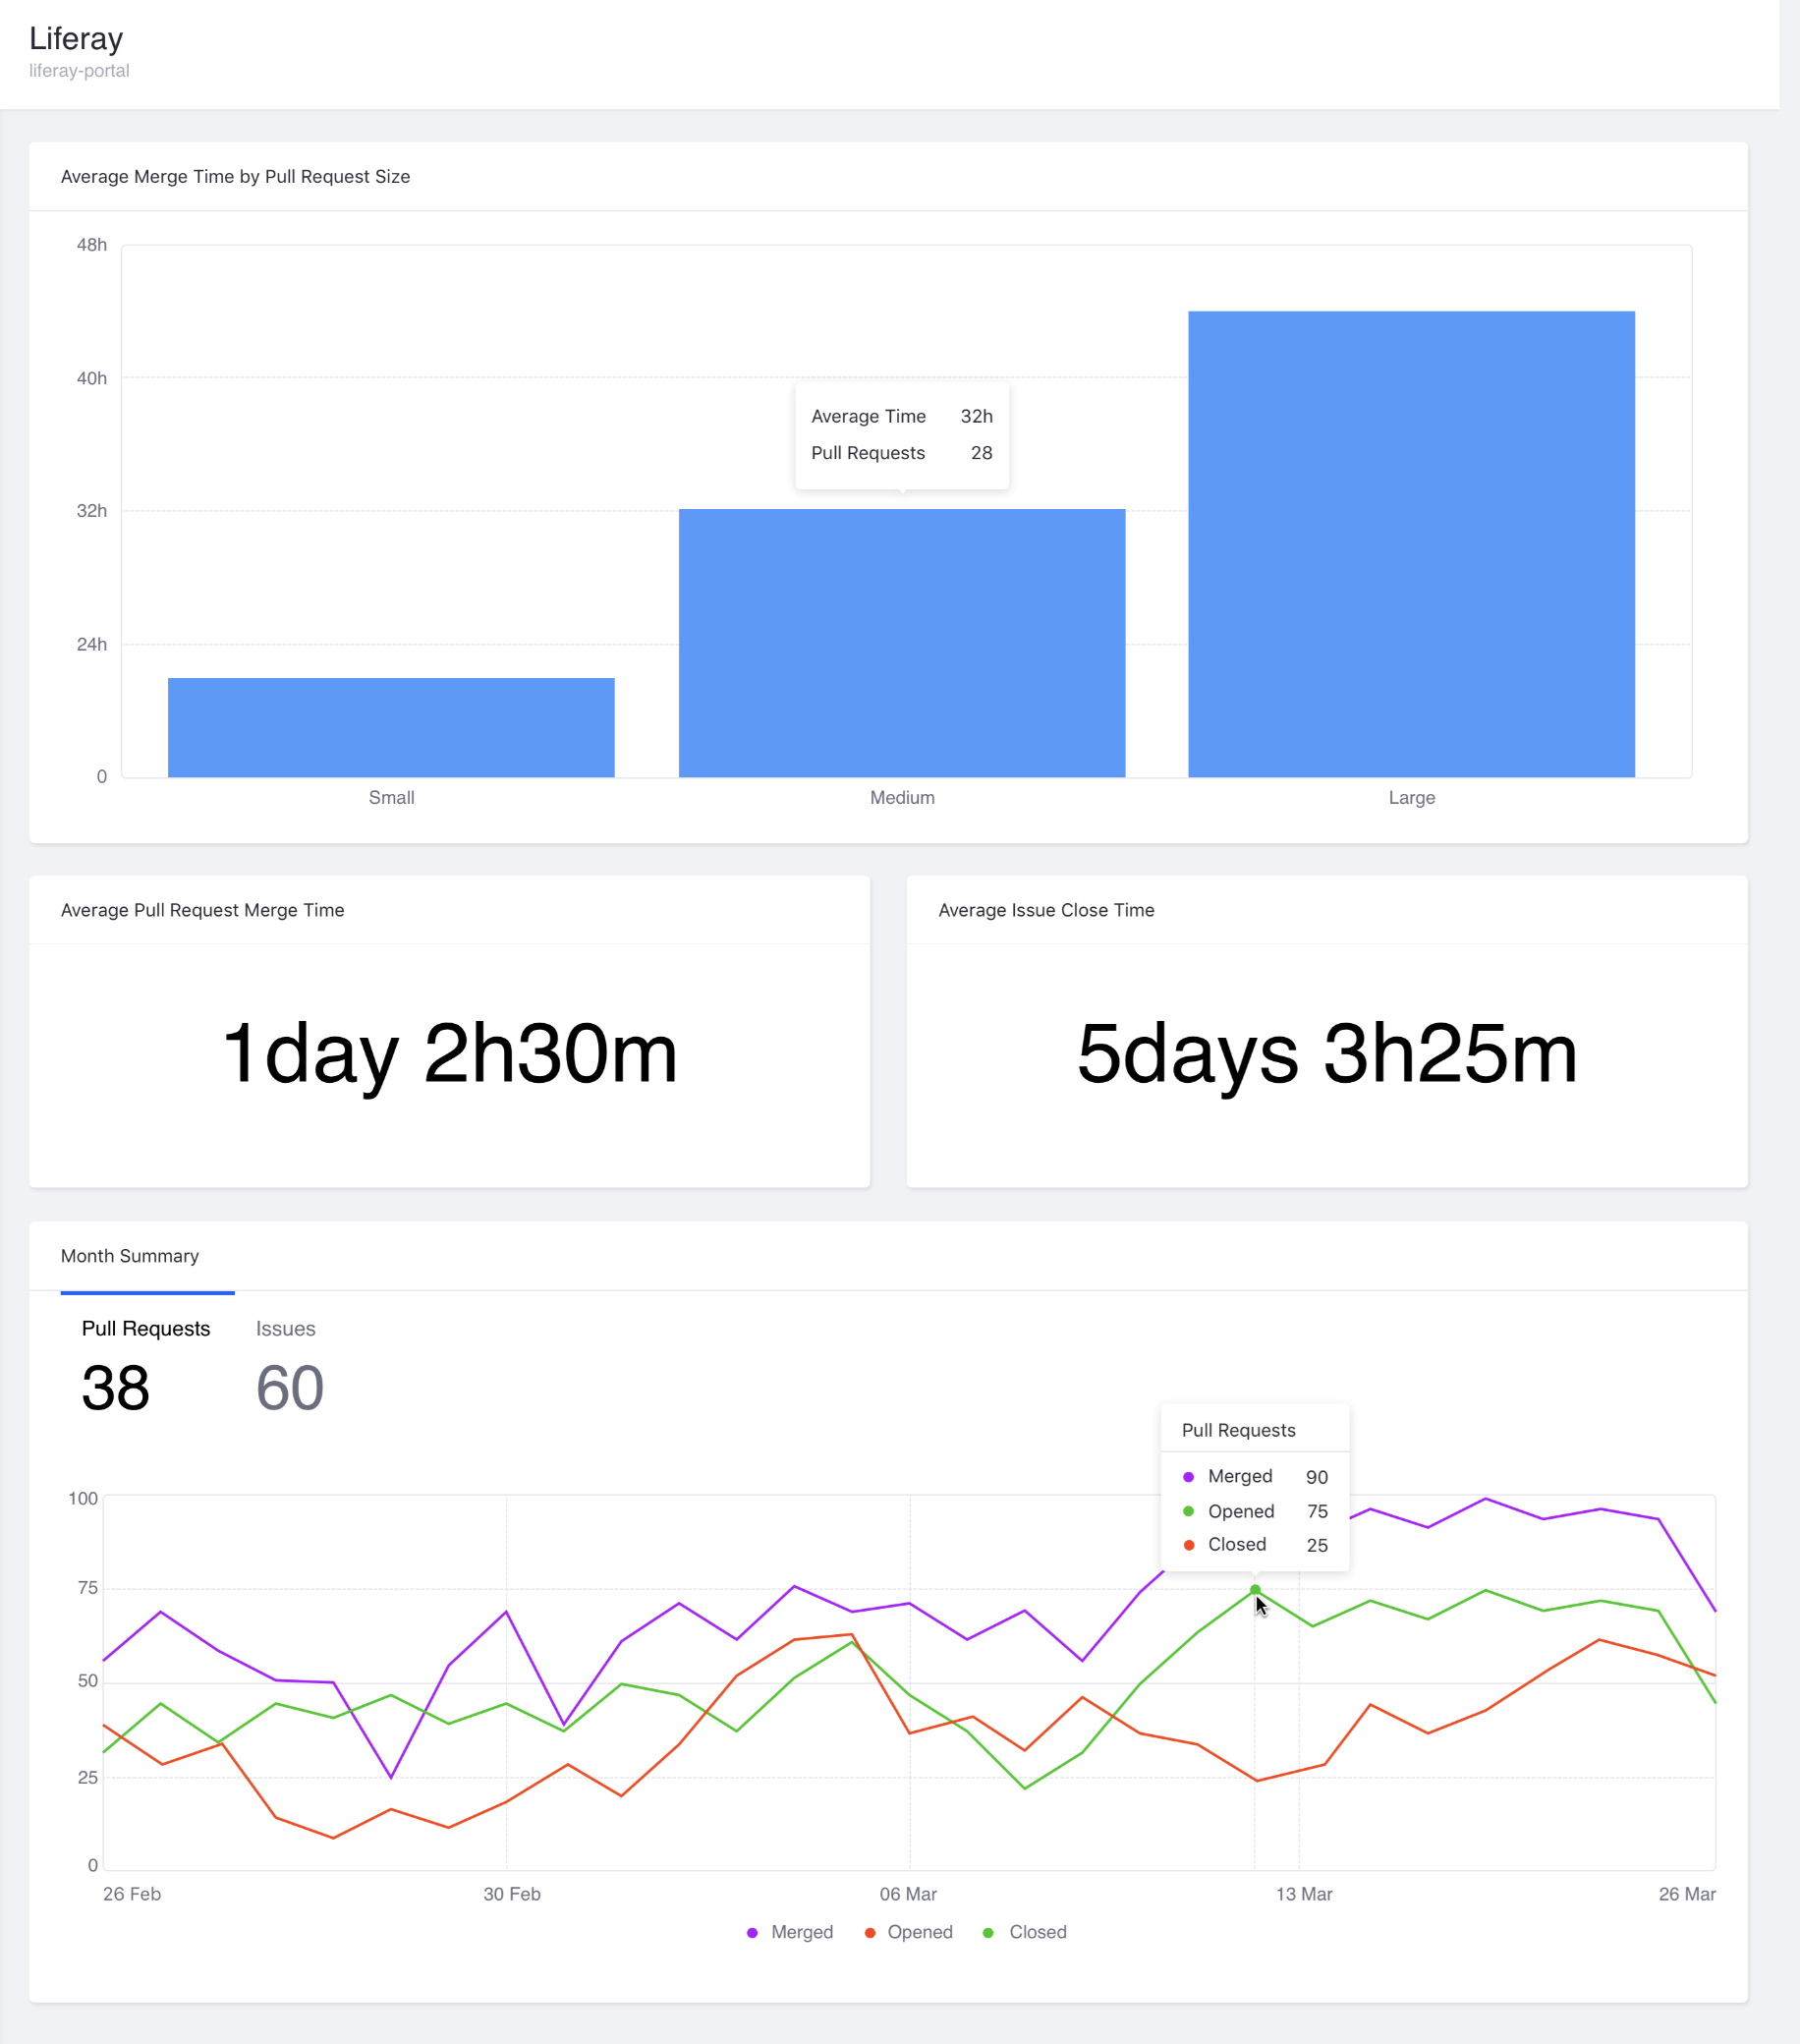
Average Merge Time by Pull Request Size
- Pull Request sizes are:
- Small (maximum of 100 modified lines: additions + deletions)
- Medium (maximum of 1000 modified lines: additions + deletions)
- Large (above any of the other categories)
- Pull Request sizes are:
-
Merged Pull Requests by Day
- Display PRs closed by day over a period of a month
-
Opened Pull Requests by Day
- Display PRs opened by day over a period of a month
-
Closed Pull Requests by Day
- Display PRs opened by day over a period of a month
-
Opened Issues by Day
- Display PRs opened by day over a period of a month
-
Closed Issues by Day
- Display PRs opened by day over a period of a month
# Install dependencies
$ npm install

# Run the dev server
$ npm run dev

# Build for production
$ npm run build

# Run tests
$ npm run testReact, TypeScript, D3, Tailwind CSS.
To get the raw data from the Github API I decided to use these endpoints for the metrics:
-
List repository issues - e.g., for the React repo: api.github.com/repos/facebook/react/issues?per_page=100&state=closed.
-
List pull requests - e.g., for the React repo: api.github.com/repos/facebook/react/pulls?per_page=100&state=closed.
-
List pull request files - e.g., for the React repo and pull number 26283: api.github.com/repos/facebook/react/pulls/26283/files.
Average Merge Time by Pull Request Size:
- endpoint: List pull requests
- keys to look at for each pull request: created_at, merged_at, closed_at
- endpoint: List of pull request files
- keys: additions, deletions
The data I got from the API are organized as follows:
- pulls variable is an array of objects and store the list of PR
- pullsDetail variable is an array of arrays which stores the files information (addition + deletions) of each PR
The order in which the PRs are stored in the above arrays are the same.
For each PR I first calculate the size (small, medium, large):
const getPullSize = (pull) => {
  const modifiedLines = pull.reduce((acc, item) => {
    const { additions, deletions } = item;
    acc = acc + additions + deletions;
    return acc;
  }, 0);
  if (modifiedLines <= 100) return "small";
  if (modifiedLines > 100 && modifiedLines <= 1000) return "medium";
  if (modifiedLines > 1000) return "large";
};

// array of strings
pullsDetail = pullsDetail.map((el) => getPullSize(el));
then I replaced the pulls variables with the size I calculated above and added a merget_time field:
pulls = pulls.map((el, index) => {
const created_at = parseDate(el.created_at);
const closed_at = parseDate(el.closed_at);
const merged_at = parseDate(el.merged_at);
return {
created_at,
closed_at,
merged_at,
merged_time: el.merged_at ? dateDiffInHours(created_at, merged_at) : null,
size: pullsDetail[index],
};
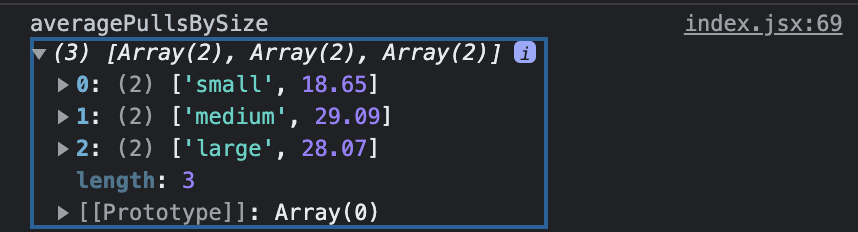
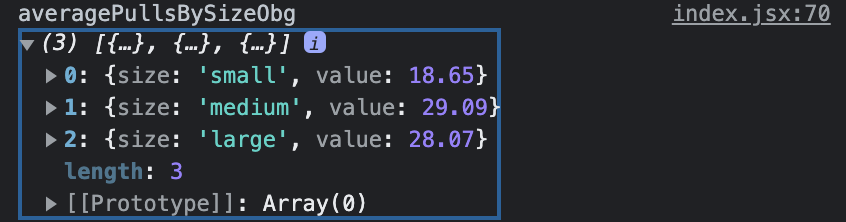
});To calculate the average for each category I used the D3 rollups function which return an array of arrays. Then I transformed it in an array of objects with a size and a value property which I then used as input for D3:
const averagePullsBySize = d3.rollups(
  pulls,
  // reducer
  (v) =>
    d3.mean(v, (d) => d.merged_time)
      ? +d3.mean(v, (d) => d.merged_time).toFixed(2)
      : null,
  (d) => d.size
);
const averagePullBySizeObj = averagePullsBySize.reduce((acc, item) => {
  const [size, value] = item;
  if (value === null) return acc;
  else {
    acc = [...acc, { size, value }];
    return acc;
  }
}, []);
I also needed the total number of pulls for each category:
const totalPullsBySize = pulls.reduce((acc, item) => {
  const { size, merged_time } = item;
  if (!merged_time) return acc;
  if (!acc[size]) {
    acc[size] = 1;
  } else {
    acc[size] = acc[size] + 1;
  }
  return acc;
}, {});
Average Pull Request Merge Time:
- endpoint: List pull requests
- keys to look at for each pull request: created_at, merged_at, closed_at
To calculate this metric I needed to calculate the merged time in hours for each pull, sum all the merged time and finally divide them for the total number of merged pulls:
pulls = pulls.map((el) => {
  const created_at = parseDate(el.created_at);
  const closed_at = parseDate(el.closed_at);
  const merged_at = parseDate(el.merged_at);
  return {
    created_at,
    closed_at,
    merged_at,
    merged_time: el.merged_at ? dateDiffInHours(created_at, merged_at) : null,
  };
});

const mergeTime = pulls.reduce((acc, item) => {
  const { merged_time } = item;
  if (!merged_time) return acc;
  if (!acc["merged_time"]) {
    acc["merged_time"] = item.merged_time;
    acc["number"] = 1;
  } else {
    acc["merged_time"] = acc["merged_time"] + item.merged_time;
    acc["number"] = acc["number"] + 1;
  }
  return acc;
}, {});

const averageMergeTime = +(mergeTime.merged_time / mergeTime.number).toFixed(2);
Average Issue Close Time:
- endpoint: List repository issues
- keys to look at for each issue: created_at, closed_at
The calculations are similar to the previous metric:
issues = issues.map((el) => {
  const created_at = parseDate(el.created_at);
  const closed_at = parseDate(el.closed_at);
  return {
    created_at,
    closed_at,
    closed_time: el.closed_at ? dateDiffInHours(created_at, closed_at) : null,
  };
});

const closedTime = issues.reduce((acc, item) => {
  const { closed_time } = item;
  if (!closed_time) return acc;
  if (!acc["closed_time"]) {
    acc["closed_time"] = item.closed_time;
    acc["number"] = 1;
  } else {
    acc["closed_time"] = acc["closed_time"] + item.closed_time;
    acc["number"] = acc["number"] + 1;
  }
  return acc;
}, {});

const averageClosedTime = +(
  closedTime.closed_time / closedTime.number.toFixed(2)
);
Merged, Closed, Opened Pull Requests by Day
- endpoint: List pull requests
- keys: merged_at
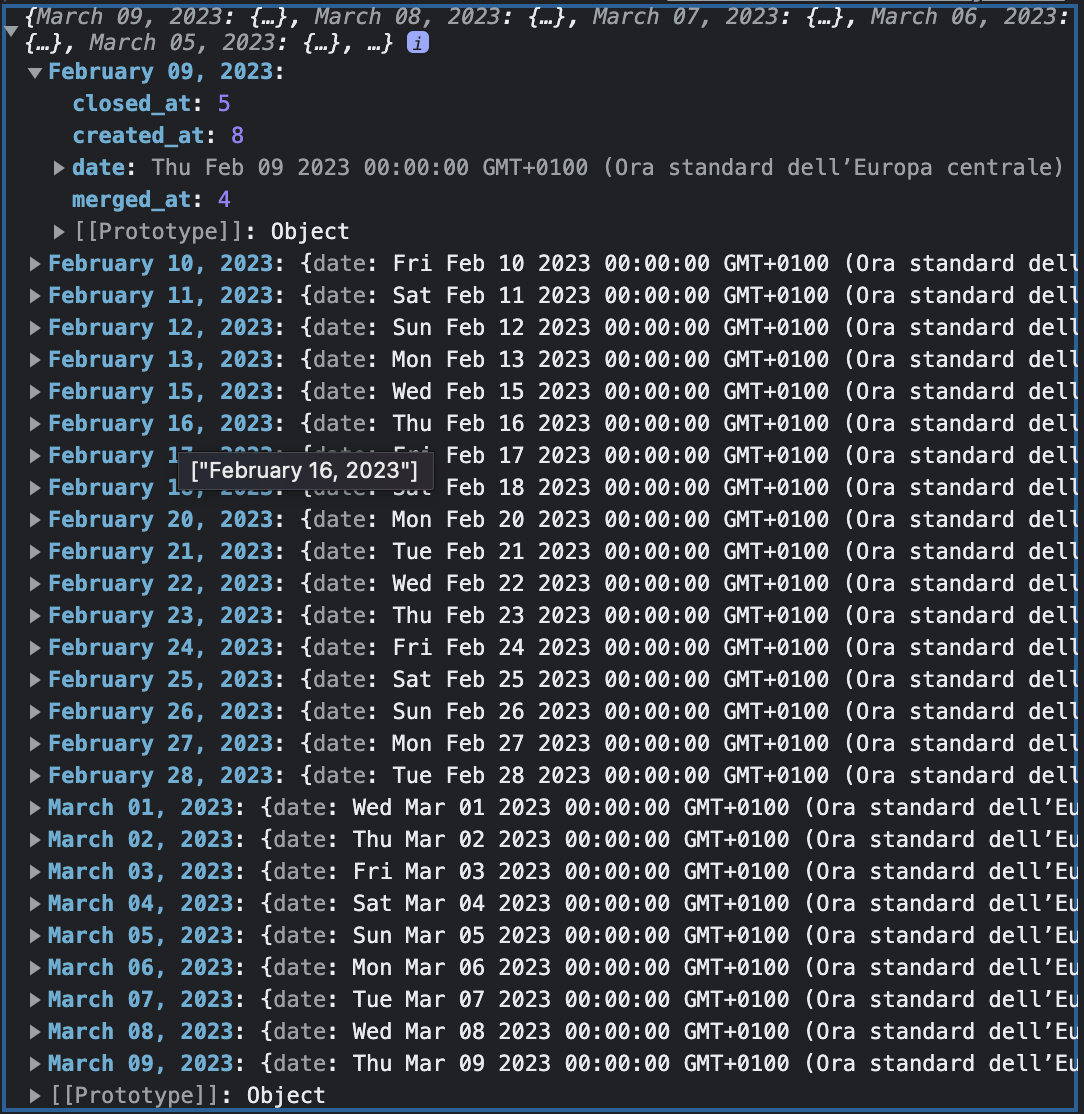
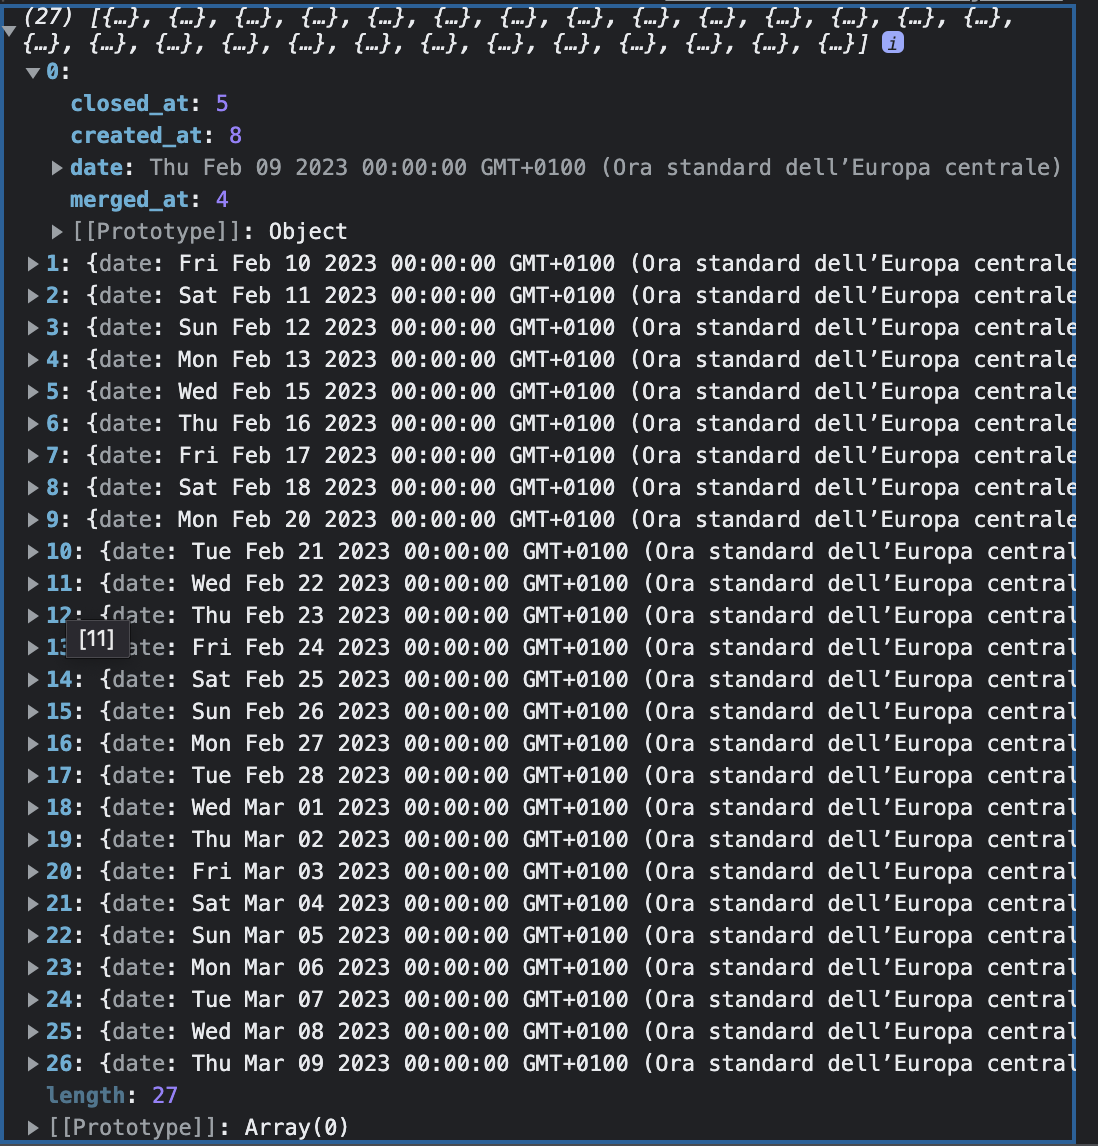
To render the chart I needed the pulls distribution by day:
import { timeParse, timeFormat } from "d3";
const parseDate = timeParse("%Y-%m-%dT%H:%M:%SZ");
const formatTime = timeFormat("%B %d, %Y");
const parseDate2 = timeParse("%B %d, %Y");

let pullsDistribution = pulls.reduce((acc, item) => {
  let { merged_at, closed_at, created_at } = item;
  merged_at ? (merged_at = formatTime(parseDate(merged_at))) : null;
  closed_at ? (closed_at = formatTime(parseDate(closed_at))) : null;
  created_at ? (created_at = formatTime(parseDate(created_at))) : null;
  if (merged_at) {
    if (!acc[merged_at]) {
      acc[merged_at] = {
        date: parseDate2(merged_at),
        merged_at: 1,
        closed_at: 0,
        created_at: 0,
      };
    } else {
      acc[merged_at] = {
        ...acc[merged_at],
        merged_at: acc[merged_at].merged_at + 1,
      };
    }
  }
  if (closed_at) {
    if (!acc[closed_at]) {
      acc[closed_at] = {
        date: parseDate2(closed_at),
        merged_at: 0,
        closed_at: 1,
        created_at: 0,
      };
    } else {
      acc[closed_at] = {
        ...acc[closed_at],
        closed_at: acc[closed_at].closed_at + 1,
      };
    }
  }
  if (created_at) {
    if (!acc[created_at]) {
      acc[created_at] = {
        date: parseDate2(created_at),
        merged_at: 0,
        closed_at: 0,
        created_at: 1,
      };
    } else {
      acc[created_at] = {
        ...acc[created_at],
        created_at: acc[created_at].created_at + 1,
      };
    }
  }

  return acc;
}, {});
pullsDistribution = Object.values(pullsDistribution).sort(
  (a, b) => a.date - b.date
);
const pullsDistributionMerged = {
  name: "Merged",
  values: pullsDistribution.map((el) => {
    return {
      date: el.date,
      value: el.merged_at,
    };
  }),
};
const pullsDistributionCreated = {
  name: "Opened",
  values: pullsDistribution.map((el) => {
    return {
      date: el.date,
      value: el.created_at,
    };
  }),
};
const pullsDistributionClosed = {
  name: "Closed",
  values: pullsDistribution.map((el) => {
    return {
      date: el.date,
      value: el.closed_at,
    };
  }),
};
pullsDistribution = [
  pullsDistributionMerged,
  pullsDistributionCreated,
  pullsDistributionClosed,
];
Closed, Opened Issues by Day
- List of issues
- keys: created_at, closed_at
The calculations are similar to the previous chart.
The rate limit for unauthenticated requests is 60 per hour. This rate was not enough to display these two metrics:
- Merged Pull Requests by Day
- Display PRs closed by day over a period of a month
- Opened Pull Requests by Day
- Display PRs opened by day over a period of a month
So I decided to make authenticated requests with a personal github token that expires in 30 days. This way I increased the rate limit up to 5.000 calls per hour. While developing the dashboard I used dummy data which I then used as a fallback in case something goes wrong with the API.
To display the two metrics above I had to go back one month in time from the current date. Sometimes the first 100 results - which is the maximum you can get from one API call - was not enough. So I decided to take advantage of the pagination feature of the GitHub API.
const subtractMonth = (date) => {
  const newDate = date.setMonth(date.getMonth() - 1);

  return new Date(newDate);
};

const getPaginatedData = async (url) => {
  const nextPattern = /(?<=<)([\S]*)(?=>; rel="Next")/i;
  let pagesRemaining = true;
  let data = [];
  const now = new Date();
  const monthBefore = subtractMonth(now);

  while (pagesRemaining) {
    const response = await axiosInstance.get(url);

    let parsedData = parseData(response.data);
    const checkDate = parsedData.some(
      (el) => parseDate(el.created_at) < monthBefore
    );
    // discard the results older than a month
    if (checkDate) {
      parsedData = parsedData.reduce((acc, item) => {
        if (parseDate(item.created_at) < monthBefore) {
          return acc;
        } else {
          return [...acc, item];
        }
      }, []);
    }
    data = [...data, ...parsedData];

    const linkHeader = response.headers.link;

    pagesRemaining =
      linkHeader && linkHeader.includes(`rel=\"next\"`) && !checkDate;

    if (pagesRemaining) {
      url = linkHeader.match(nextPattern)[0];
    }
  }

  return data;
};

const parseData = (data) => {
  // If the data is an array, return that
  if (Array.isArray(data)) {
    return data;
  }

  // Some endpoints respond with 204 No Content instead of empty array
  //   when there is no data. In that case, return an empty array.
  if (!data) {
    return [];
  }

  // Otherwise, the array of items that we want is in an object
  // Delete keys that don't include the array of items
  delete data.incomplete_results;
  delete data.repository_selection;
  delete data.total_count;
  // Pull out the array of items
  const namespaceKey = Object.keys(data)[0];
  data = data[namespaceKey];

  return data;
};As Amelia Wattenberger stated in this article:
These two technologies (React and D3) are notoriously tricky to combine. The crux of the issue is that they both want to handle the DOM.
What are the benefits of using standard JSX instead of running d3 code on mount? Following Amalia:
- Declarative instead of imperative. The code describes what is being drawn, instead of how to draw it.
- Less code.
- Less hacky. React is, chiefly, a rendering library, and has many optimizations to keep our web apps performant. When adding elements using d3, we're hacking around React, and essentially have to fight against those optimizations. Hacking around your JS framework is a recipe for future frustration, especially if the framework's API changes.
So I decided to let React handle the DOM and use the powerful D3 primitives.
For example to render a line chart I used the d3.line primitive that creates a SVG path string, that can be used inside a path d attribute:
import { line, scaleTime, scaleLinear, max, extent } from "d3";

// x and y accessors
const xValue = (d) => d.date;
const yValue = (d) => d.vale;

// x and y scales. These two functions map data points to pixel points
const xScale = scaleTime().domain(extent(data, xValue)).range([0, innerWidth]);

const yScale = scaleLinear()
  .domain([0, max(data, yValue)])
  .range([innerHeight, 0]);

//lineGenerator is a function built on top of d3.line. line.x() sets or reads the x accessor for the line, and line.y the y accessor.
const lineGenerator = line()
  .x((d) => xScale(xValue(d)))
  .y((d) => yScale(yValue(d)));
If we feed the lineGenerator with the data we want to draw we get the SVG path string:
console.log(lineGenerator(data));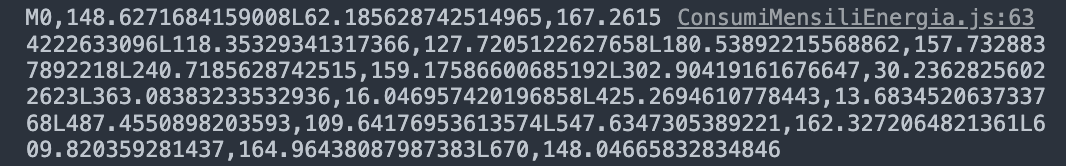
Finally we can let React render the SVG path string in our component:
return (
  <svg>
    <path d={lineGenerator(data)} />
  </svg>
);Context API provides a way to pass data through the component tree without having to pass props down manually at every level (props drilling). I decided to use it to keep the code organized.
Unit tests involve the d3 rollups function and the fallback data in case something goes wrong with the Github API (for instance exceeding the rate limit)
I used these tools:
- Vitest
- React Testing Library