
Required Files:
- OLS Regression R Code
- OLS Regression Using Matrix Algebra R Code
- Multiple Linear Regression OLS Python Code
Programming Language: Python, R
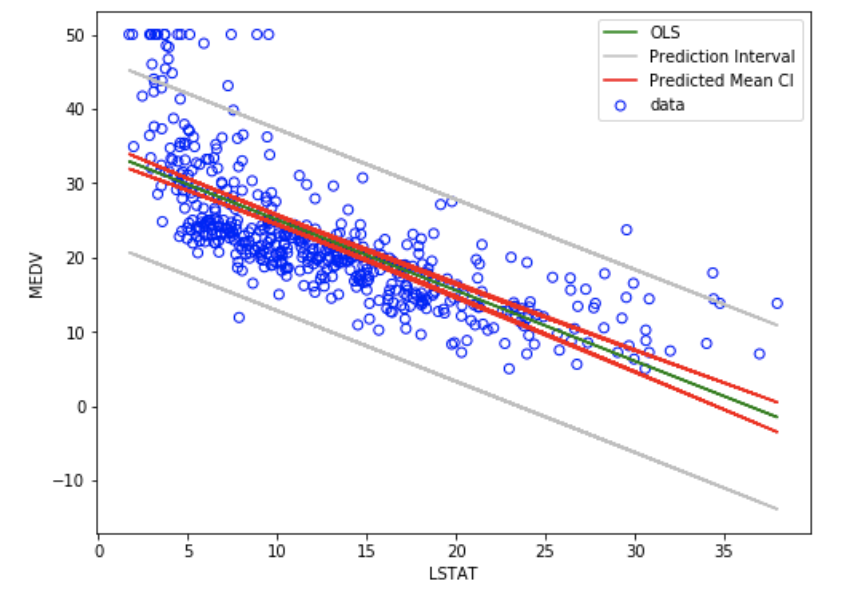
Linear regression is a linear approach to model the relationship between a scalar response (dependent varaible) and one or more explanatory variables (independent variables). The case of having single explanatory variable, the method is referred as simple linear regression. In case of having multiple explanatory variablea, the method is referred as multiple linear regression. Ordinary least squares (OLS) is a type of linear least squares method for estimating the unknown parameters in a linear regression model. OLS chooses the parameters of a linear function of a set of explanatory variables by using the principle of least squares that minimizes the sum of the squares of the residuals" (differences between the observed dependent variable and those predicted by the linear function). The method is largely applied in Econometrics, Finance, Data Science and other subject areas.
Publications:
- Kumari, K. and Yadav, S. (2018). Linear regression analysis study. 4101(4): 33
- Kaya U., Neşe. G. (2013). A Study on Multiple Linear Regression Analysis. 1016(106): 234–240
Programming Language: STATA, Python
Event studies examine the behavior of firms’ stock prices around corporate events. event studies focusing on announcement effects for a short-horizon around an event provide evidence relevant for understanding corporate policy decisions. Event studies also serve an important purpose in capital market research as a way of testing market efficiency. In this STATA do file you can find the code of an entire event study analysis that investigates the impact of external event on (e.g. Trump Tweets) on the stock prices, where for the stock prices "daily" data frequency has been considered and for the event window intervals of [-100, 100] days & [-250, 250] days have been considered. The analysis contains stock prices for 45 unique company's. Per company we have run OLS regression where company's return has been regressed on the market return and event date. The do file consists of the following parts:
- Running OLS regressions for 45 companies
- Predicting residuals of the OLS model
- Using obtained residuals to build Empirical Model (GARCH(1/1) & ARCH(1/1))
- Obtaining test statistics to test the hypothesis with KS-test (Kolmogorov-Smirnov test)
The python file consists of the following parts:
- Obtaining Heteroskedasticity-consistent covariance matrix estimator
- Running another set of OLS regressions
- Obtain test statistics to test the hypothesis with KS-test
Publications:
- Coutts, A. J., Terence, C., Roberts, J., (1994). "The market model and the event study method: A synthesis of the econometric criticisms" International Review of Financial Analysis,3(2): 149-171
Panel data allows you to control for variables you cannot observe or measure like cultural factors or difference in business practices across companies; or variables that change over time but not across entities (i.e. national policies, federal regulations, international agreements, etc.). This is, it accounts for individual heterogeneity. One of the techniques used to analyse Panel Data is Fixed Effects Model which exploits within-group variation over time. Across-group variation is not used to estimate the regression coefficients, because this variation might reflect omitted variable bias. When using FE we assume that something within the individual may impact or bias the predictor or outcome variables and we need to control for this. This is the motivation behind the assumption of the correlation between entity’s error term and predictor variables. FE removes the effect of those time-invariant characteristics so we can assess the net effect of the predictors on the outcome variable. Moreover, time-invariant characteristics are unique to the individual and should not be correlated with other individual characteristics.
Publications:
- Nwakuya, M.T., Ijomah, M. A., (2017). "Fixed Effect Versus Random Effects Modeling in a Panel Data Analysis; A Consideration of Economic and Political Indicators in Six African Countries". International Journal of Statistics and Applications 2017, 7(6): 275-279
Another technique used to analyse Panel Data is Random Effects Model which exploits between-group variation over time. Random effects are estimated with partial pooling, while fixed effects are not. Partial pooling means that, if you have few data points in a group, the group's effect estimate will be based partially on the more abundant data from other groups. Random effects are simply the extension of the partial pooling technique as a general-purpose statistical model. This enables principled application of the idea to a wide variety of situations, including multiple predictors, mixed continuous and categorical variables, and complex correlation structures. The main assumption made in RE is that the deviations of subgroups from a parent follow the distribution of a random variable.
Publications:
- Gurka, M. & Kelley, G. and Edwards, L., (2012)." Fixed and random effects models". Wiley Interdisciplinary Reviews: Computational Statistics. 4(10)
The (Durbin-Wu-)Hausman (1978) test (also called as the Hausman specification test)in general detect endogenous regressors (explainatory variables) in regression model. Endogenous variables have values that are determined by other variables in the system. In panel data analysis, the Hausman test can help to choose between FE model and RE model. Under the null hypothesis the prefered model is RE model and under the alternative hypothesis the model FE is preferred. This test looks to see if there is a correlation between the unique (time-invariant) erros and the regressors in the model. The null hypothesis is that there is no correlation between the two.
Publications:
- Bell, A., Fairbrother, M. and Jones, K., (2018). "Fixed and random effects models: making an informed choice". Qual Quant. 53(2019):1051–1074
The Heckman-2 Step method (often referred as Heckman Correction) is a statistical technique to solve the selection bias of in the data. correct bias from non-randomly selected samples, or to correct the incidentally truncated dependent variables. This is achieved by explicitly modelling the individual sampling probability of each observation (Step 1: Selection equation) together with the conditional expectation of the dependent variable (Step 2: Outcome equation). The resulting likelihood function is mathematically similar to the Tobit model for censored dependent variables.
Publications:
- Heckman, J. (1979). "Sample Selection Bias as a Specification Error". Econometrica. 47 (1): 153–61
File includes the following operations:
- Generating variable
- Generating categorical varaible
- Generating dummy varaible
- Generating interaction varaible
- Rename a variable
- Showing all possible values of the variable
- Drop a variable
- Drop all the observations with missing value
- Give a label to a variable that describes the variable