![]()

This project is a physical board displaying the current status of capture towns of a single hex from the game Foxhole. Inspired by foxholestats.com and powered by Foxhole's WarAPI and a Raspberry Pi running Python.
The WarBoard displays each capture town in the Farranac Coast hex using WS2812 LEDs with corresponding colors matching the factions' colors. The board updates every 10 minutes and automatically changes colors if a captured town changes sides. As a final touch, the board also displays casualties pr. hour for each faction in the hex. These values are shown in colors matching the ones used on foxholestats.com.
If you have questions regarding this project, reach out to me on the following platforms:
If you want to support future projects, click the button below:

In January 2022, I picked up the game Foxhole for the first time and instantly fell in love with it. The sheer chaos on the front line with dozens of people yelling to each other to calm logistical drive across along the roads made it a game I eventually sank a lot of hours into. After playing for some time and eventually joining a regiment, I discovered foxholestats.com. This sparked my interest since it's the first game I've known of to run an API outside of the game itself. With my technical background in electrical design and physical prototyping, I saw this as a great opportunity for a new project. Thus, I started to create some rough code in Python and browsed similar projects for inspiration.
The following section will go over some of the technical aspects of the project. To start with, it will explain some of the code regarding the API and data processing. Later it will go over how the data is used to light up LEDs on the board as well as the construction of the board.
For the actual computer running the code, I opted for the Raspberry Pi platform running the Raspberry Pi OS. It natively supports Python which I have existing experience, making the development easier. Upon execution of the program, the Pi issues an API fetch from the WarAPI, which supplies data throughout the current war's duration. The API fetch is divided into three separate calls. First, a static dataset, which does not change during the war, a dynamic dataset which keeps track of towns captured / industry, etc, and finally a report over the total casualties in the hex in question. These three datasets serve their own purpose but we can combine them for a total overview of the war. The Foxhole Wiki has more detailed explanations regarding the data, so I won't go into further details.
Below you can see the flowchart of the program running:

Within the static and dynamic datasets, we can find sets of coordinates that they both use to pinpoint where on the hex townhalls / relics are located. You can read more regarding how these coordinates are used here. In the next section, I will further explain what each dataset contains and how I will use it.
As mentioned, the static data is, well, static. It does not change throughout the war regardless of the progress. You can request it once and save it each time a new world conquest starts. Each map marker (major or minor) contains a set of coordinates in order to identify it in the hex requested (see this link for further explanation). The x and y cooridnates will be used to connect the static data together with the dynamic data in a somewhat complicated process. Furthermore, I will use the mapMarkerType to identify if the marker is a major town/relic as well as text for the actual name of the location. Below you can see a snippet of how each structure in a fetch is structured:
--# Static data snippet #--
{
    "text" : "The Jade Cove",
    "x" : 0.4322609,
    "y" : 0.6490256,
    "mapMarkerType": "Major"
}
The dynamic data also contains a set of coordinates for each strategic building in the hex similar to the static dataset. This is updated roughly every 10 minutes and must be fetched whenever you need the current status of the war. However, the coordinates in the dynamic dataset differ greatly from the coordinates in the static dataset. Therefore, by comparing each map marker on the x and y values yields no matching results. Why the coordinates differ is unknown and most likely an unintentional discrepancy by the developers.
When looking at the dynamic data, it's clear that by readability alone it's not possible to tell, which structure on the map itself this belongs to. It does not include a name or even matching coordinates as discussed earlier. However, we can use iconType as well as the mismatching x and y coordinates to identify which strategic point this belongs to in the static dataset. You can read further regarding the item fields on the WarAPI GitHub.
Below you can see a snippet of how each location is structured in the dynamic dataset:
--# Dynamic data snippet #--
{
    "teamId": "COLONIALS",
    "iconType": 58,
    "x": 0.62800795,
    "y": 0.71707416,
    "flags": 41
}
To match the static and dynamic coordinates, we can use the distance formula below - also known as The Pythagorean Theorem. This will take two sets of coordinates and calculate the distance between them. For each Major map marker in the static dataset, we will iterate through the entirety of the dynamic dataset and find the lowest returned value out of all cooridinate sets.
math.sqrt(abs(x1 - y1) ** 2 + abs(x2 - y2) ** 2)
We start by defining the map icons in which we are looking for. These numbers represent relics and town halls of all tiers as defined and discussed here:
icons = [45, 46, 47, 56, 57, 58]
We have the first major map marker with the following name and coordinates from the static data:
town = "The Jade Cove"
x1 = 0.4322609
y1 = 0.6490256
We then have the following data for the first set of dynamic data, which matches the iconType of a Town Hall / Relic defined earlier:
teamId = "COLONIALS"
iconType = 58
x2 = 0.62800795
y2 = 0.71707416
We use the distance formular using x1, y1, x2, y2 and get the following value:
distance = 0.527856173467681
We then do this with all remaining data points which match the iconType and eventually get a list, which looks something like this:
delta_distance = [0.527856173467681, 0.09886097716729744, 0.24755610603929687,...]
From the delta_distance list, we then finally find the lowest value and the dataset it belongs to.
We can afterward conclude, that the lowest value is corresponding with the map marker in the static data. We can then extract the teamId and town values and associate the given town base to the faction which controls it. Lastly, it is appended to a separate .json file. The final file of all major structures will then look like this with a value that matches which faction holds that objective:
    "towns": {
        "Huskhollow": "WARDENS",
        "Iuxta Homestead": "COLONIALS",
        "Macha's Keening": "COLONIALS",
        "Mara": "COLONIALS",
        "Pleading Wharf": "COLONIALS",
        "Scarp of Ambrose": "WARDENS",
        "Scythe": "NONE",
        "Terra": "NONE",
        "The Bone Haft": "COLONIALS",
        "The Jade Cove": "COLONIALS",
        "The Spearhead": "COLONIALS",
        "Victa": "COLONIALS"
    }
The last of the API fetches done is from the warreport dataset. This dataset contains the total casualites for each faction in the given hex for the duration of the entire war. I am only interested in "colonialCasualties" and "wardenCasualties" as their values will be used to calculate the casualty rate. Below is a snippet of how the war report fetch looks like:
--# Warreport dataset snippet #--
{
  "totalEnlistments" : 5001,
  "colonialCasualties" : 36662,
  "wardenCasualties" : 48113,
  "dayOfWar" : 117,
  "version" : 424
}
Like foxholestats.com, I wanted to display each faction's casualty rate with the amount of casualities pr. hour with a unique color. As a solution, for each time a fetch is called (every 10 minutes), both numbers for each faction are saved in a list. This list is then updated for a total length of 6. After 6 values is stored in the list, the next value are overwritten at the beginning of the list. The latest value is then subtracted by the oldest value to get the casualty rate pr. hour. Only after 6 fetches (1 hour) will the correct color light up, as it now has sufficient data to show the correct rate.
The final .json file used by the LEDs looks something like this:
{
    "timestamp": 1667398059424,
    "casuality_rate": {
        "colonials": 774,
        "wardens": 803
    },
    "towns": {
        "Huskhollow": "WARDENS",
        "Iuxta Homestead": "WARDENS",
        "Macha's Keening": "COLONIALS",
        "Mara": "COLONIALS",
        "Pleading Wharf": "COLONIALS",
        "Scarp of Ambrose": "WARDENS",
        "Scythe": "NONE",
        "Terra": "WARDENS",
        "The Bone Haft": "WARDENS",
        "The Jade Cove": "NUKED",
        "The Spearhead": "WARDENS",
        "Victa": "COLONIALS"
    }
}
Next, I will explain how the LEDs use this file to identify which color they should light up.
When the data is sorted and exported, we can then use it to make the LEDs light up. For defining colors and controlling the LEDs, I am using the neopixel library. Once wired correctly, I can then address them individually and define the colors of each LED. To do this, the previously defined .json file will be used.
For this project, I have divided the LED data lines into two. One for the captured structures (D18) and one for casualty rate (D21). This is purely done for easier readability and troubleshooting. Regarding defining the colors themselves, I have a dedicated file for constant values in which all links/color values are defined. See constants/constants.py for a total overview.
The board itself, it is comprised of two layers of plywood. One is the backplate where the Raspberry Pi is mounted and LEDs indicate the casualty rate. The other is the map of Farranac Coast with LEDs indicating the individual capture towns.
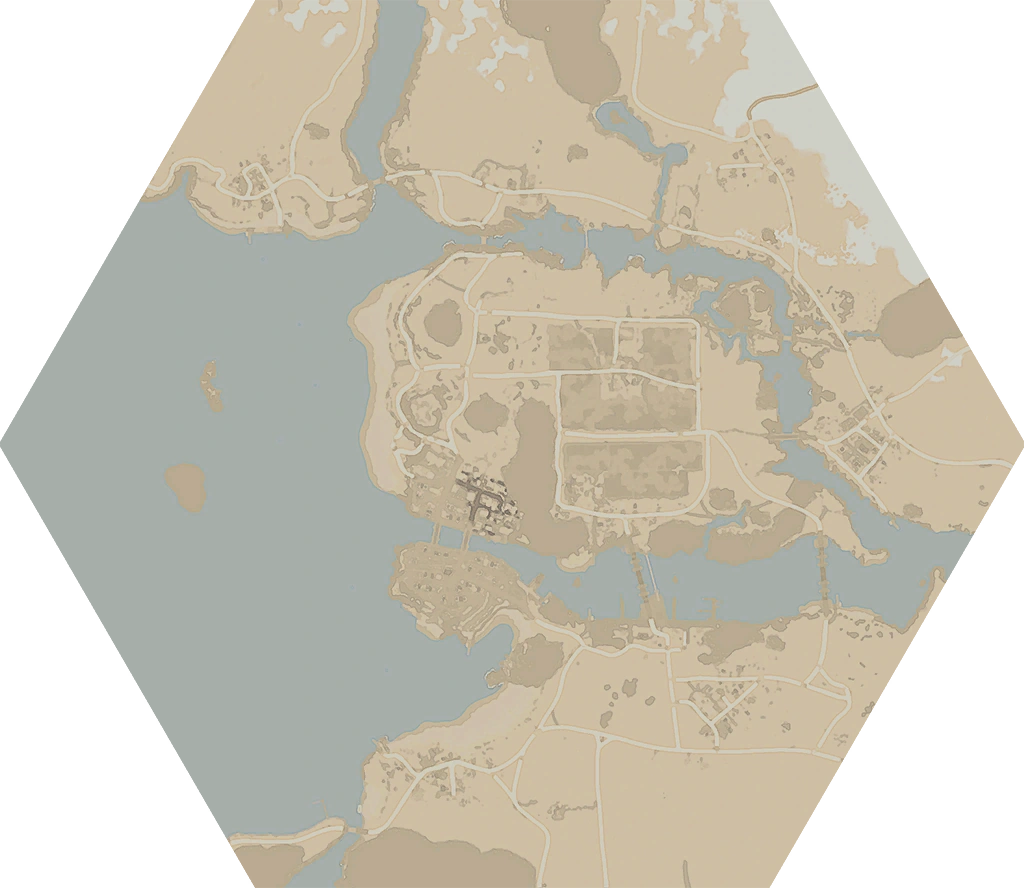
The project is constructed with a 4 mm (1/8 inch) thick plywood sheet specifically made for laser cutting and engraving purposes. The files used for cutting and engraving are two separate files. The map itself is done by tracing from an existing image in Adobe Illustrator. This specific image depicts Farranac Coast and is found on the Foxhole Wiki. The map itself measures 30 cm x 30 cm with no specific reasoning for the size apart from it feeling and looking like the right size.
For the engraving/cutting process, the finished files - which can be found in media/board_files - are imported into Lightburn, which is a software used specifically for laser cutting machines such as the MIRA 7 that I used for this project. Below you can find an overview of how much time was spent cutting/engraving.
- Farranac Coast map board
- 2 hours 35 minutes
- Backboard
- 14 minutes
- Support feet
- 20 seconds
As mentioned in the introduction, the board is powered by a Raspberry Pi computer. This device gives power and data to the LEDs. The LEDs I chose for this project was the individual WS2812 LEDs from Adafruit which are programmable. It is then only to wire up the LEDs and program them to show the colors you'd like. For further details, see media/schemaic for wiring configuration.