reproduce phyloseq example using ggtree
This example is demonstrated in phyloseq vignette.
require(phyloseq)
data(GlobalPatterns)
GP <- prune_taxa(taxa_sums(GlobalPatterns) > 0, GlobalPatterns)
GP.chl <- subset_taxa(GP, Phylum=="Chlamydiae")

plot_tree(GP.chl, color="SampleType", shape="Family", label.tips="Genus", size="Abundance")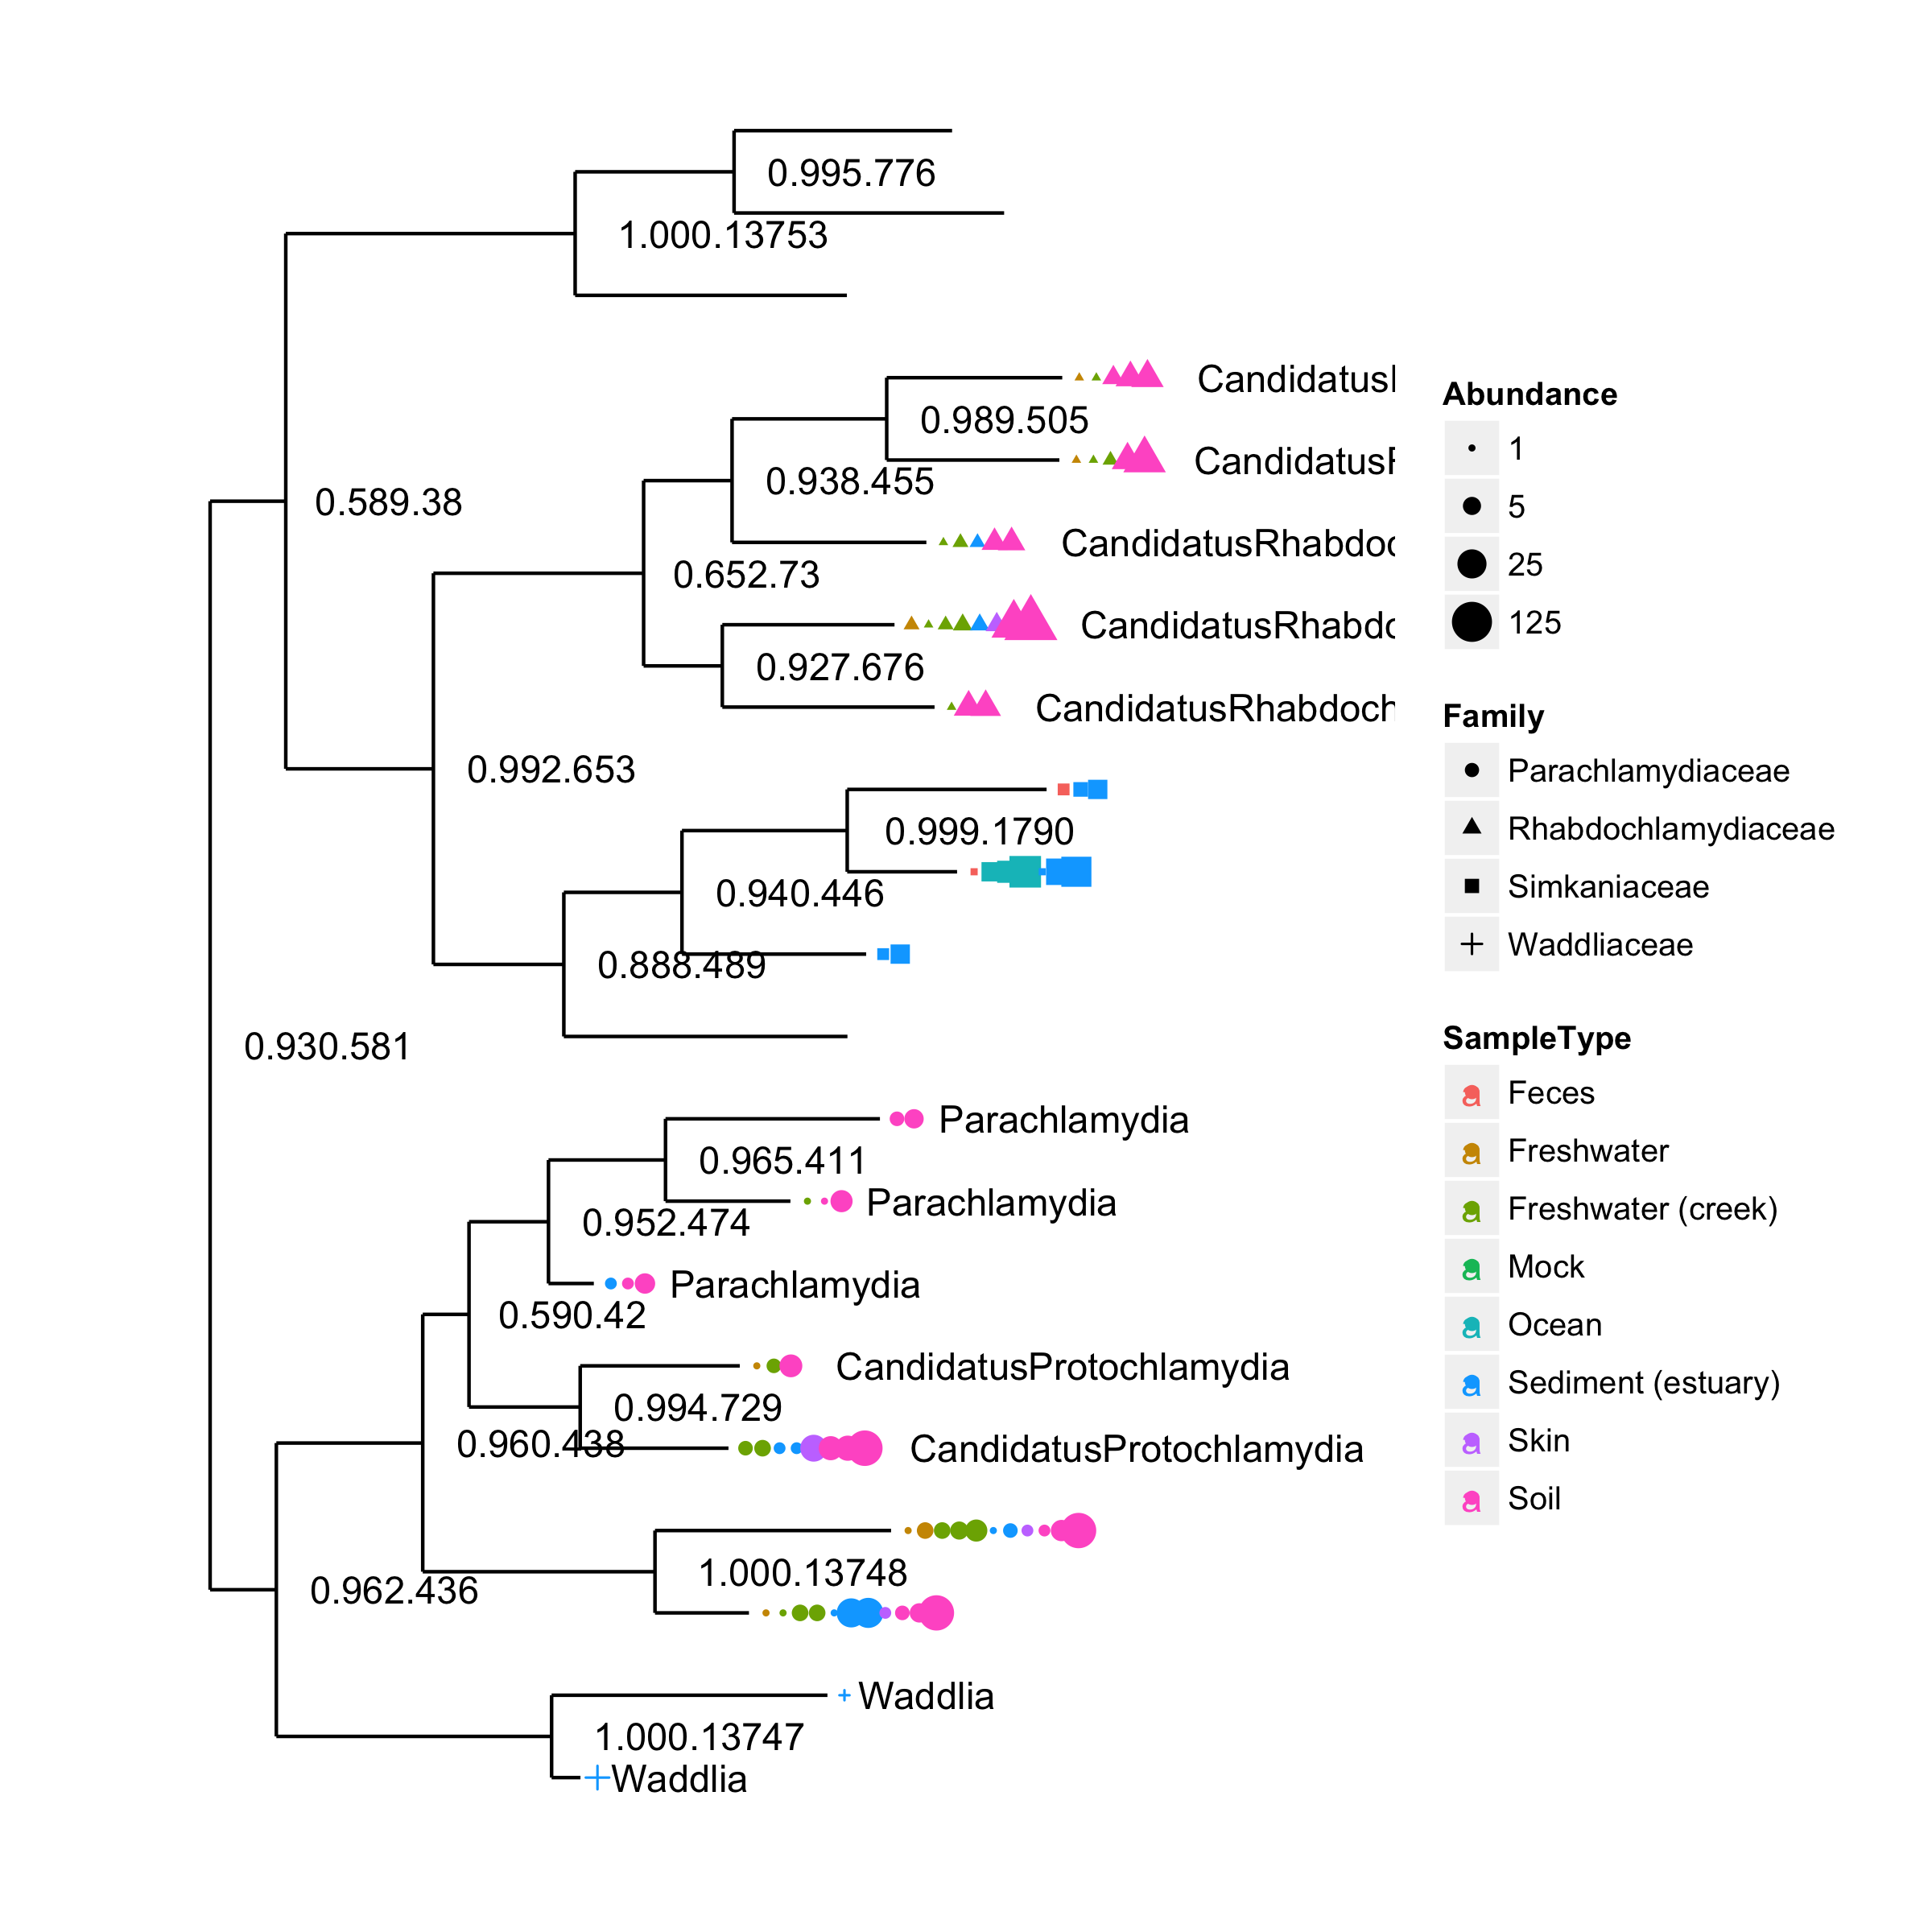
require(ggplot2)
require(ggtree)

draw_phyloseq_ggtree <- function(phyloseq) {
    tree <- phyloseq@phy_tree
    p <- ggtree(tree, ladderize = F)
    p <- p + geom_text(subset=.(!isTip), aes(label=label), hjust=-.2, size=4)

    dd <- psmelt(phyloseq)
    dd <- dd[dd$Abundance > 0, ]
    data <- merge(p$data, dd, by.x="label", by.y="OTU")

    spacing <- 0.02
    idx <- with(data, sapply(table(node)[unique(node)], function(i) 1:i)) %>% unlist
    hjust <- spacing * idx * max(data$x)
    data$xdodge <- data$x + hjust

    p <- p + geom_point(data=data, aes(x=xdodge, color=SampleType,
                            shape=Family, size=Abundance), na.rm=T) +
        theme(legend.position="right") + scale_size_continuous(trans=log_trans(5))

    d2 <- unique(data[, c("x", "y", "Genus")])
    p + geom_text(data=d2, aes(label=Genus), hjust=-.3, na.rm=T, size=4)
}

draw_phyloseq_ggtree(GP.chl)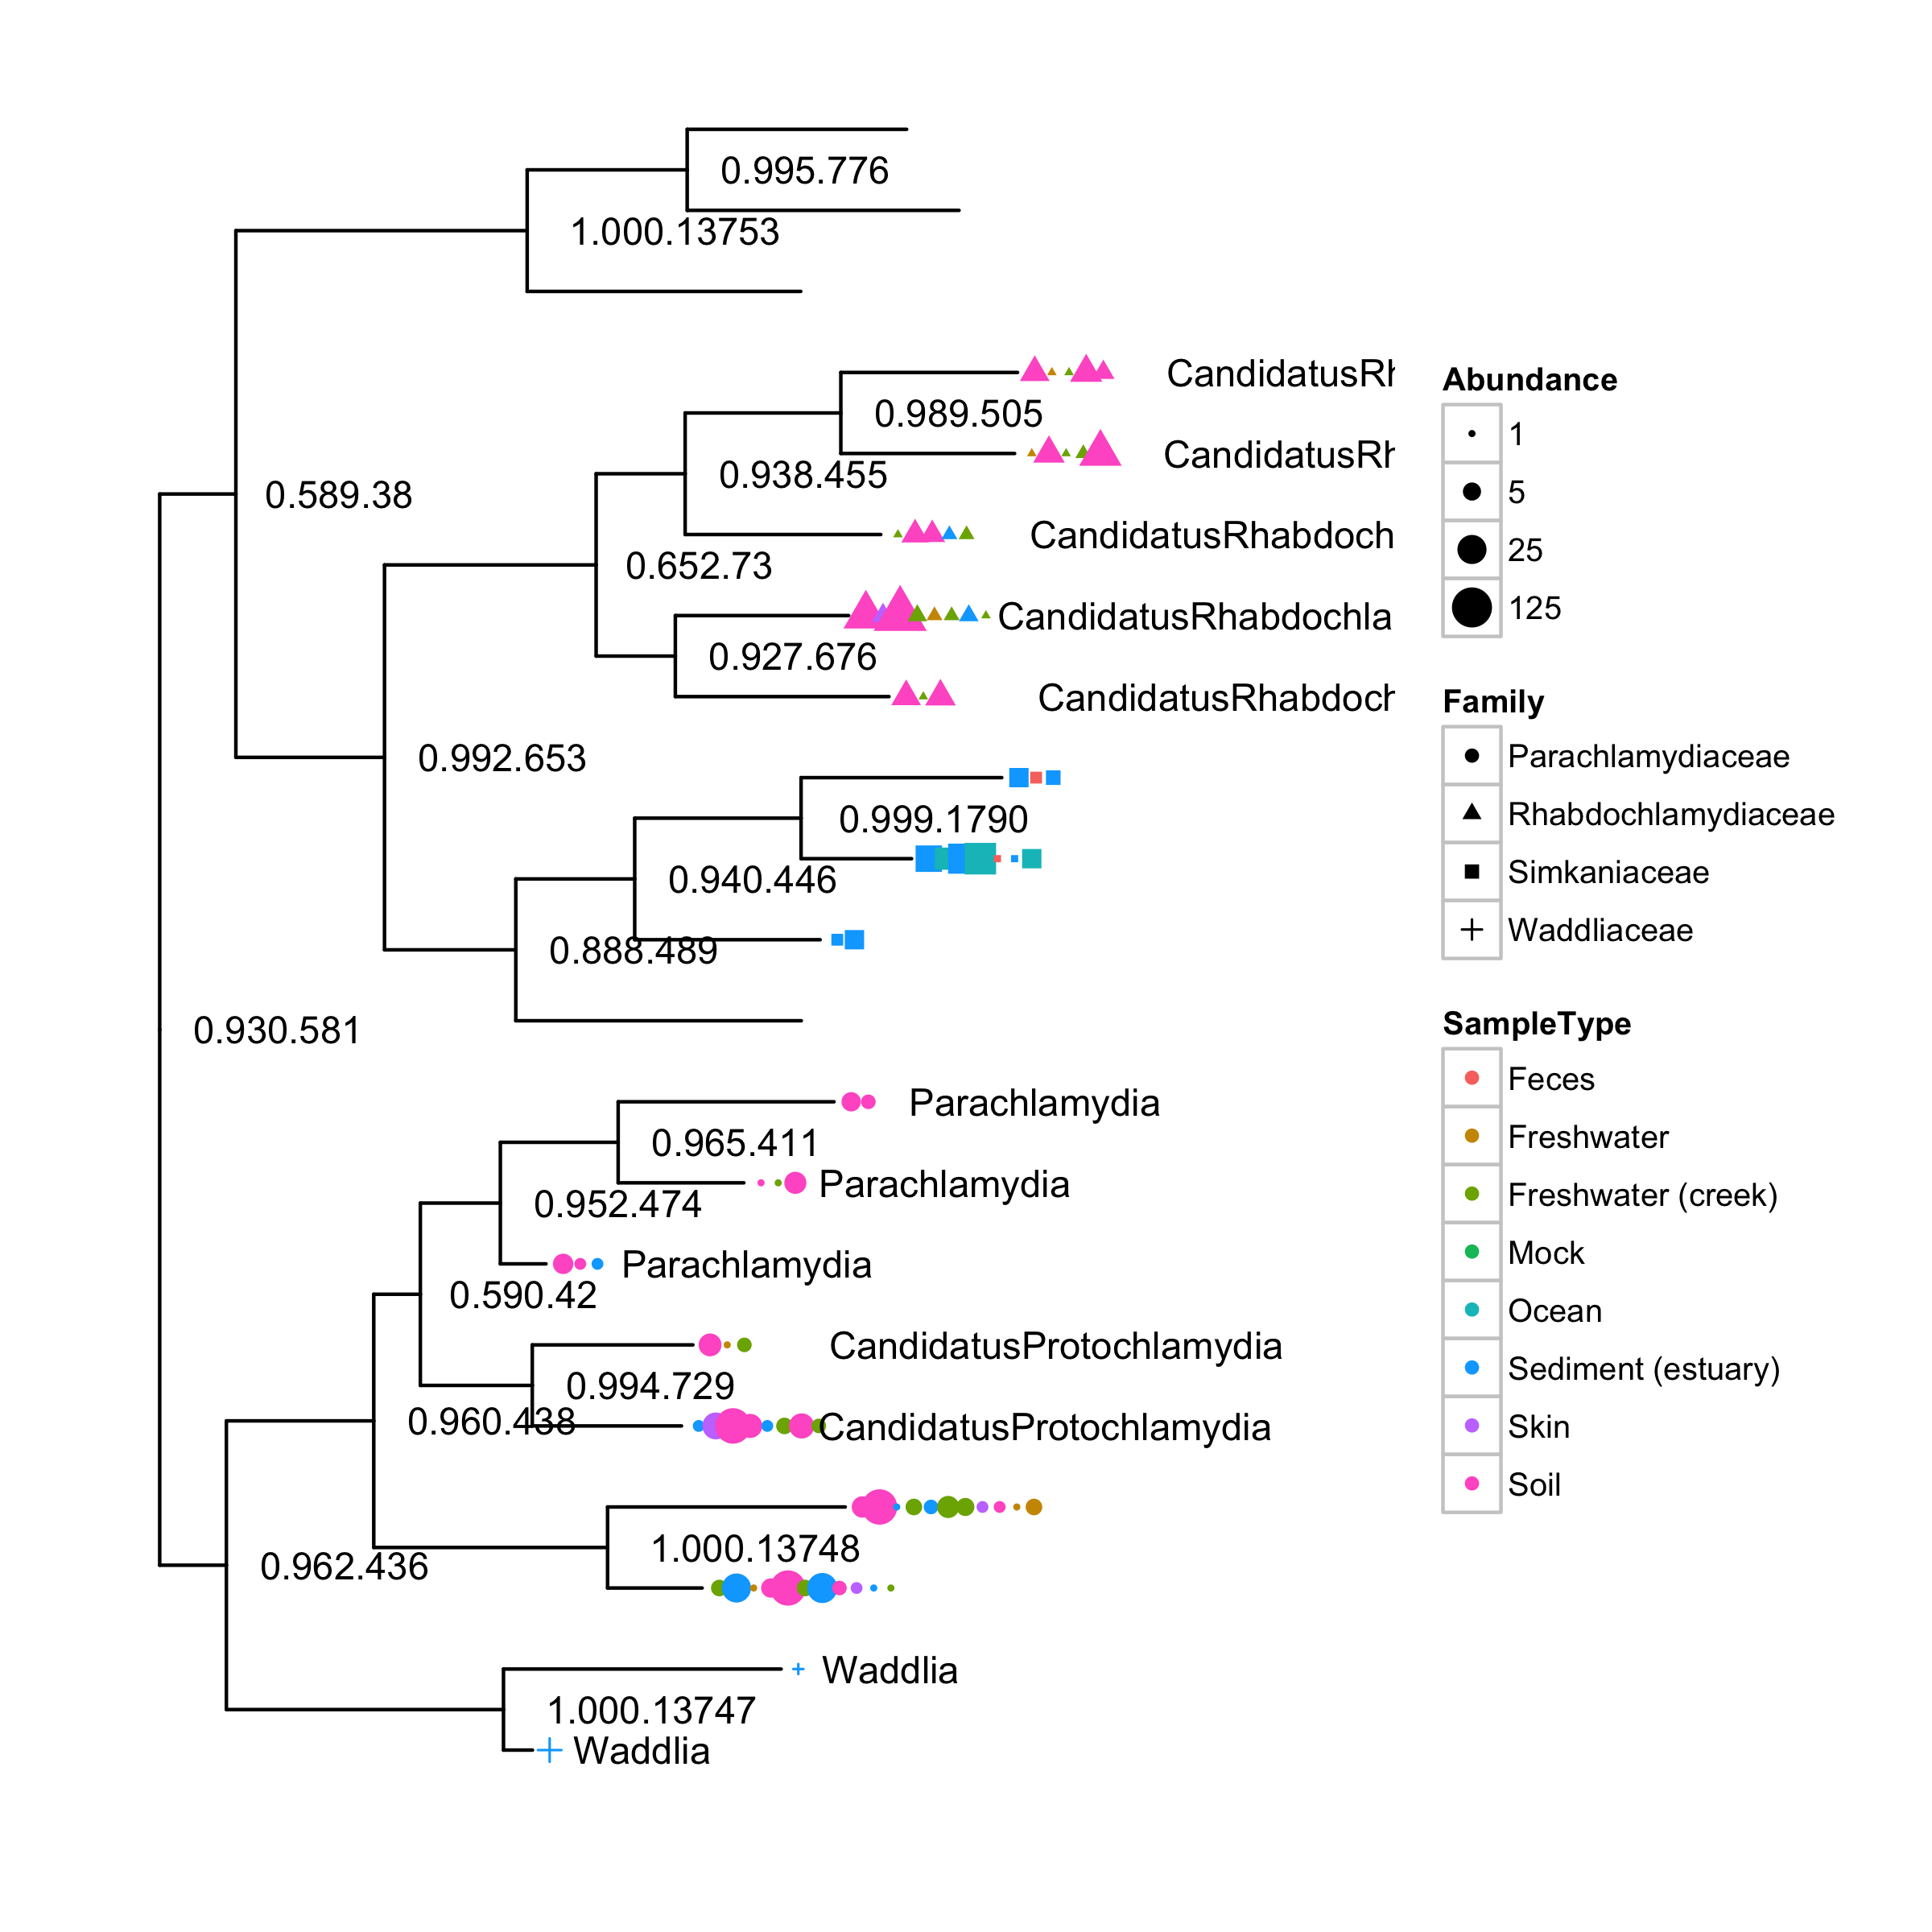
Abundance points were adjusted to prevent overlap. We provide gheatmap function to visualize heatmap next to the tree, which may facilitate users to interpret certain types of data.

We can also use different dots and symbols to encode more information by aligning them vertically using SampleType.
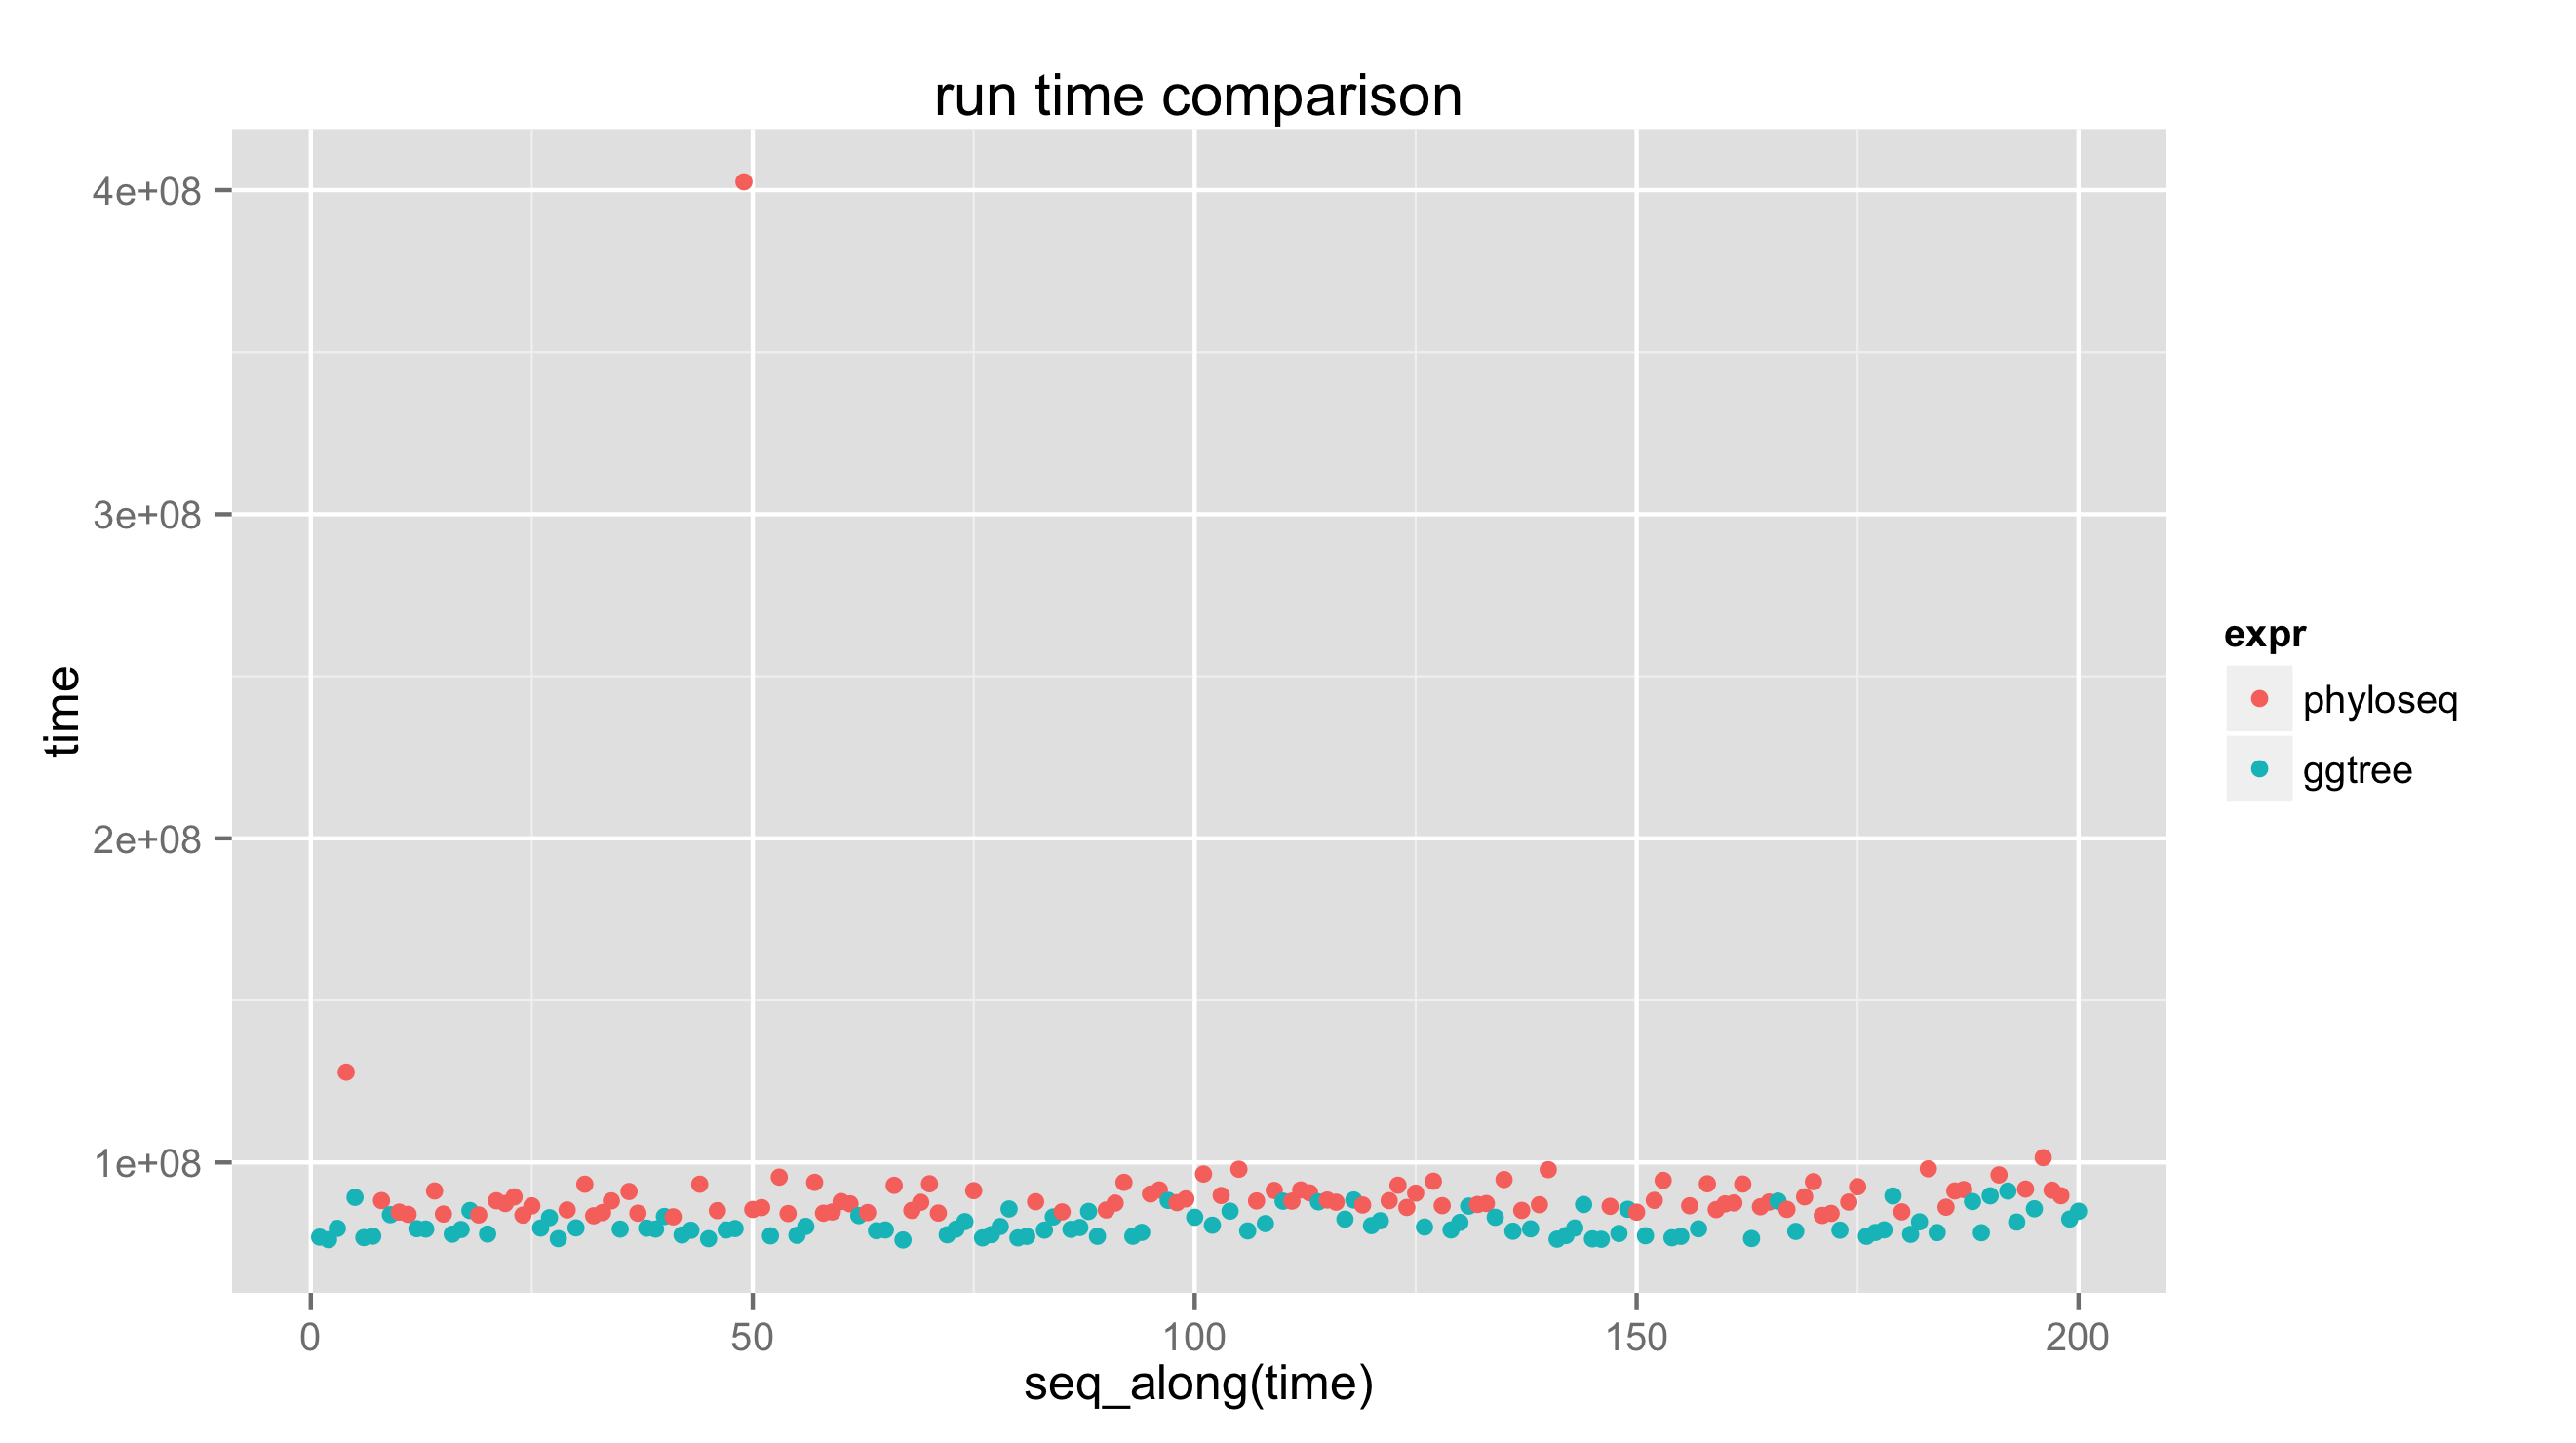
require(microbenchmark)

bm <- microbenchmark(
    phyloseq = plot_tree(GP.chl, color="SampleType", shape="Family",
        label.tips="Genus", size="Abundance"),
    ggtree = draw_phyloseq_ggtree(GP.chl),
    times=100L
    )

print(bm)
## Unit: milliseconds
##      expr      min       lq     mean   median       uq      max neval
##  phyloseq 83.21494 85.46983 92.35073 87.90121 91.56879 402.5652   100
##    ggtree 76.07785 77.71069 80.66713 79.44528 83.01084  91.1686   100