Server/environment setup:
- Project initialization
- Local development setup
- Object storage setup
- Production pipeline server setup
- Production PostgreSQL server setup
- Production web server setup
- Production Druid server setup
Codebase customization
The Harmony Analytics Platform (Harmony), developed by Zenysis Technologies, helps make sense of messy data by transforming, cleaning and enriching data from multiple sources. With Harmony, disparate data are displayed within a single analytical view, giving you a complete picture of your data through triangulated queries and customizable visualizations and dashboards.
Harmony supports two critical workflows for organizations:
- Data Integration: Through its data pipeline, Harmony ingests raw data from various sources, harmonizes it into a consistent format, and stores it in a database. Source data systems remain unaltered and unaffected–Harmony essentially serves as a data integration layer that sits on top of source data systems.
- Advanced Analytics: Harmony enables you to analyze millions of data points at sub-second speed, and quickly uncover insights you can use to make better decisions. Users can easily access and query newly integrated data in Harmony via a web browser.
We developed Harmony to serve in a variety of global health and development contexts, including HIV, tuberculosis and malaria programs, supply chain management, emergency response, immunization and vaccination campaigns, and resource allocation and coordination. Harmony works with structured data sources typically found in these settings, including health management information systems (e.g. DHIS2), logistic management information systems (e.g. OpenLMIS), Excel and CSV files, survey data (e.g. Demographic and Health Surveys) and scorecards. Governments in more than eight low- and middle-income countries in Asia, Africa, and Latin America have leveraged Harmony’s core functionality to improve and manage their health and development programs.
While you're welcome to create a public fork of Harmony for your project, you likely want to maintain a private mirror of the repository to protect information like your API tokens.
$ git clone --bare  https://github.com/Zenysis/Harmony.git
$ cd Harmony.git && git push --mirror https://github.com/EXAMPLE-USER/NEW-REPOSITORY.git
We refer to Harmony projects as "deployments". Each deployment has its own databases, data sources, and is hosted separately.
Deployment configurations are created in the config/ directory. There is a configuration template in config/template and an example configuration in config/harmony_demo. The first step in setting up your Harmony deployment is to select a two or three-letter project code and create your own config/<project code> directory. (🎉) Next, copy the config/template directory into your new directory.
At minimum, the following configuration files must be updated (documentation inside the files provides instructions):
- Customize basic settings (e.g. site name) in
config/<project code>/general.pyandconfig/<project code>/ui.py
Some of the config variables require your Druid and PostgreSQL hosts to be set up. See Production PostgreSQL server setup and Production Druid server setup.
After you have written your first data integration (see writing integrations):
- Create dimensions for querying in
datatypes.py - Customize aggregation options in
aggregation.py - Add indicators based on the field ids you created in the pipeline step
We are working on making this customization easier (and configurable from a frontend) in future releases.
To ensure that Harmony operates as intended, several external services are available as optional features. These services must be instantiated or swapped out from the codebase as needed. It is essential to have active accounts for the following services:
- Mailgun API key; see Instructions
Mailgun is not a core dependency. Harmony’s core data integration platform (used for pipeline orchestration and integrating data into Druid) runs without the mailing service. In addition, there are capabilities in the backend to manage user registrations to Harmony’s analytics product such that a mailing service is not required. Mailgun can be switched out for an alternative in Harmony with limited code changes. This means an implementer of Harmony can choose to forgo the use of Mailgun if they wanted to use an alternative. Users can substitute the Mailgun API call for a call to another client, such as Postal (an open source email client). To do this, the API calls to the new client would need to switch to the new client’s API and input structure, the email class would need to be updated with the new client’s initialization, and the configuration files would need to include the new client’s credentials. Given the source code is open source, we leave that decision to the Harmony user.
- Mapbox access token; see Generating a Mapbox Access Token below
Mapbox is not a mandatory dependency. If a Harmony user were to not provide a Mapbox API token, then Harmony analytics would still function as expected but map layers would be disabled. In addition, a Harmony user can easily sign up to Mapbox and leverage the free tier for up to 50k monthly map loads. In our experience so far, no Harmony user has surpassed this number of monthly loads.
Harmony currently uses mapbox for all Map UI visualisations. In order to use our map visualisations, you need to have your own Mapbox Access Token.
You can read more about access tokens here.
- Open your Mapbox account (Sign up here or sign in here).
- You will find your Default public token on the homepage (the token will typically start with
pk). You can also access your tokens under the Acccess tokens page. - In your Harmony project, assign your Mapbox access token to envrionment variable
MAPBOX_ACCESS_TOKEN
For many Harmony projects, the free tier of Mapbox will be sufficient. Refer to pricing for more information.
When you run a script or the web server, select a configuration by setting the ZEN_ENV environmental variable. This environmental variable maps directly to folder names in config/, and will cause the config module to export the contents of that particular configuration.
  Say there is configuration directory named `usa`. We can specify that configuration with the following:

  ```bash
  export ZEN_ENV='usa'
  ```
See Makefiles.md for more information on the Makefiles in this repository.
In order to run a local web server or run data pipeline steps on the command line, you'll need to set up a local development environment. This is distinct from setting up production servers (explained in other sections).
The instructions found below are for running a local development environment using Docker.
Step by step instructions for running "un-containerised" can be found on the Harmony Wiki.
- Install the latest version of Docker.
- Clone the git repository:
git clone https://github.com/Zenysis/Harmony. (Alternatively, you may want to fork the repo and clone the fork — that way you can use version control for your customization.) - Build your development docker images:
make build(this will take some time!)
You may either
- Create a
.envfile in the root directory of the project and add the following lines:
DRUID_HOST=<druid host goes here>
ZEN_ENV=<environment>
DEV=1
DOCKER_HOST=
DEV=1indicates to the Makefile that you are in "development" mode, and uses the appropriate docker compose files.DOCKER_HOST=indicates to docker that you are connecting to your local docker instance.
- Add the environment variables listed above to your system environment variables
- Or set them in your terminal each time before running the docker compose command
All instructions going forward will assume that the environment variables have been set.
Run make dev-prepare-database
- Run
make up - In a separate terminal, connect to the running web container, run
SERVICE=web make exec-bash - Now run:
source venv/bin/activate && ./scripts/create_user.py --username=me@mydomain.com --password=password --first_name=admin --last_name=istrator --site_admin - Browse to website on http://localhost:5000 and log in with the credentials used in step 3.
- Execute a command on the pipeline container
COMMAND=<your command here> make up-dev-pipelineor - Get a terminal on the pipeline container:
SERVICE=pipeline make run-bash
- Run translations:
SERVICE=web make exec-bashthensource venv/bin/activate && yarn translations
- You can do a lot with docker compose that's beyond the scope of this document, but a good starting point is
docker compose --help - Know what containers are running:
make ps - It's useful to have a terminal open on the web instance:
SERVICE=web make exec-bash; furthermore runningsource venv/bin/activatewill activate the python virtual environment. - You can start a container and attach to the shell with:
SERVICE=web make run-bash.
The Harmony system uses object storage on the pipeline and web server to store files and historical backups of raw data. There needs to be an object storage server and client. The server is flexible and can be Amazon S3, Azure Blob Storage, MinIO server, etc. The instructions below are for MinIO, which is open source, but any object storage server would work. The client is required to be a MinIO client and requires no additional setup since it is already included in the dev and pipeline Dockerfiles.
As described above, any object storage server works and using a MinIO server is optional. MinIO server documentation.
- Follow the instructions to install Docker on Linux (Ubuntu).
- Set the requisite environment variables in a
.envfile:MINIO_ROOT_USERandMINIO_ROOT_PASSWORD. - Create directory for Docker volume. This location can be customized with the
MINIO_DATA_FOLDERenv variable.
sudo mkdir /localdisk/data
- Switch volume directory to non-root ownership. (On machines without an "ubuntu" user, other default, non-root users can be swapped in here.)
sudo chown ubuntu:ubuntu /localdisk/data
- Start the minio server. You will then be able to access the minio console at http://<ip address>:9090.
make minio-server-up- Set the requisite environment variables in a
.envfile:OBJECT_STORAGE_ALIASandMC_CONFIG_PATH.OBJECT_STORAGE_ALIASis an alias name for the object storage server and can be anything. It will be used in the pipeline likemc cp <alias>/<path>.MC_CONFIG_PATHis a folder on the machine that will be the working directory for the minio client. If the web and pipeline containers are not running on the same machine, then these steps will need to be run for the web machine as well. - Enter the pipeline bash container with
make bash-pipeline. - Add the object storage alias. If using a minio server, then the host url will be the machine IP at the 9000 port, the user will be
MINIO_ROOT_USER, and the password will beMINIO_ROOT_PASSWORD.
mc alias set <alias> <host url> <user> <password>- Create a bucket matching the
ZEN_ENV. The bucket name should be prefixed with "zenysis-" followed by theZEN_ENVand any underscores in theZEN_ENVshould be replaced with "-". For example, the bucket for "harmony_demo" is "zenysis-harmony-demo".
mc mb <alias>/<bucket name>The pipeline server runs the ETL data pipeline to generate datasources (typically, daily). These pipeline server setup instructions were developed for Ubuntu. Currently, the instructions are also written with the assumption that Druid is running on the same machine.
- Configure your server's users, firewall, etc. Sign in.
- Follow the instructions to install Docker on Linux (Ubuntu).
- Set the requisite environment variables in a
.envfile:$DATABASE_URL,$ZEN_ENV,$DRUID_HOST,$PIPELINE_USER,$PIPELINE_GROUP,$DEFAULT_SECRET_KEY, and$HASURA_HOST.Running
idon the host machine will show you your user and group IDs. - Optionally add
$DRUID_SHARED_FOLDERand$OUTPUT_PATHif the defaults are not suitable. Set$DOCKER_HOSTif connecting to remote host. - Create directories for Docker volumes.
sudo mkdir /home/share
sudo mkdir /data/output
- Switch volume directories to non-root ownership. (On machines without an "ubuntu" user, other default, non-root users can be swapped in here.)
sudo chown ubuntu:ubuntu /home/share
sudo chown ubuntu:ubuntu /data/output
- Start and enter pipeline container. This will automatically enter the virtual environment. After this step, it will be possible to execute pipeline commands using Zeus.
make bash-pipeline- Optionally, you may want to configure an automated task runner like GitLab, CircleCI, or Jenkins (to automate pipeline runs on a set schedule). Passing the environment variable
COMMANDyou can specify what steps to run when the container starts.
You will have to set up a PostgreSQL database to host relational data and web application state.
It is highly recommended to use a relational database cloud service like Amazon RDS for its guarantees related to security, availability, backups, etc. If your project is restricted from using a cloud service, we provide instructions for running postgres in a Docker container.
-
Follow the instructions to install Docker on Linux (Ubuntu).
-
Populate an file
.env.postgresadding the following entries:
DOCKER_HOST=<server hosting your docker container, blank if localhost>
POSTGRES_USER=<postgres super user>
POSTGRES_PASSWORD=<postgres super user password>
PG_DATA=<optionally, specify where to store the database files e.g. /usr/local/pgsql/data>
(specify a username and password for the postgres SUPERUSER, keep the credentials safe!)
Refer to "postgres" section of docker-compose.db.yaml for further configuration options.
- Start the postgres database server:
Using the docker-compose.db.yml file:
# Start the postgres server in a docker container.
docker compose --env-file .env.postgres -f docker-compose.db.yaml up --detach
On the first run, the database will be initialized and a "super user" will be created with the specified username and password.
Postgres will run in "detached" mode, meaning it will run in the background. If you wish to see the logs you can run:
# Fetch logs from the postgres container.
docker compose --env-file .env.postgres -f docker-compose.db.yaml logs
If you wish to stop the postgres database you can run:
# Stop the postgres container.
docker compose --env-file .env.postgres -f docker-compose.db.yaml downRegardless of installation approach, the postgres server will require a SUPERUSER account. (if you used the Docker installation instructions above, this was already done for you, and you can skip this step.)
By default the SUPERUSER account has access to all databases on the server. We do not share the SUPERUSER credentials with the instance. The instance has its own credentials and ability to manage its own database.
Provide your own, secure password for the SUPERUSER user. Keep it safe!
CREATE USER "<YOUR POSTGRES SUPER USER>" WITH
  LOGIN
  SUPERUSER
  CONNECTION LIMIT -1
  PASSWORD '<YOUR POSTGRES SUPER USER PASSWORD>';
COMMIT;Postgres should now be up and running with a SUPERUSER. Now the database instance for your deployment needs to be created.
Running the below script, replace <POSTGRES_HOST> with the hostname/IP of your postgres instance (example: localhost) and <INSTANCE_DB_NAME> with the database name you want to use (example: harmony) and <POSTGRES_SUPER_USER> with the SUPERUSER username you created.
# Run script in the web container that will generate the sql commands to create the database.
DOCKER_HOST=<server hosting the web container, or blank on local machine> make create-db-setup-script POSTGRES_HOST=<POSTGRES_HOST> POSTGRES_USER=<POSTGRES_SUPER_USER> INSTANCE_DB_NAME=<INSTANCE_DB_NAME>
Take note of the sql commands that are output. You will need to run them on your postgres instance to create the database.
If you are using the Docker installation instructions above, to run postgres locally, you can run the below script to connect to the postgres instance and run the sql commands:
# Connect to the postgres container and run the psql program interactively.
docker compose --env-file .env.postgres -f docker-compose.db.yaml exec postgres bash
psql -U <POSTGRES_SUPER_USER> -h localhost
Set DATABASE_URL as your deployment database connection string in your environment initialization step. Here is an example of what that may look like: export DATABASE_URL='postgresql://test_admin:test_pwd@my.postgres.host/harmony'
After we've created our deployment database, we need to initialize it with seed data. This section addresses upgrading the database schema to ensure consistency with the latest version. The web server will not start unless the database schema version matches the latest version in the source tree.
We need to create all the database tables and configure all constraints, sequences, and other details contained in the database schema.
- If you have not already done so, follow the instructions to configure the web server.
- Upgrade the database by running the below script:
# Run the upgrade script inside the web container.
make upgrade-database
If you cannot run the above, the database upgrade is also done on initialization of the web container.
Once we've upgraded the database and populated the appropriate seed values, we'll need to create a user account so that we can login via the web UI.
ADMIN_USERNAME=<YOUR_USERNAME> ADMIN_PASSWORD=<YOUR_PASSWORD> ADMIN_FIRSTNAME=<YOUR_FIRST_NAME> ADMIN_LASTNAME=YOUR_LAST_NAME make create-admin-user-
Ensure you have the following running and accessible:
- Postgres database, see Production Postgres server setup
- Druid database, see Production Druid server setup
-
We recommend configuring tools for monitoring system status and resource usage as well.
Before deploying the web server, we need to setup some configuration to ensure everything will connect up.
- Environment File
Create a .env file and copy paste the below, updating all values as needed.
# docker related:
DOCKER_NAMESPACE=zengineering
DOCKER_TAG=latest
# DOCKER_HOST=ssh://<WEB_REMOTE>
WEB_REMOTE=<ip or dns that maps to the web server, usually some private ip/dns>

# lets encrypt related:
WEB_LETSENCRYPT_HOST=<your domain>
WEB_LETSENCRYPT_EMAIL=<your domain email>

# nginx related:
NGINX_VHOST=/home/ubuntu/nginx_vhost_default_location
WEB_VIRTUAL_HOST=<your web server url>

# email related:
EMAIL_HOST=<smtp server>
EMAIL_HOST_USER=<smtp server username>
EMAIL_HOST_PASSWORD=<smtp server password>
#MAILGUN_SMTP_ACCOUNT_ID=<optional, if using mailgun>
#EMAIL_TAG_HEADER_NAME=<optional tag, defaults to "X-Mailgun-Tag"
#EMAIL_USE_ENCRYPTION=<optional encryption, defaults to "tls">
NOREPLY_EMAIL=<no reply email>
SUPPORT_EMAIL=<support email>

# web server related:
DATA_PATH=/data
ZEN_ENV=<project code>
DATABASE_URL="postgresql://<INSTANCE USER>:<INSTANCE PASSWORD>@<POSTGRES HOST>:5432/<INSTANCE DATABASE>"
DRUID_HOST=<http://your.druid.instance>
MAPBOX_ACCESS_TOKEN=<mapbox access token>
Ensure that all the file references (e.g. NGINX_DEFAULT_VHOST_CONFIG) are correct.
DOCKER_HOST can be configured to use a remote Docker host, see Docker Remote API
There are pre-built Harmony Docker images that can be found at hub.docker.com for:
- harmony-web-server
- harmony-web-client
- harmony-web
In certain cases you would want to make changes to Harmony or setup your own config pre-built in the Docker image, for that you can run the below:
Set DOCKER_NAMESPACE, DOCKER_TAG in your .env file
# build everything
make build
or
# build something specific
SERVICE=web make buildIf you have druid configured, and have successfully created a druid datasource, you should now be ready to deploy the web server.
make configureusesWEB_REMOTEover ssh with public key authentication. Confirm the IP specified is reachable & public key authentication is enabled before proceeding.
make upusesDOCKER_HOST, Refer to Docker Remote API for configuration.
# Initial setup for the web server, using docker compose.
make configure
# Deploy to remote server, using docker compose.
make up
Once deployed you should be able to login at your domain specified in WEB_VIRTUAL_HOST, logging in with the credentials created in Seeding The Database.
Apache Druid is an OLAP database built to handle large analytical queries. It is:
- Column-oriented, NoSQL built for analytical workloads
- Distributed and scalable (via Apache Zookeeper)
- Open source and customizable to many types of hardware
Harmony uses Druid as a datastore for queryable data produced by the ETL pipeline. A new Druid collection is created every time the pipeline runs. This ensures that all datasets reflect a single common snapshot in time and makes it possible to inspect historical records for tampering and other inconsistencies.

This setup makes use of docker compose to easily spin up and manage Druid. For cluster configuration, we use a Druid Docker Environment file.
The instructions describe how to spin up a Druid cluster on a single server or on multiple servers. Druid recommends having a clustered deployment running on multiple servers for production instances.
Druid resource settings are usually tied to your hardware specifications. The optimized configuration in environment works for most Harmony deployments. Allocation can be changed based on your usage requirements. See Druid Configuration for more.
These instructions were written for Ubuntu operating systems.
The first step is to update the appropriate DOCKER_HOST in druid_setup/.env.
- For a single-server cluster, set
SINGLE_SERVER_DOCKER_HOSTto your local Druid host. (This is the default DOCKER ENDPOINT printed whendocker context lsis run.) - For a multiple-server cluster, set the
CLUSTER_*_SERVER_DOCKER_HOSTvariables to the machine IPs partitioned for each service (master, data, and query).- There are some additional environment variables that have to be configured for a multi-server cluster to run optimally.
- Common config is located in
druid_setup/cluster/environment/common.env(druid_zk_service_host,druid_metadata_storage_connector_connectURI, anddruid_cache_hosts) - Coordinator config is located in
druid_setup/cluster/environment/coordinator.env(druid_host) - Historical config is located in
druid_setup/cluster/environment/historical.env(druid_host)
- Common config is located in
- Also, ensure that public key authentication is enabled.
- There are some additional environment variables that have to be configured for a multi-server cluster to run optimally.
Next, create the following directories on the remote server:
- /home/share
- /data/output
Finally, deploy the appropriate Druid cluster:
Single server setup:
cd druid_setup
# Deploy single server mode
make single_server_up
Cluster server setup:
cd druid_setup
# Deploy cluster server mode
make cluster_server_up
Once all containers are running, the Druid router console should be available at http://{SERVER_IP}:8888/.
-
If running Compose V1 (now deprecated), install the docker-compose-plugin package. Otherwise you will need to update all
druid_setup/Makefilecommands to calldocker-compose ...instead ofdocker compose .... (Replace the space with a hyphen.) -
If running your
make *_server_upcommand causes aorg.freedesktop.secretserror, runsudo apt install gnupg2 pass. -
If certain containers are continuously restarting, their services likely require more memory. Adjust the resource settings in the
druid_setup/*/environmentfiles or upgrade your machine(s).
This project comes with a built-in ETL pipeline that has been proven to work in a variety of global health contexts.
It provides a general framework for scraping data from any number of data sources or APIs, tools for standardizing this data in a common format (called Zenysis Base Format), and libraries for merging these disparate datasets together in such a way to make them mutually queryable.
Our data pipeline is based on Zeus, an open-source, command-line oriented pipeline runner. Note that Zeus processes files in order of numeric prefix, so given three tasks, 00_fetch_gender, 00_fetch_sex, and 03_convert, Zeus will run 00_fetch_gender and 00_fetch_sex synchronously, then run 03_convert when both are complete.
On a technical level, a "data pipeline" is comprised by three stateless sub-pipelines: Generate → Process → Index.
Generate
In short: this pipeline runs queries and collects data from an external source.
The data generation pipeline is used for providing data sets to the process and validate pipelines in a stateless manner. Tasks in the data generation pipeline tend have specific requirements around network access (like running within a specific intranet), task duration (like long running machine learning jobs), or complex source data transformations (like a convoluted excel workbook that is rarely updated and only needs to be cleaned once) that make them unsuitable for running in the other pipelines.
Tasks within the data generation pipeline must handle data persistence themselves by uploading to object storage such as AWS S3 or Minio.
Process
In short: this pipeline integrates raw data, cleans it, and standardizes the keys.
This is where the majority of a deployment's data integration work happens. The data processing pipeline is used for transforming and merging multiple different data sets into a single common format that can be stored in a database by the index; pipeline. Dimension value matching and unification across sources will happen in this pipeline.
Index
The data indexing pipeline uploads the published data from the process pipeline into the datastores (like Druid and Postgres) used by the frontend for querying and data display.
The easiest way to prepare data for ingestion is by conforming to a flexible predefined CSV format that we refer to as Zenysis Base Format.
A process_csv" module is included in the repository at data/pipeline/scripts/process_csv.py. This module accepts tabular data in a variety of compatible formats and transforms it for fast indexing into the Druid database. In our experience, process_csv is flexible enough to handle a significant majority of health data sources in the development sector with little customization or editing.
Before we get into how you should format your data, let's define some terminology:
- dimension: A column that you want to group by or filter on. Examples of this are "Region" or "Gender." These columns represent categorical data and all values in these columns are strings.
- date: The date associated with this datapoint, as a string formatted YYYY-MM-DD.
- field: An indicator or dataset name. Usually it's best to slugify these. For example, "Malaria Cases" may become "malaria_cases" or "MalariaCases." The values in these columns are numeric.
The simplest Zenysis Base Format is as follows:
dimension1, dimension2, ..., dimensionN, date, field1, field2, ..., fieldN
Here's an example set of columns and an example row:
| RegionName | SubregionName | DistrictName | Date | MalariaCases | MeaslesCases | NumberOfDoctors |
|---|---|---|---|---|---|---|
| North America | United States | District 13 | 2019-01-01 | 150 | 0 | 20 |
| North America | Canada | Albert | 2019-02-15 | 0 | 2 | 1 |
If you are integrating a single field, you may use the following format:
dimension1, dimension2, ..., dimensionN, date, field, val
Here's an example of valid input that follows that format:
| RegionName | SubregionName | DistrictName | Date | field | val |
|---|---|---|---|---|---|
| North America | United States | District 13 | 2019-01-01 | population | 150000 |
| North America | United States | District 13 | 2019-02-15 | malaria_cases | 150 |
| North America | United States | District 2 | 2019-02-15 | malaria_cases | 22 |
There is more to learn about the CSV processor - it supports a variety of formats, wildcards, and even Python hooks. See data/pipeline/scripts/process_csv.py for a README.
When calling process_csv, you must specify the date column, the sourcename (a label for your datasource), and the prefix for all indicators produced (usually the name of your datasource or some other informative tag). You will also have to specify some input and output files. You can call process_csv from your Python pipeline scripts directly, or invoke it on the command line.
Contributions are welcome! Use Github's Issues and Pull Requests features to report bugs, plan features, or submit changes.
We have an open Google Group mailing list zenysis-harmony@googlegroups.com, which you can join or email with questions and other discussion. For general open source matters at Zenysis you may contact open-source@zenysis.com.
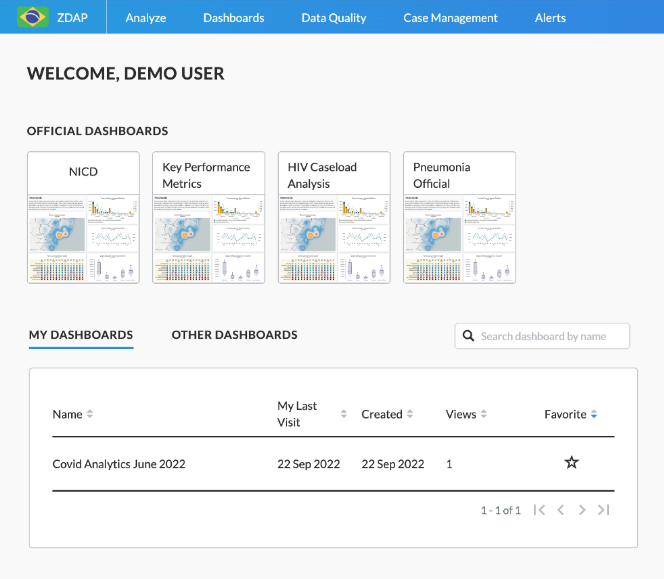
The Overview Page is a personalized ‘landing’ page you see when you log into the platform. It is intended to provide you with an overview and easy access to the different parts of the platform you regularly work with.
From the Overview Page, you can easily access official dashboards and other dashboards you or your colleagues have created. For each dashboard, key information such as date of creation, your last date of visit, and number of views is displayed.
The Analyze page is your primary means to interact with your data. This is where your analysis usually starts. The page allows you to construct basic and advanced queries and visualize the data in flexible ways. It enables you to select the indicators, geographies and reporting periods your analysis requires. The Analyze page also offers you various visualization tools such as bar charts, time (line) graphs, heat tiles and maps you can use to explore and present your data.
To run a query, you simply go to the Analyze page (click on ‘Analyze’ button in the navigation bar) and select your:
- Indicator(s) from the available datasets
- Aggregation level(s) (‘Group By’)
- Geographic and date range filters (‘Filters’)

Once you have made your query selections, you will be able to visualize your data using different visualizations. These include Table, Scorecard, Bar Chart, Time Graph, Map, Heat Tiles and Ranking. The visualization picker will intuitively guide you in selecting a visualization whose requirements are fulfilled. For example, you can only use a “Time Series” visualization if you have selected a time aggregation in your query. All visualizations designed in the “Analyze” tool can then be added to Dashboards.
In addition, the platform provides useful post-query functionalities for more advanced needs:
- Custom calculations: you can create new and more complex indicators, known as “custom calculations”, by mathematically combining existing ones in your query. The calculations tool lets you use both logical and mathematical operations to create these new indicators.
- Filtering: Filtering results (which is different from filters you used to set the scope of your analysis) will help you to limit the results shown on your visualizations after you run your initial query. By applying different conditions and rules, you can, for example, remove below average results from your visualization.

A dashboard represents a collection of analyses that you wish to save for a variety of purposes, including to give a presentation, make a report or to monitor continuously. Dashboards can store any analysis that you create on Analyze, whether it takes the form of a graph, table or time series.
Dashboards also support different types of content such as text, images, dividers and iFrames. These content types enable the user to craft report-like dashboards and tell a more complex story about their data.
In addition, users can add dashboard-level filters and aggregations. For example, a user can modify the date range, geographical filters and level of aggregation of data within the dashboard directly. In this way, your personal dashboard becomes a dynamic tool which you can use for monitoring key data points across various dimensions and do further exploratory analysis.
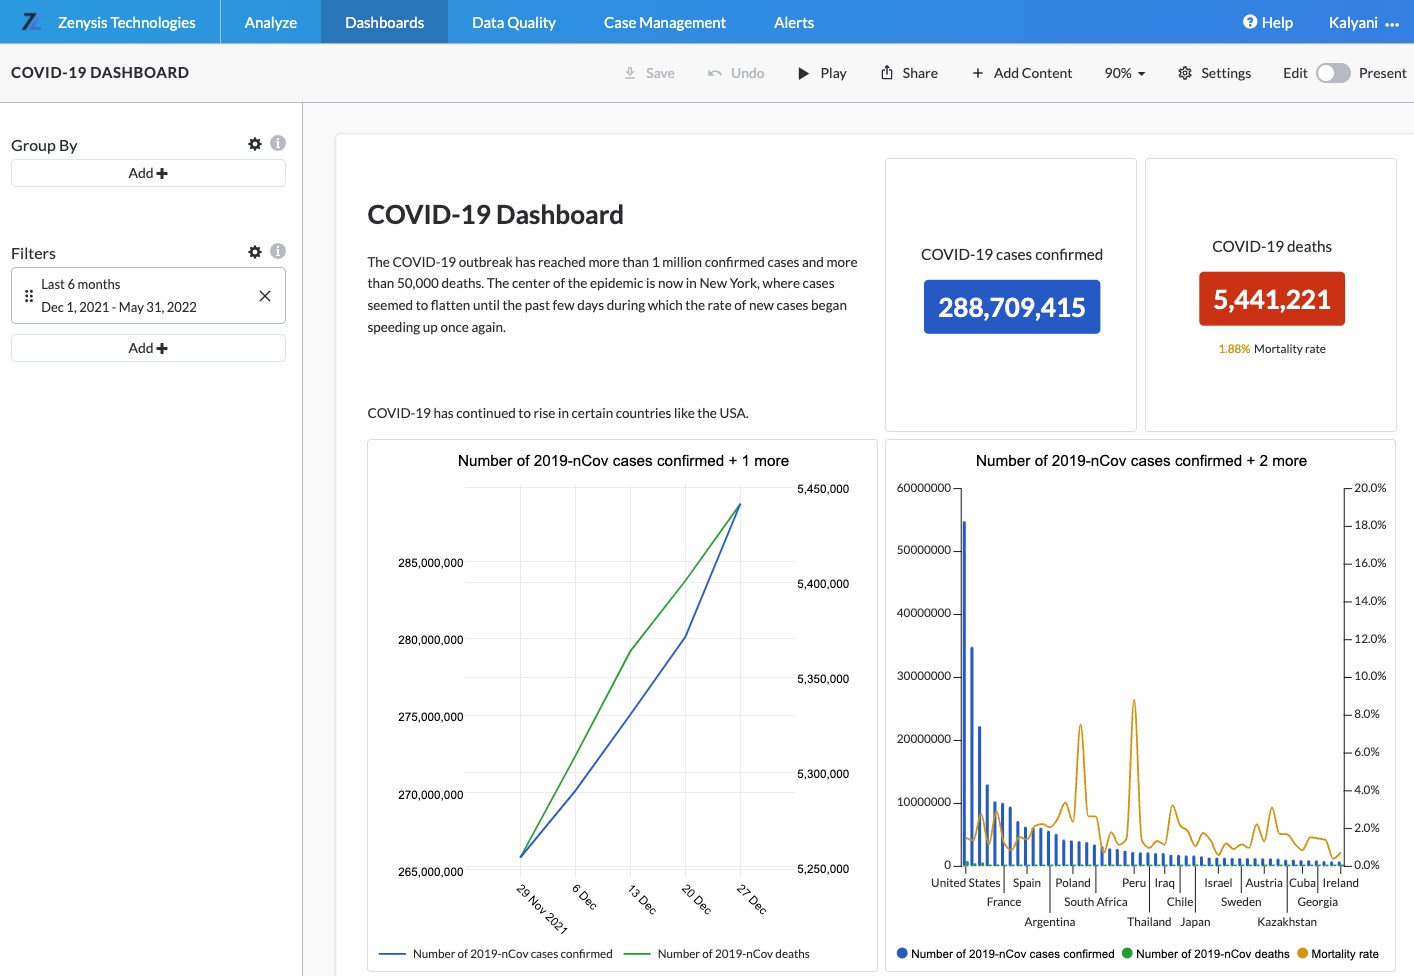
In the top navigation bar for a dashboard, users can click
- Play - enter a presentation mode with full screen view, where each tile is its own slide
- Share - export the dashboard as a link, email, or download
- Add content - add a text box, visualization, iFrame, spacer, or divider to the dashboard
- The percentage to modify page fit
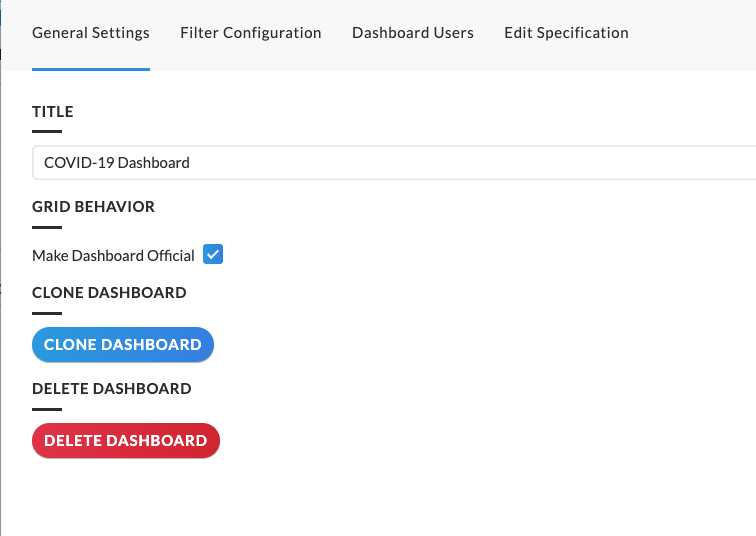
- Settings - modify the following capabilities of the dashboard:
An alert is a query that is constructed around a threshold of interest or a relationship between two indicators to you and your team. When these thresholds are crossed in the data, an alert is automatically triggered in the platform. Instead of retrospectively looking for how many cases of a certain disease were reported in a certain area, you can set up an alert that will proactively trigger an automated notification when a certain number of cases are reported in a given area. This is especially useful for epidemiological and data quality use cases.

The objective of Data Quality Lab (DQL) is to help you identify potential reporting and data quality issues for your indicators and provide you with tools to diagnose and investigate these issues. The information and tools in DQL allows you to attempt to diagnose the specific data quality issues the indicator has and the score could be used to assess trends or changes as a result of actions taken. DQL allows diagnostics of all types of indicators, even complex indicators integrated from other systems.
The aim of the Quality Score is to give you an at-a-glance idea of whether or not the user can trust an indicator's data. The things to be assessed as input to the score are shown in the tabs below, with their denominator representing their weight in the score. These inputs are inspired by the dimensions laid out in WHO's Data Quality Framework - and we will be adding more tabs to cover more dimensions of data quality over time.

There are two data quality areas being assessed in DQL:
- Indicator Characteristics: this tab summarizes some basic facts about the indicator that may impact reporting or data quality, as well as explaining how they affect the score. After choosing an indicator, you’ll see cards displaying the indicator’s age, time since the last report, reporting completeness trend and estimated reporting periods. Both age and freshness are counted in terms of the number of estimated reporting periods (i.e. months if it’s a monthly report).
- Reporting Completeness: The score is based on the consistency in the number of reports received per reporting period. The more consistent, the better it is for the score. Within this tab, there are investigative tools designed to enable you to identify where reporting completeness issues may be coming from.
The Admin App is used by administrators of the platform to manage user access and permissions. The interface allows administrators to give or revoke access to users, to create and manage user groups and to edit access and permissions levels for users on the platform.
The Admin option is only available to users with administrative permissions, which can only be granted by another platform administrator.
To access the Admin App, click on the menu button at the top right corner of your screen and then click on ‘Admin.’ This will take you to the Admin page where you will notice four tabs:
- Users: view and manage platform users or invite new users
- Groups: view and manage platform groups or create new ones
- Role Management: view and manage platform roles or create new ones
- Site Configuration: manage platform settings like the default homepage

Data Catalog enables Data Managers to manage their indicators and augment them with useful information. Specifically this allows:
- Organizing datasets into a hierarchical structure that is surfaced in the Analyze tool
- Hide or make visible specific groups of data
- Provide useful metadata to indicators (e.g. definitions, operations etc.)
- Create new custom calculations
In Data Catalog, the Analyze hierarchical selector is organized in the form of a directory table that resembles a ‘file system’. This allows us to navigate and organize categories (folders) and indicators (files) in a familiar format. The indicators themselves are the files in the file system. Each file is its own page called the Indicator Details page. This page contains metadata about each indicator and options to edit that metadata.

The Data Digest tool is an internal tool that can be used by administrators to manage aspects of the integration pipeline. For example:
- Pipeline overview: this includes information about the most recent pipeline and a summary of location matching.
- Data source overview: this includes an overview of the number of data points, indicators, mapped and unmatched location for each data source integrated via the pipeline.
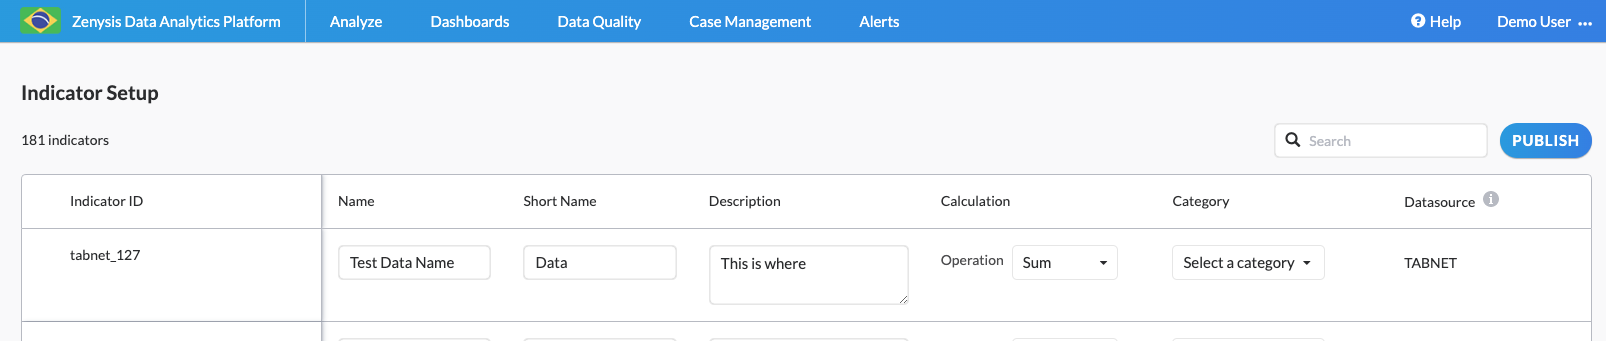
The Field Setup App allows users to set up fields that are in Druid and not yet in Data Catalog, and therefore visible to end users to be queried.
The app is populated with the id, data source, and default sum calculation for each field and users can edit the name, description, calculation, and category. Once the fields are ready, they can be published to Data Catalog.