Working with maps
A warehouse map can display all kinds of data, from inventory levels to traffic patterns. In this section, we'll cover how to annotate a map, cluster and bin data, and add custom drawings.
The simplest way to add content to a map is with the map's <Annotation> component, which wraps SVG content.
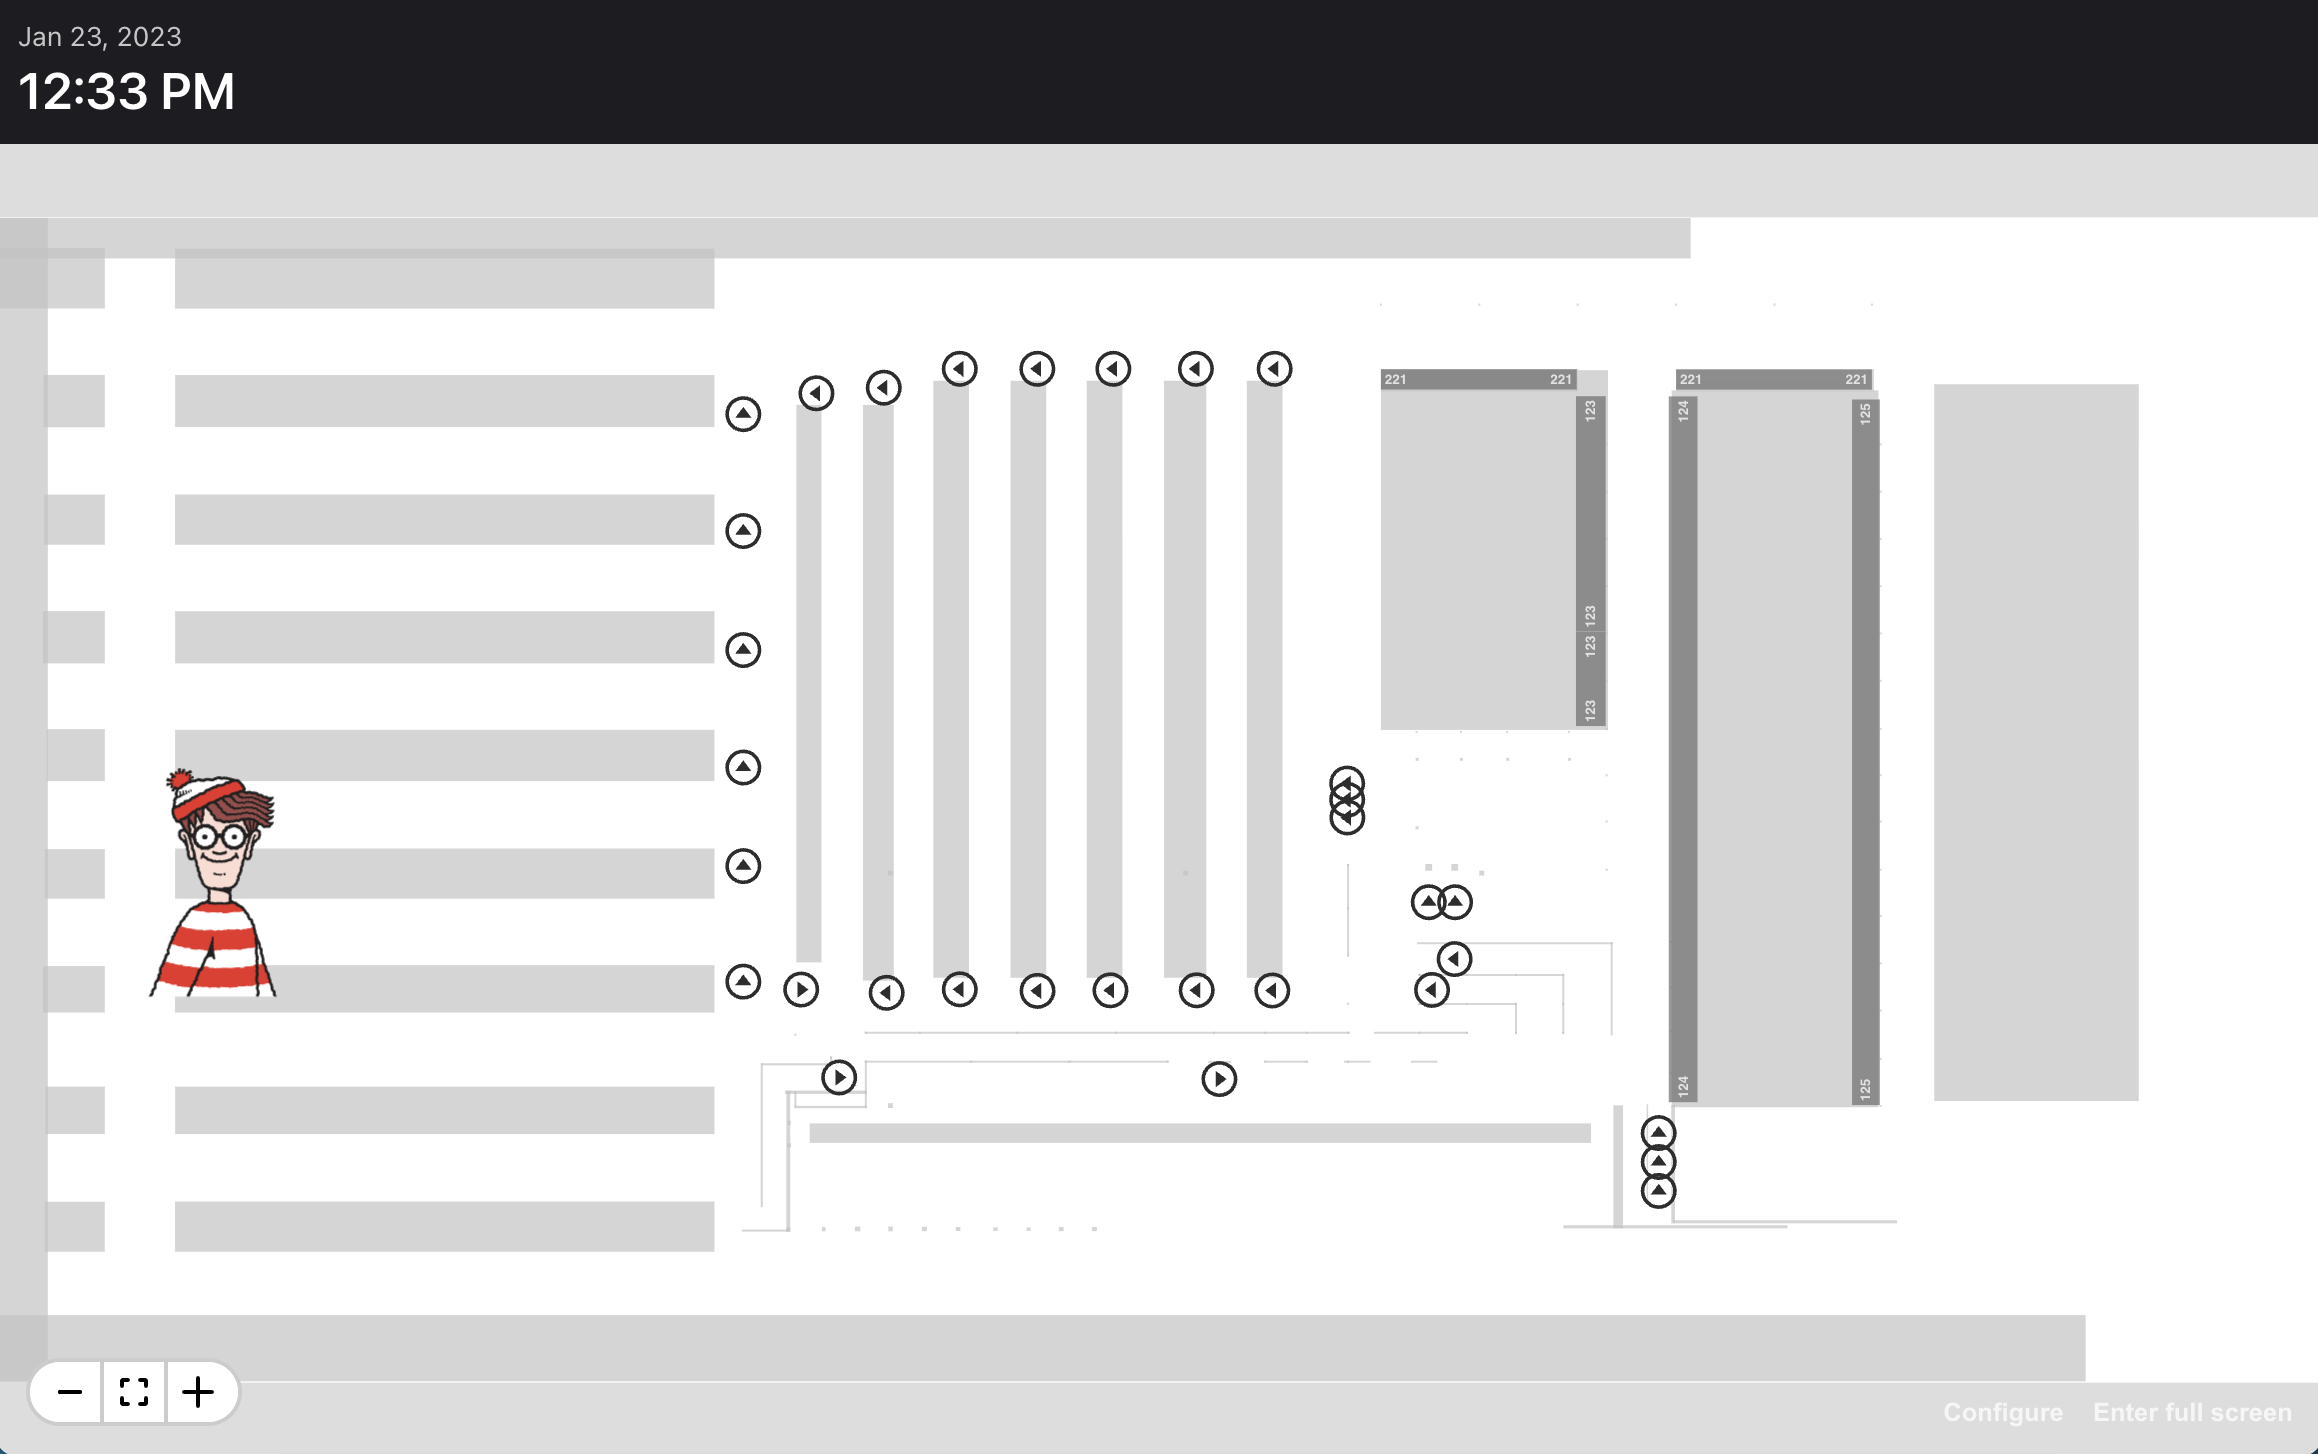
In the following example, we'll place an image on the map at the point 30, 30 (meters) using the <Annotation> component. Note the map's coordinate system originates at the bottom left corner, while the annotation's coordinate system originates at the top left corner. Therefore we adjust the image such that it is visually centered at its own (0,0).
import { Annotation, Map as MapElement, ZoomControl } from '@sixriver/map-element';

import { Clock } from '../../components/clock/Clock';
import { Dashboard } from '../../components/dashboard/Dashboard';
import { Directory } from '../../directory';
import { useFetch } from '../../hooks/useFetch';
import { useMapFile } from '../../hooks/useMapFile';
import { Color } from '../../utils/theme';
import waldo from './images/waldo.svg';

export function MapDemo() {
  const url = Directory.MAP_MANAGER_URL + '/map.6rms';
  const { data, error } = useFetch<ArrayBuffer>(url, { binary: true });
  const { mapStack } = useMapFile(data);

  return (
    <Dashboard layout="one-over-one" breakpoints={0.1} error={error}>
      <Dashboard.Panel padding={1.5}>
        <Clock />
      </Dashboard.Panel>
      <Dashboard.Panel color={Color.LightGray}>
        {mapStack ? (
          <MapElement
            mapStack={mapStack}
            showWorkflowPoint
            showRack
            showImpassable
            enablePanControl
          >
            <ZoomControl position="bottomleft" />
            <Annotation x={30} y={30} scale="inherit">
              <image
                href={waldo}
                width={8}
                style={{
                  transformBox: 'fill-box',
                  transform: 'translate(-50%, -50%)',
                }}
              />
            </Annotation>
          </MapElement>
        ) : null}
      </Dashboard.Panel>
    </Dashboard>
  );
}Unlike the web browser's coordinate system, which originates at the top left corner, the map's coordinate system originates at the bottom left corner (like a graph).
And unlike the browser's coordinate system, which uses pixels, the map's coordinate system uses meters.
In the following example, the annotation will appear 30 meters east and 30 meters north of the map's 0,0 point, and the <image> will appear to be 8 meters wide:
<Annotation x={30} y={30} scale="inherit">
  <image href={waldo} width={8} ... />
</Annotation>The map's <Annotation> component supports two methods of scaling: "inherit" (the default) and "ignore."
When "inherit", the annotation scales with the map as the user zooms:
<Annotation x={30} y={30} scale="inherit">
  <image href={waldo} width={8} ... />
</Annotation>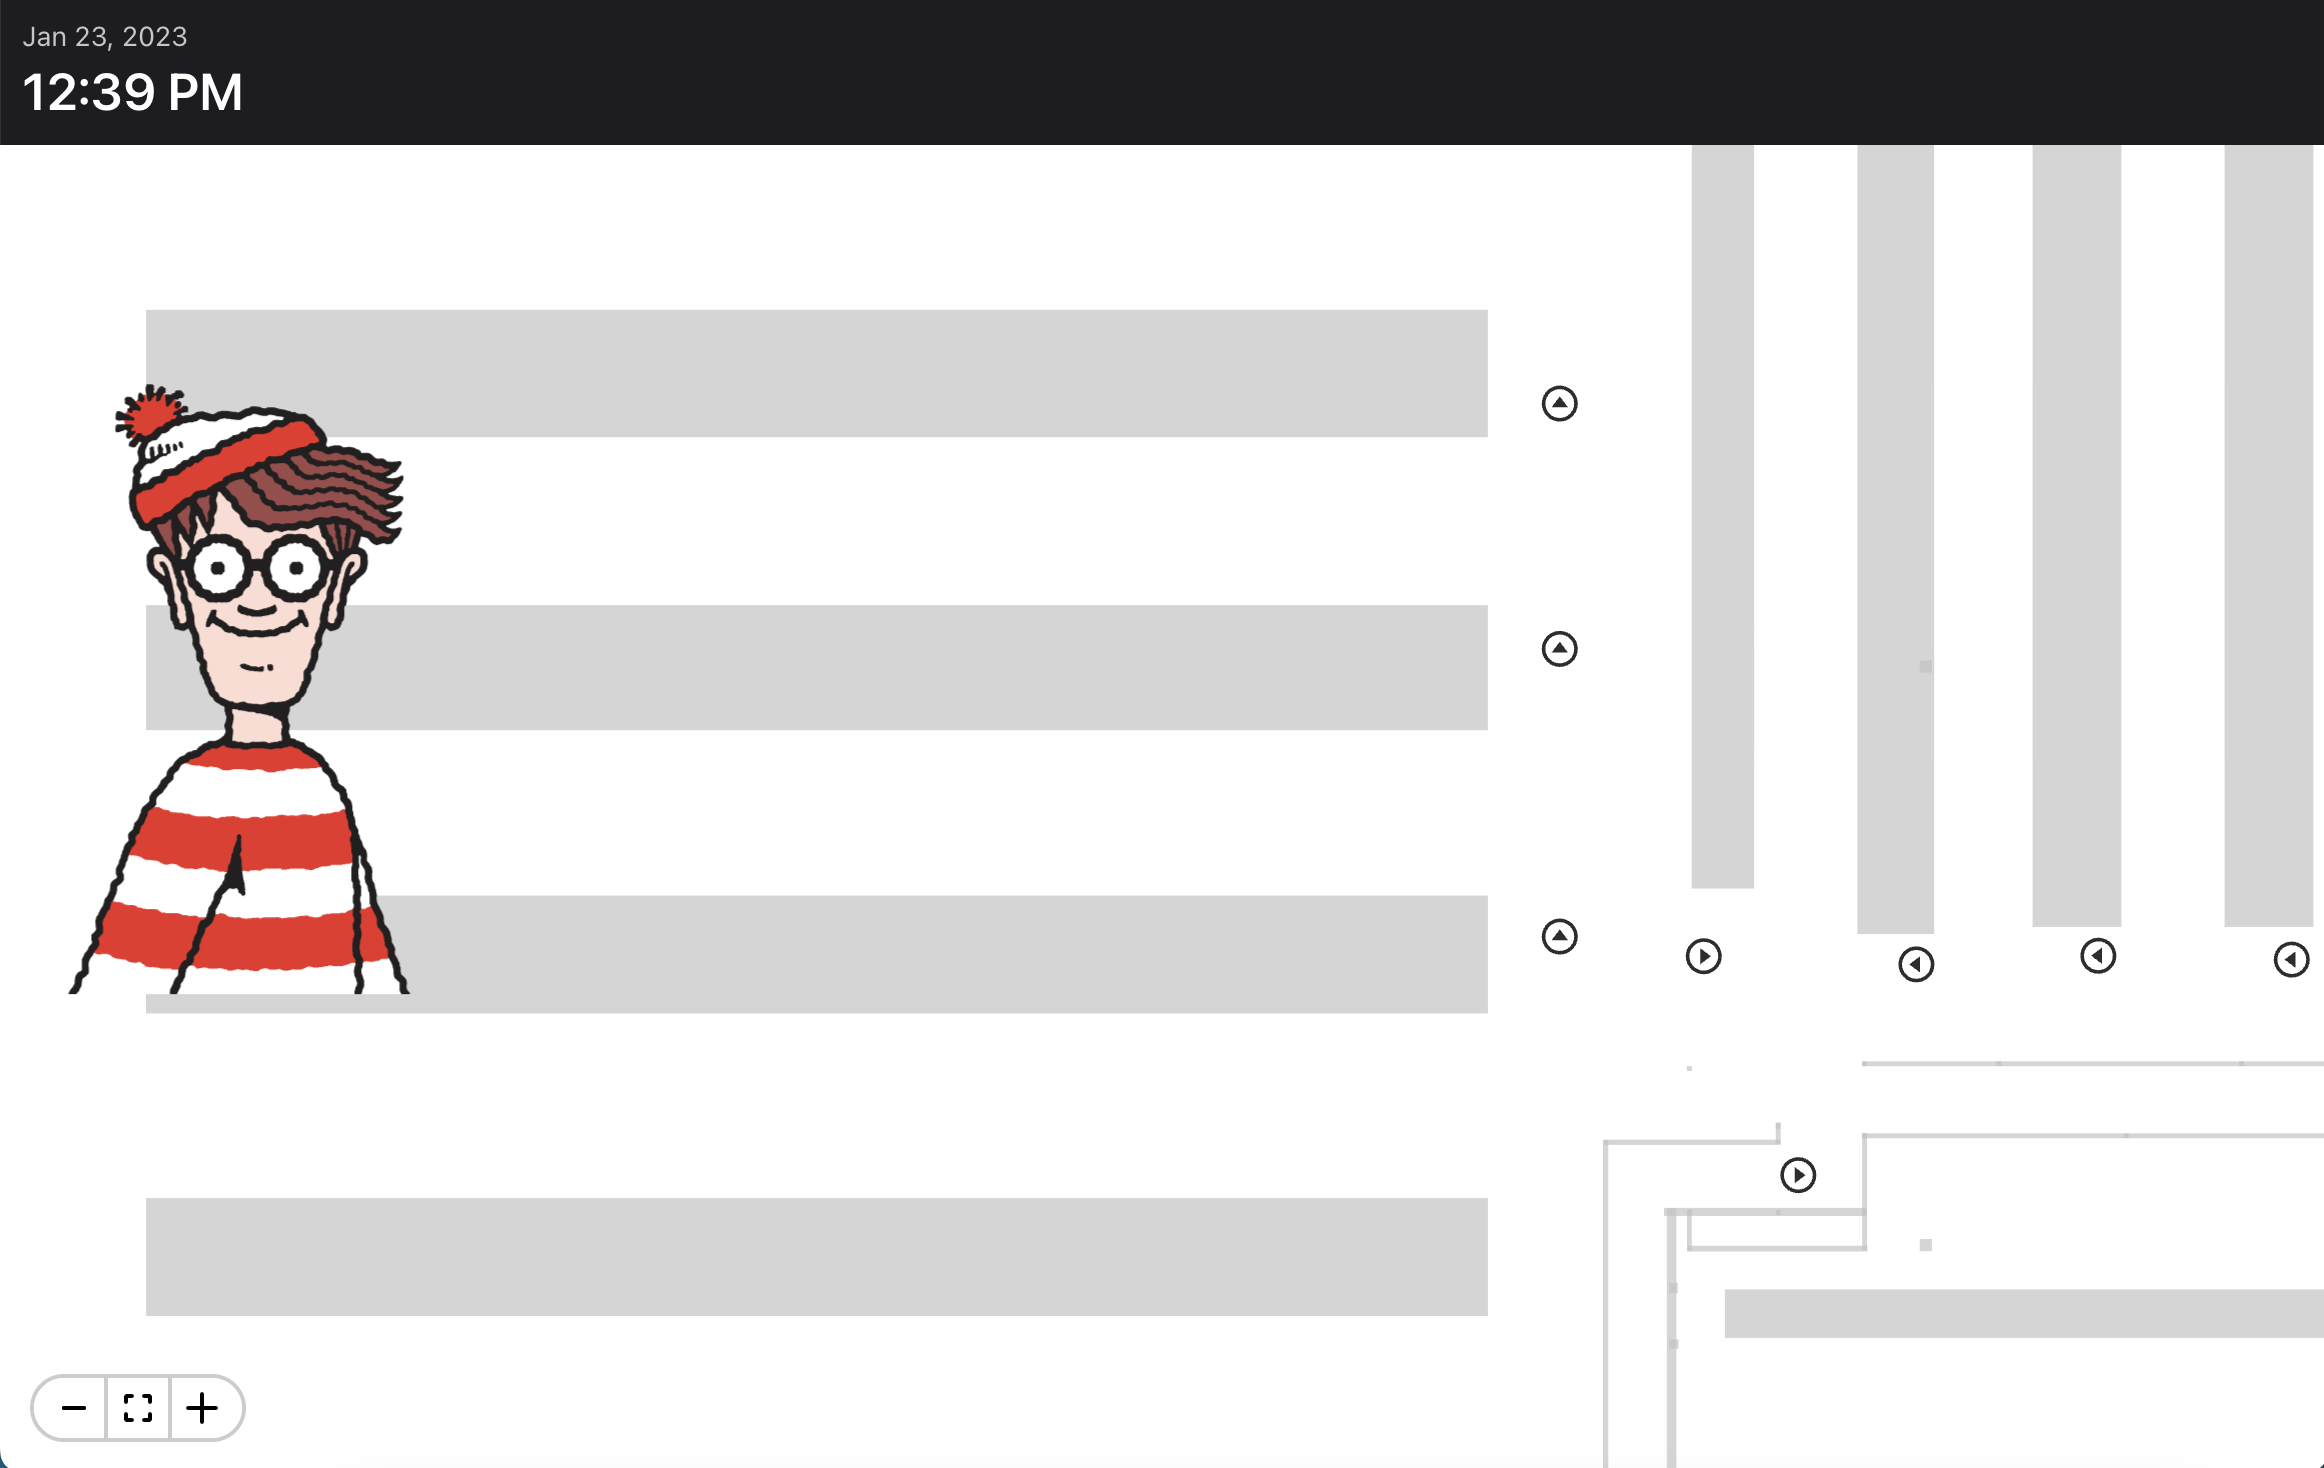
When "ignore", the annotation maintains a constant size as the user zooms. This is useful if you want to create pins or other markers that highlight points in the map but have no specific area:
<Annotation x={30} y={30} scale="ignore">
  <image href={waldo} width={8} ... />
</Annotation>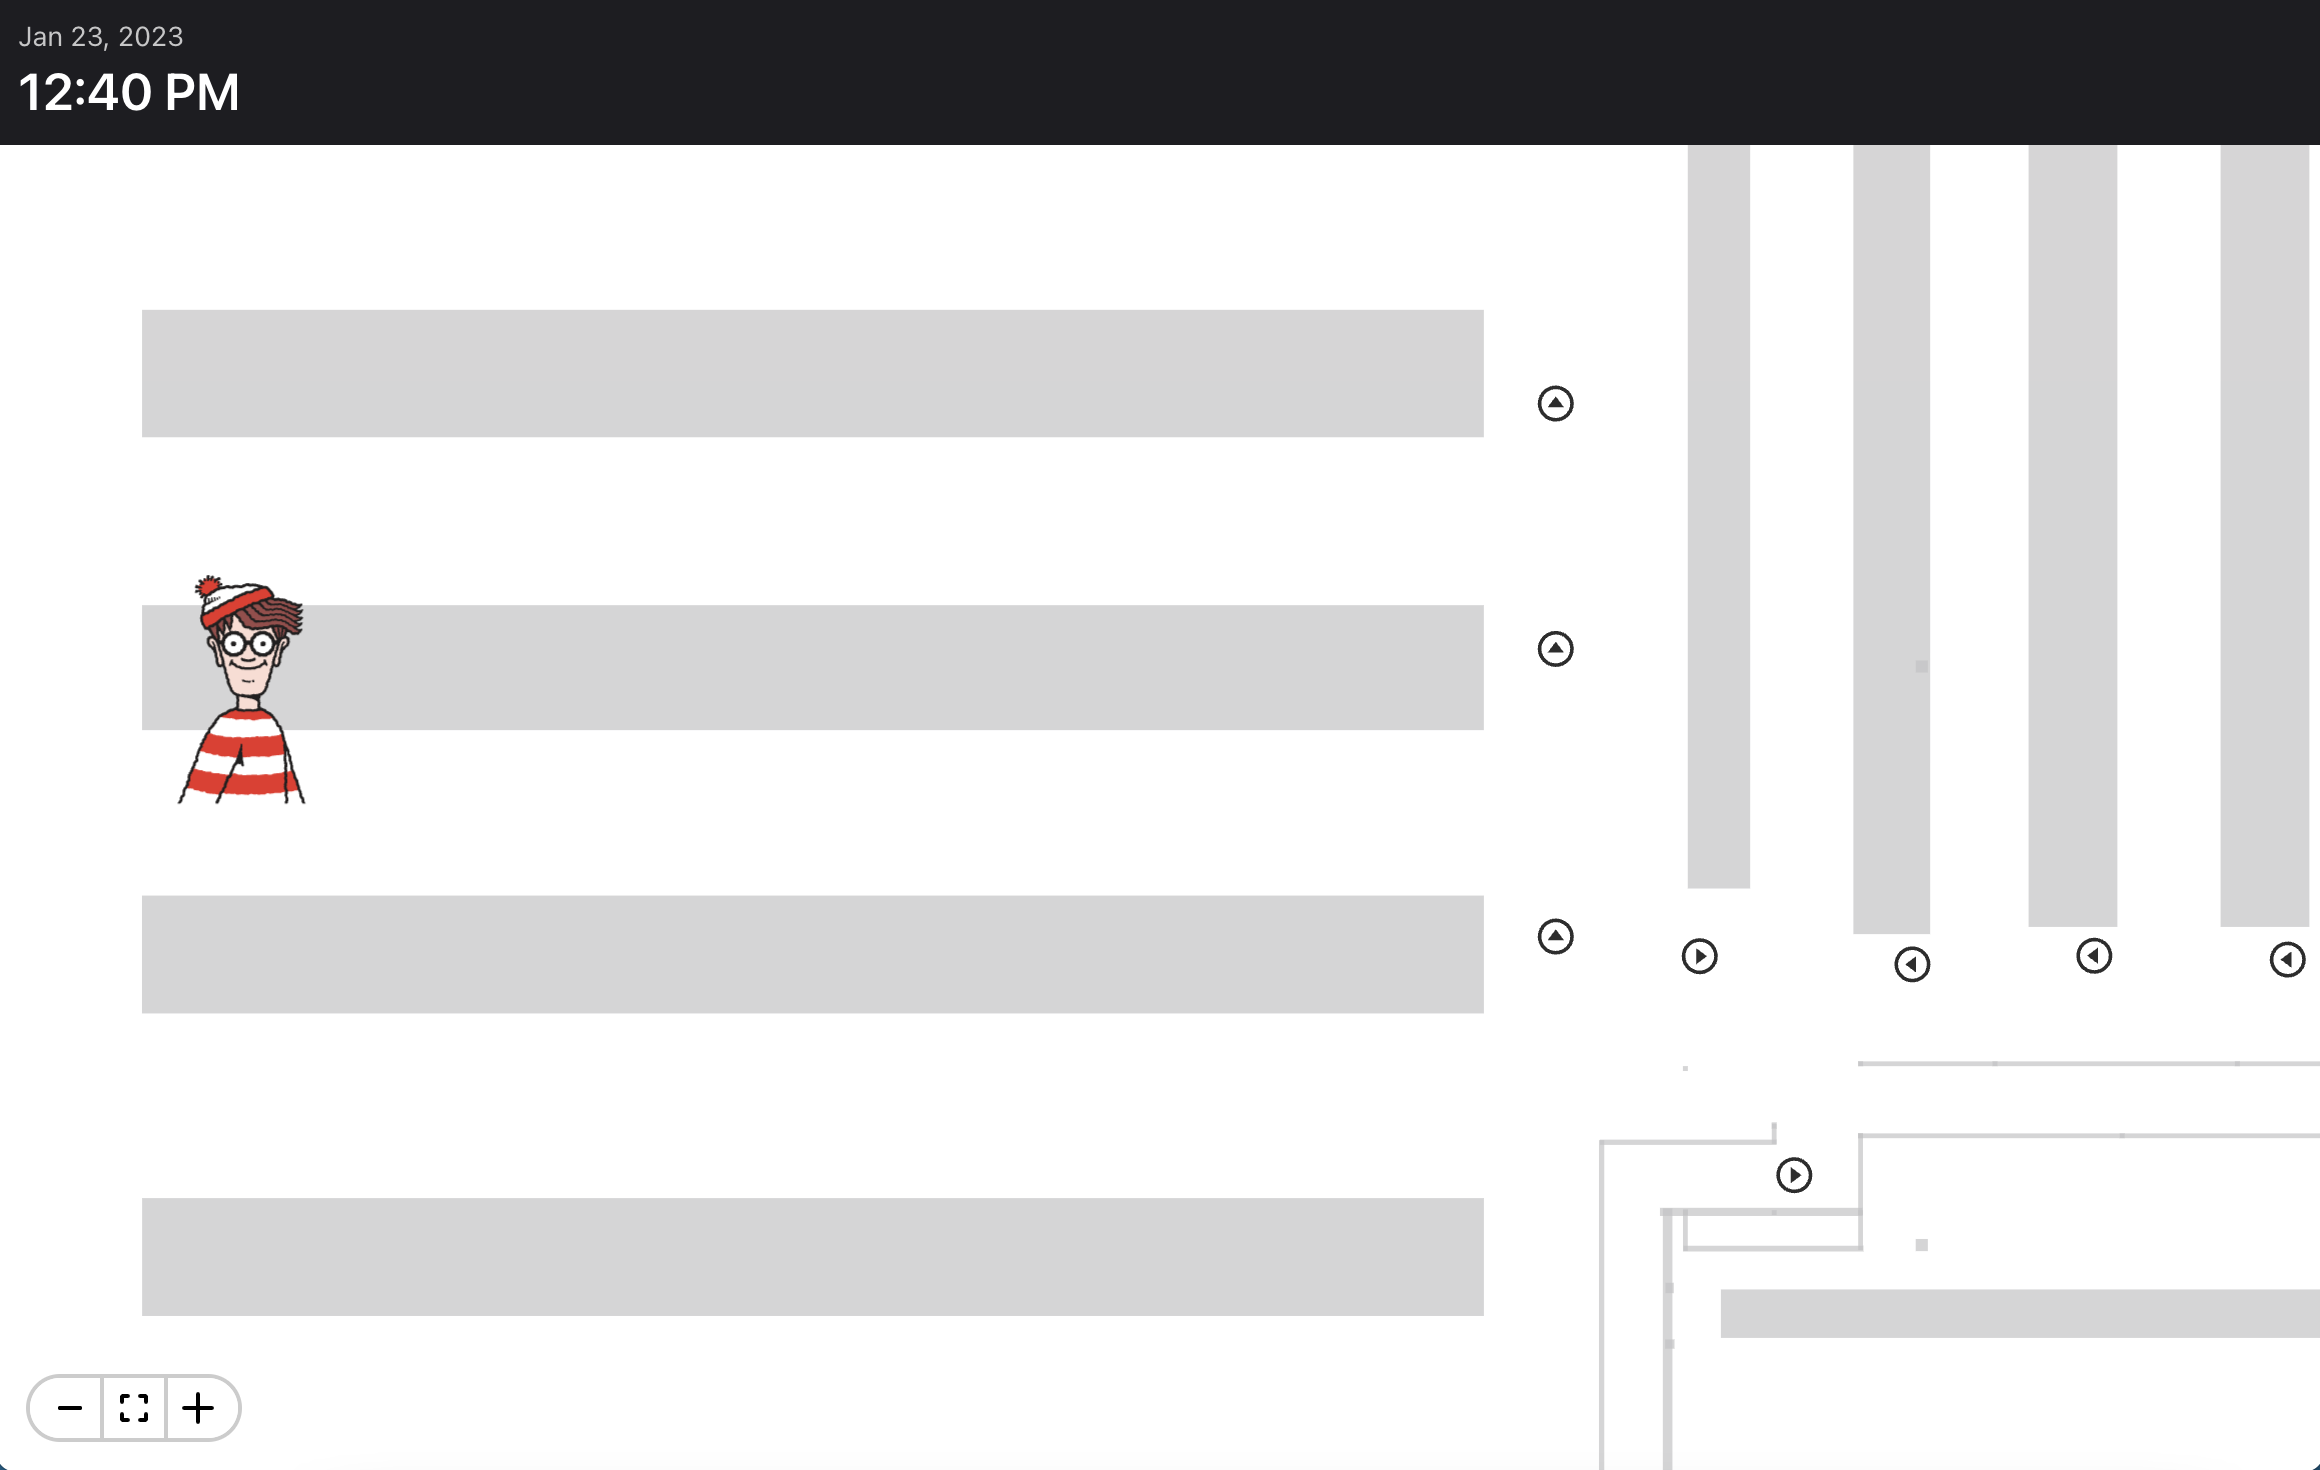
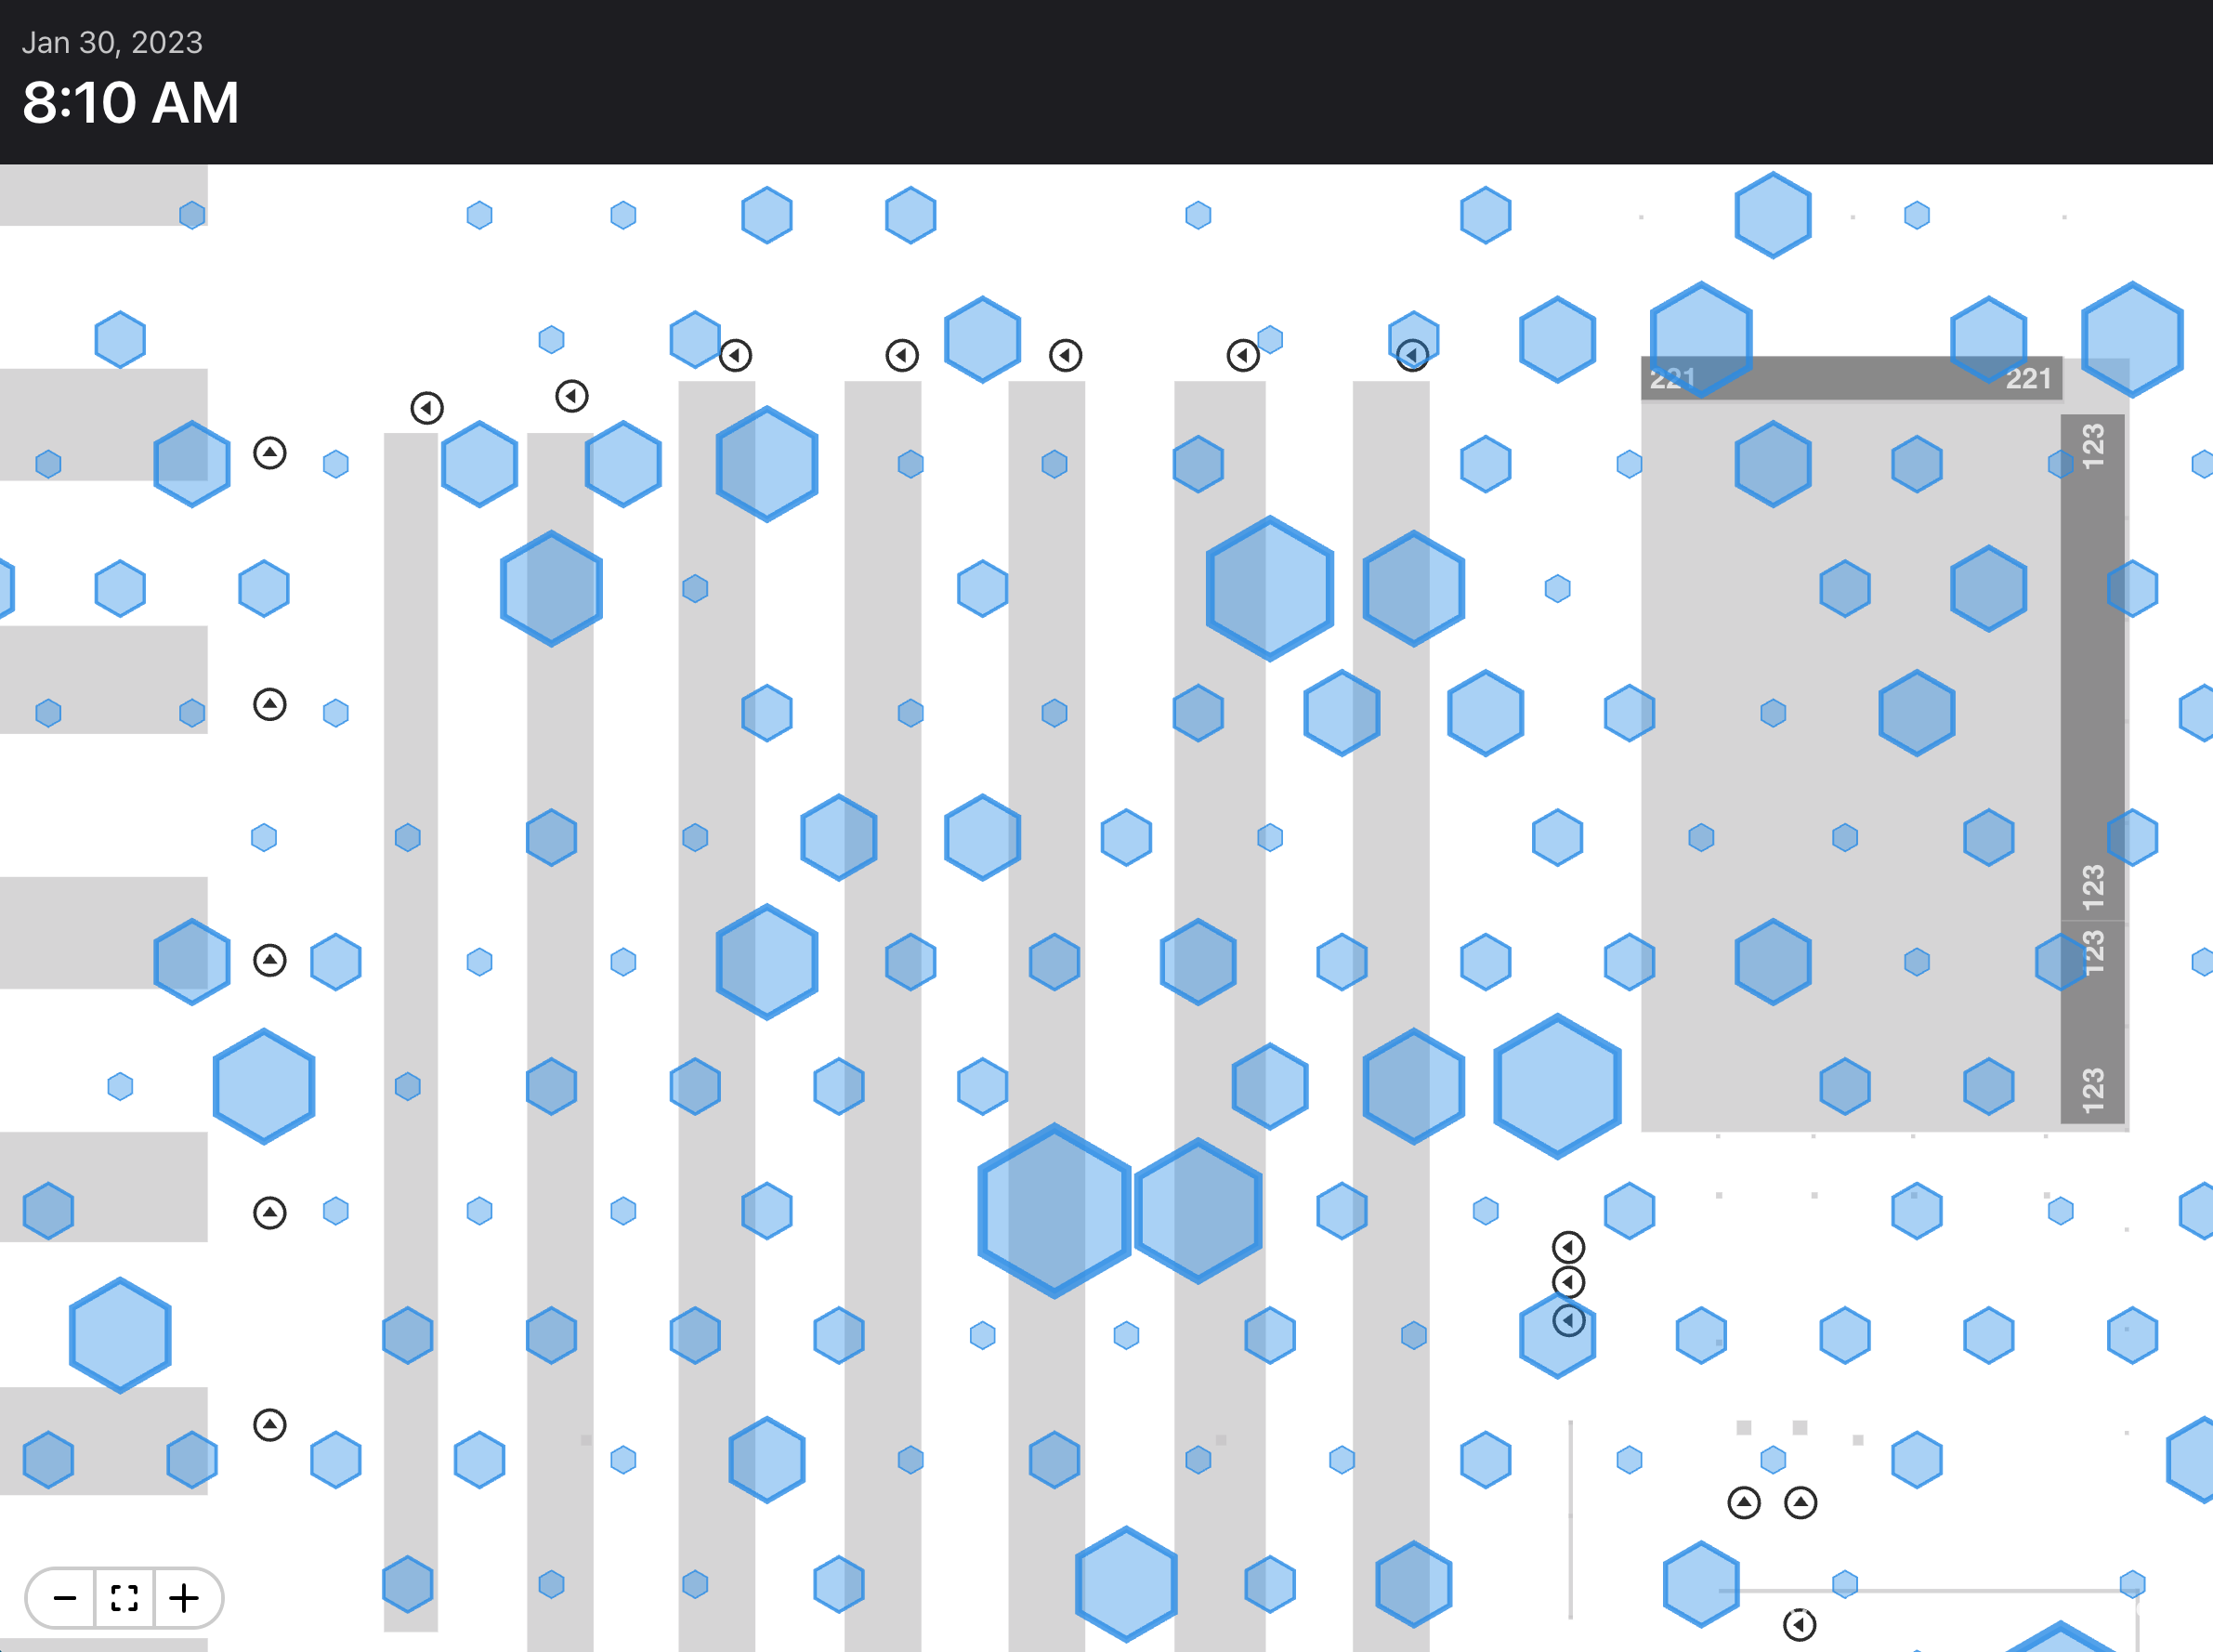
Annotations may be used to pinpoint data on the map, as demonstrated by the <Pin> component:
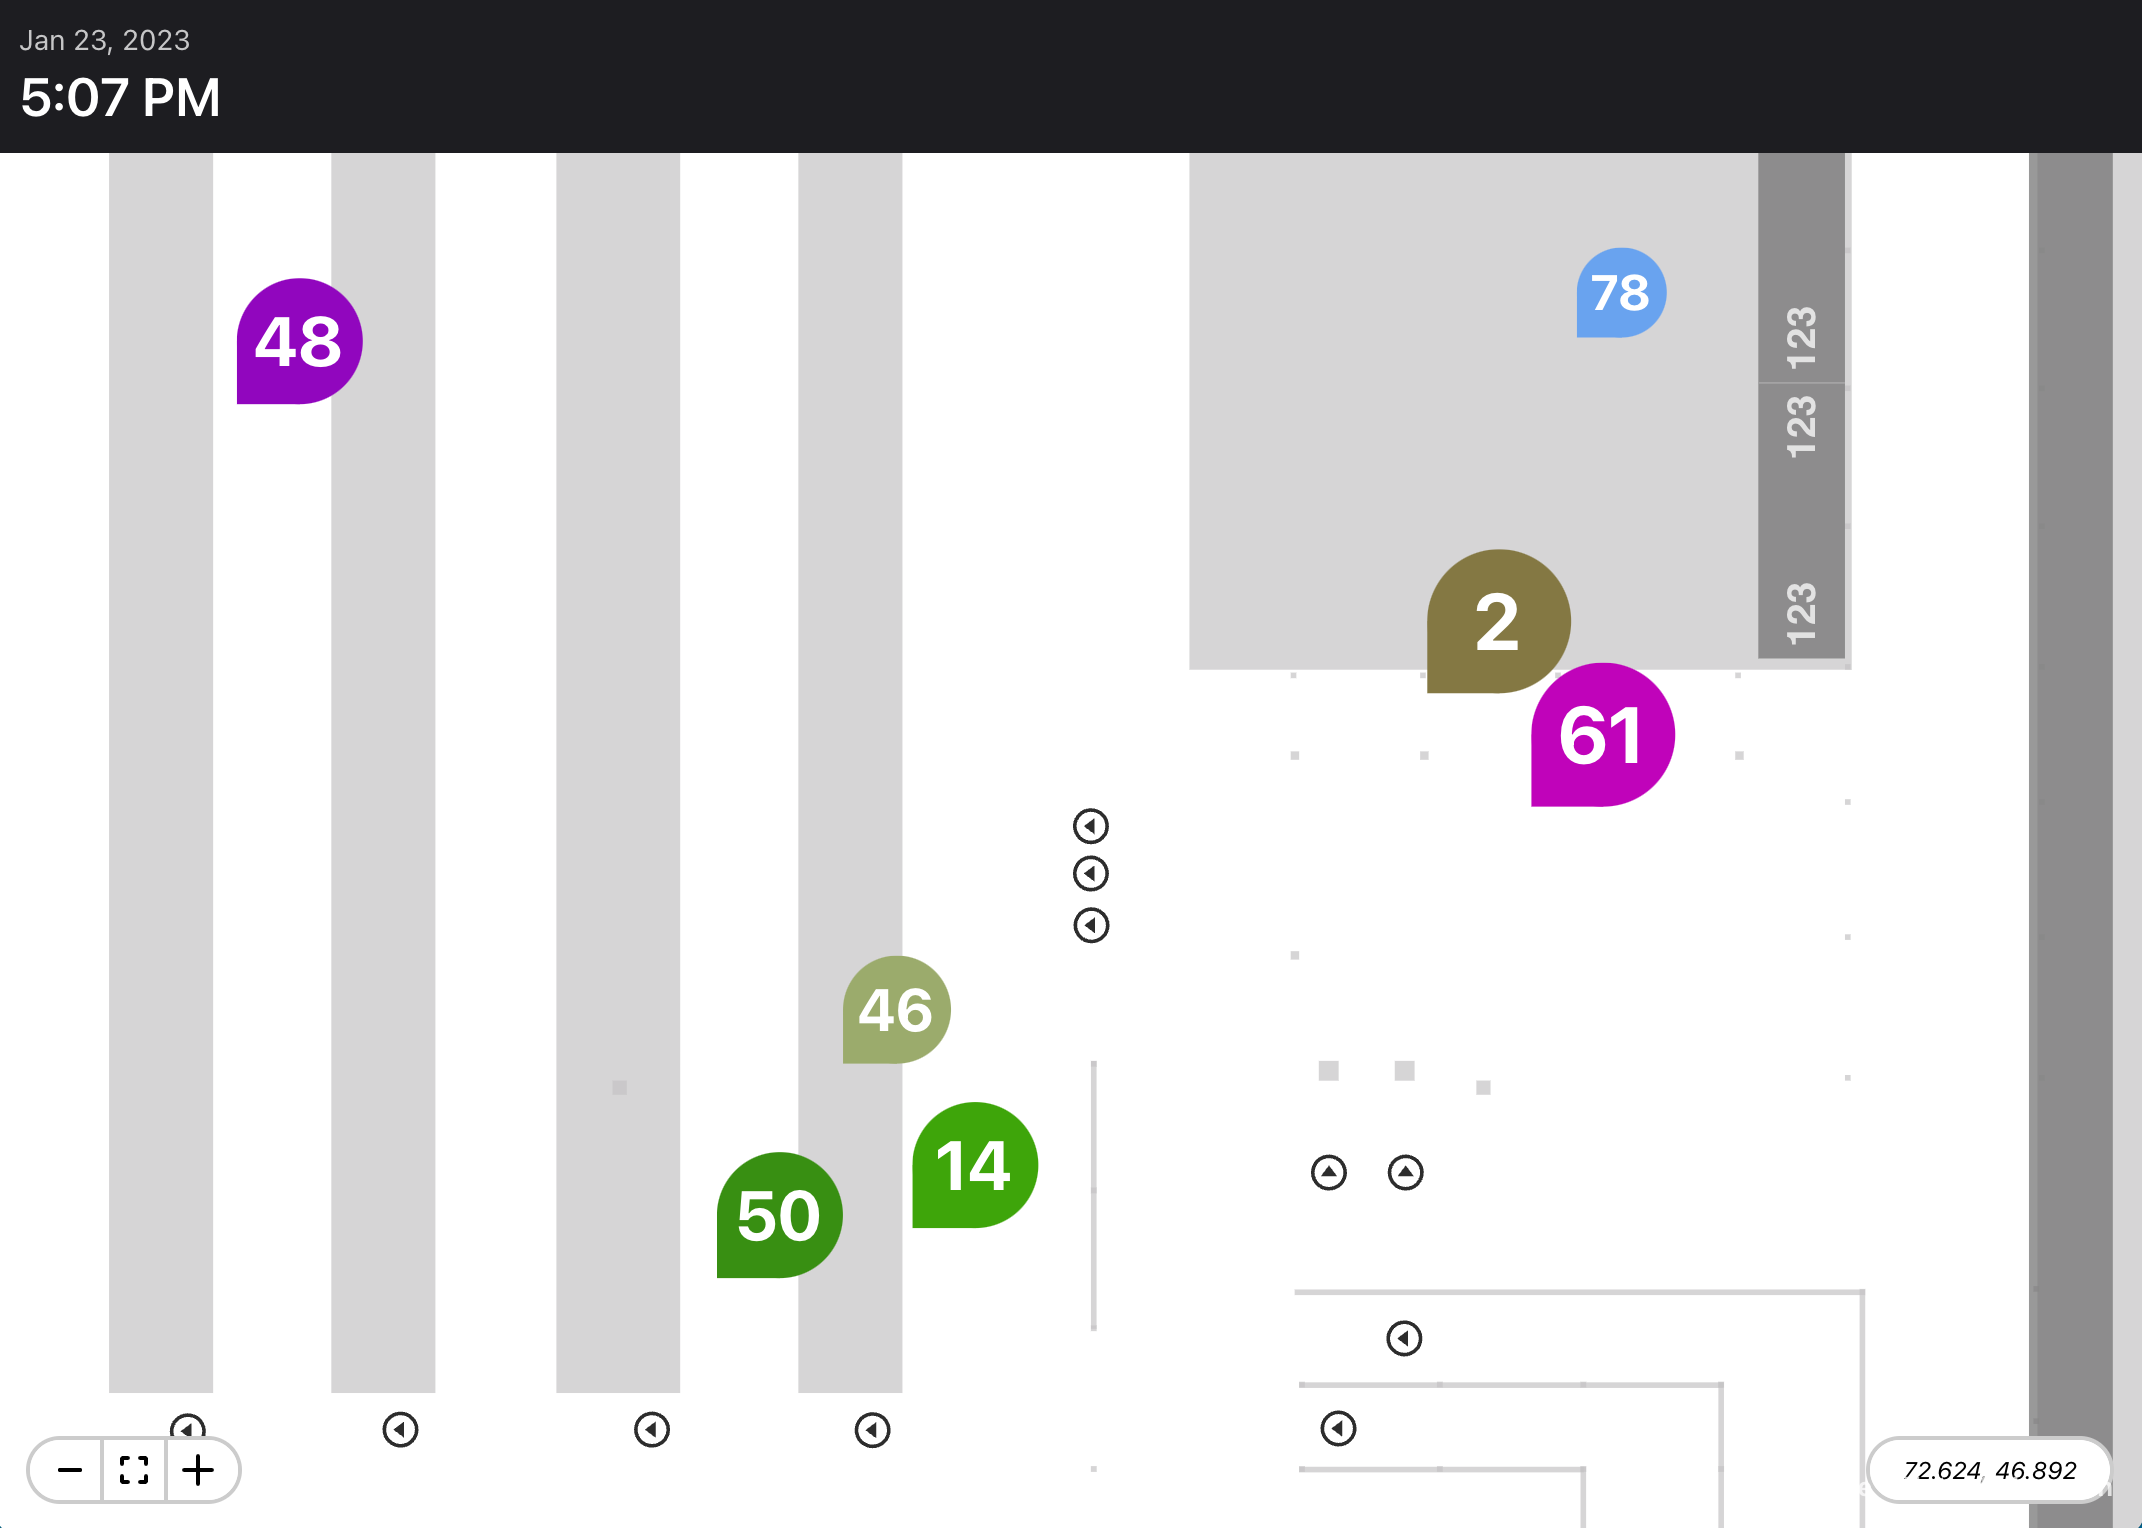
But too many annotations are likely to overlap each other:
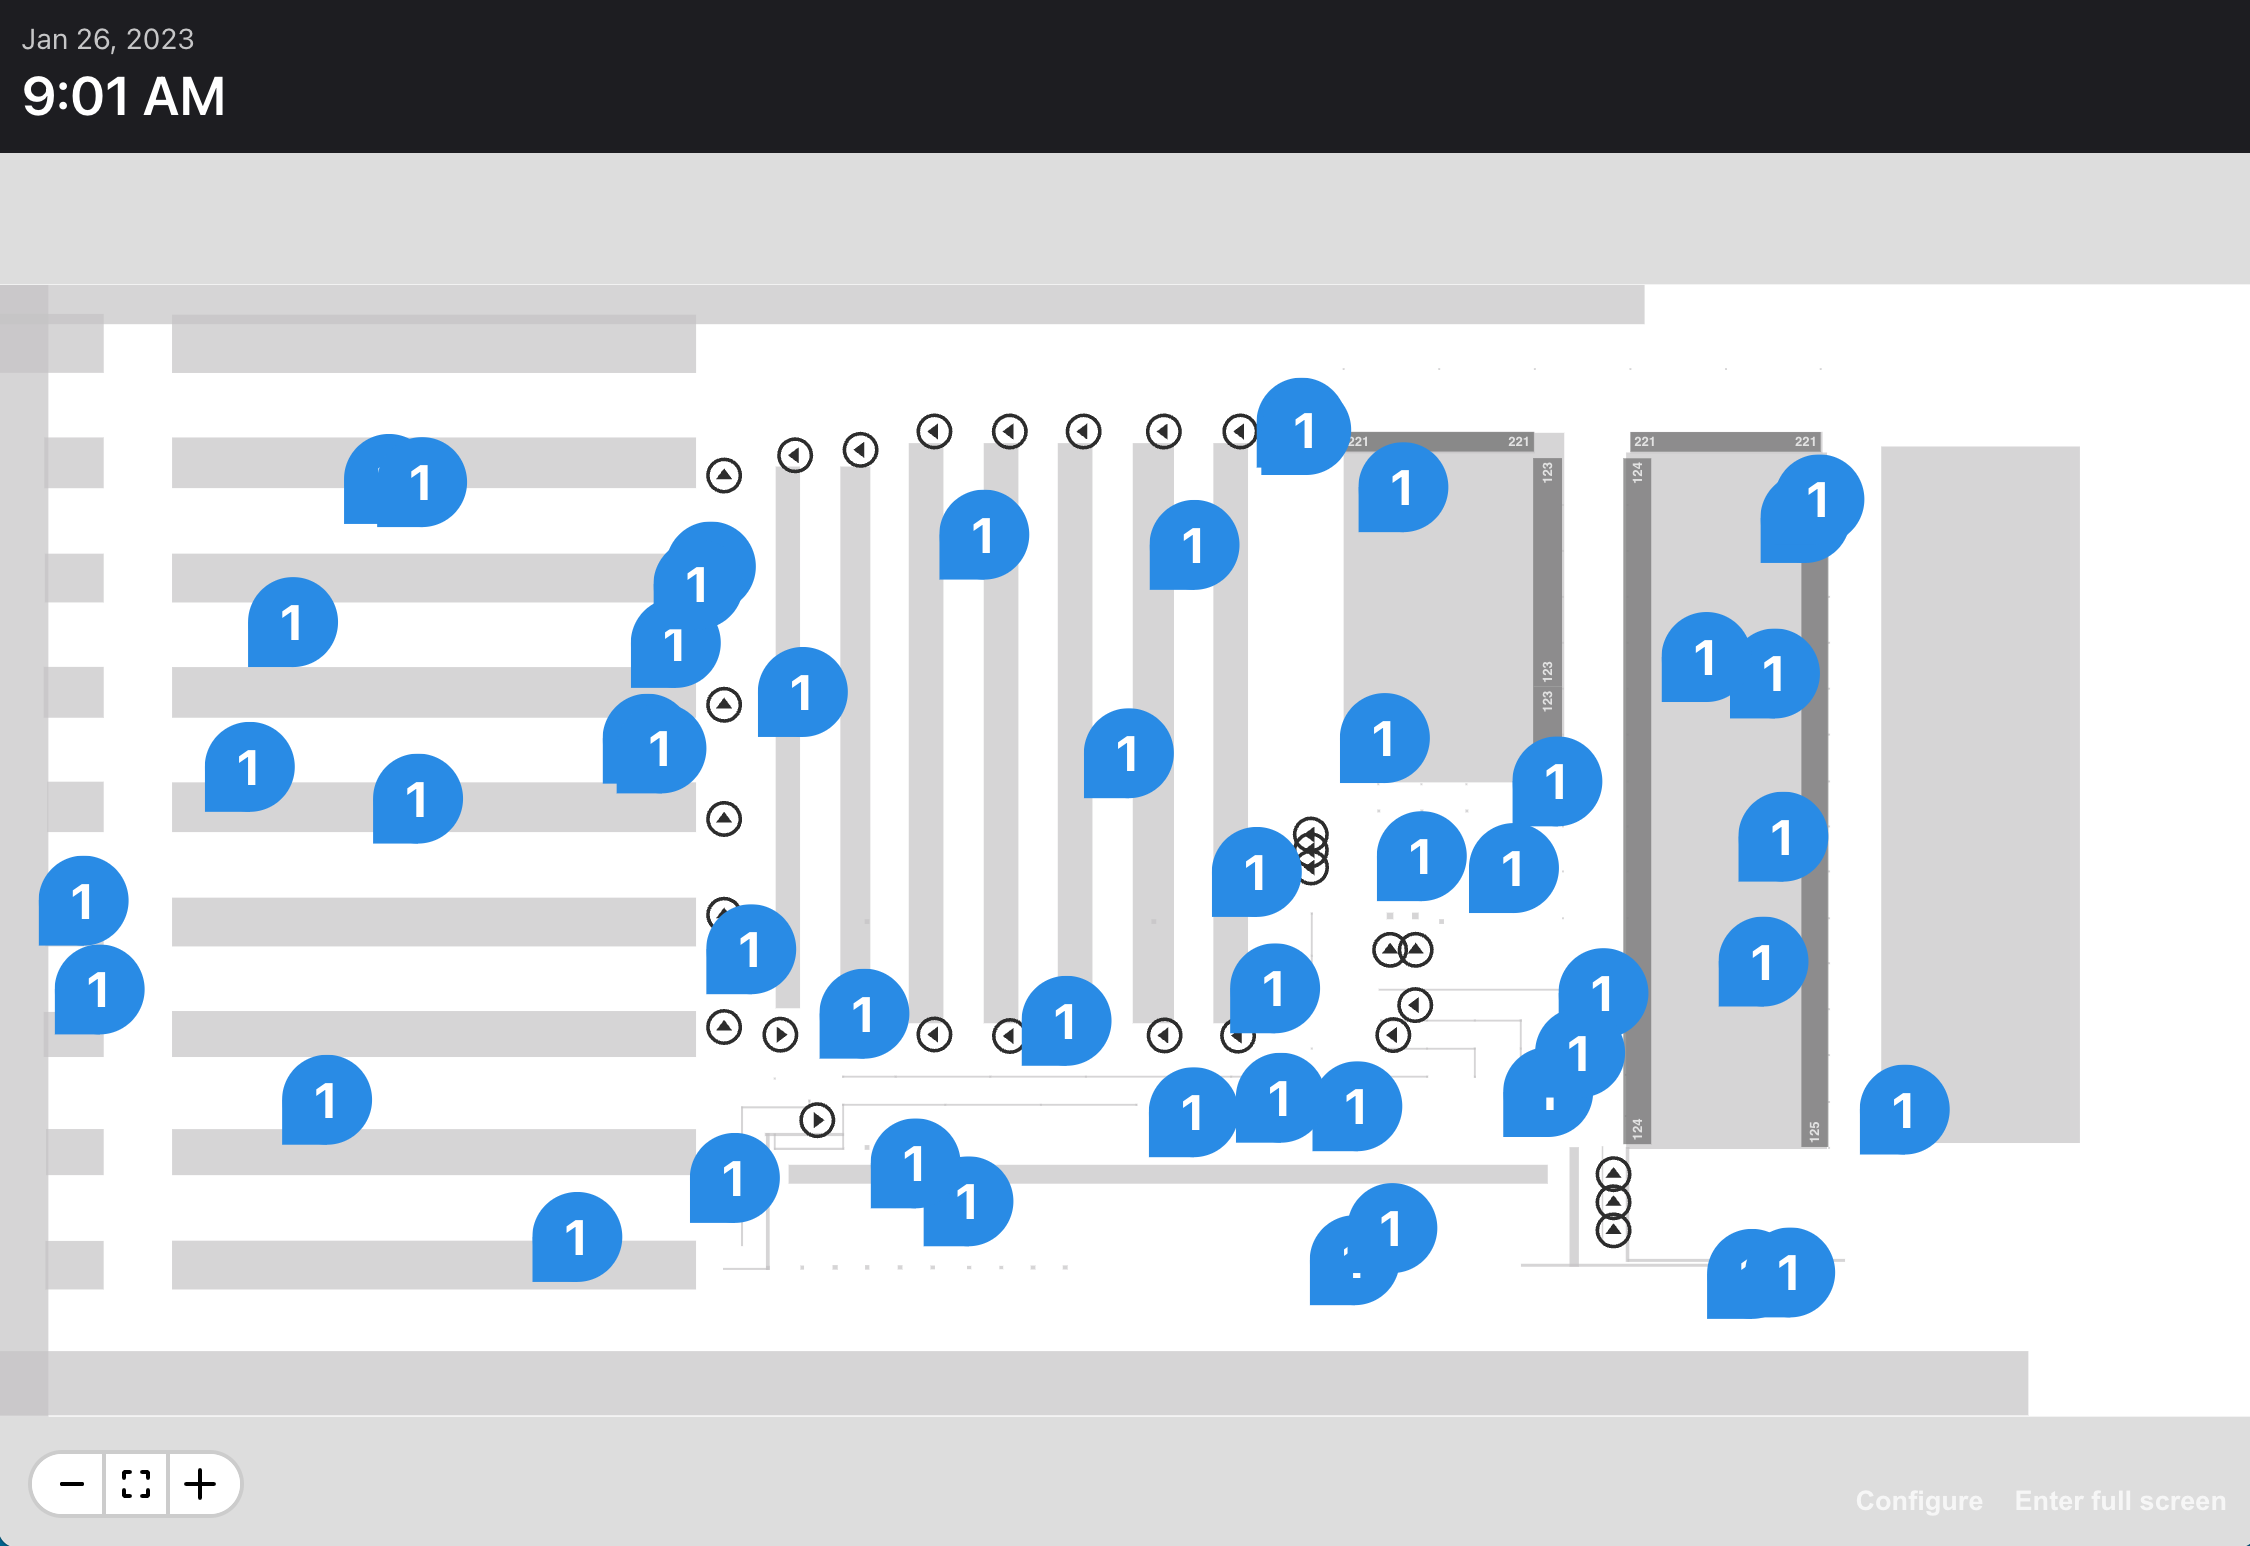
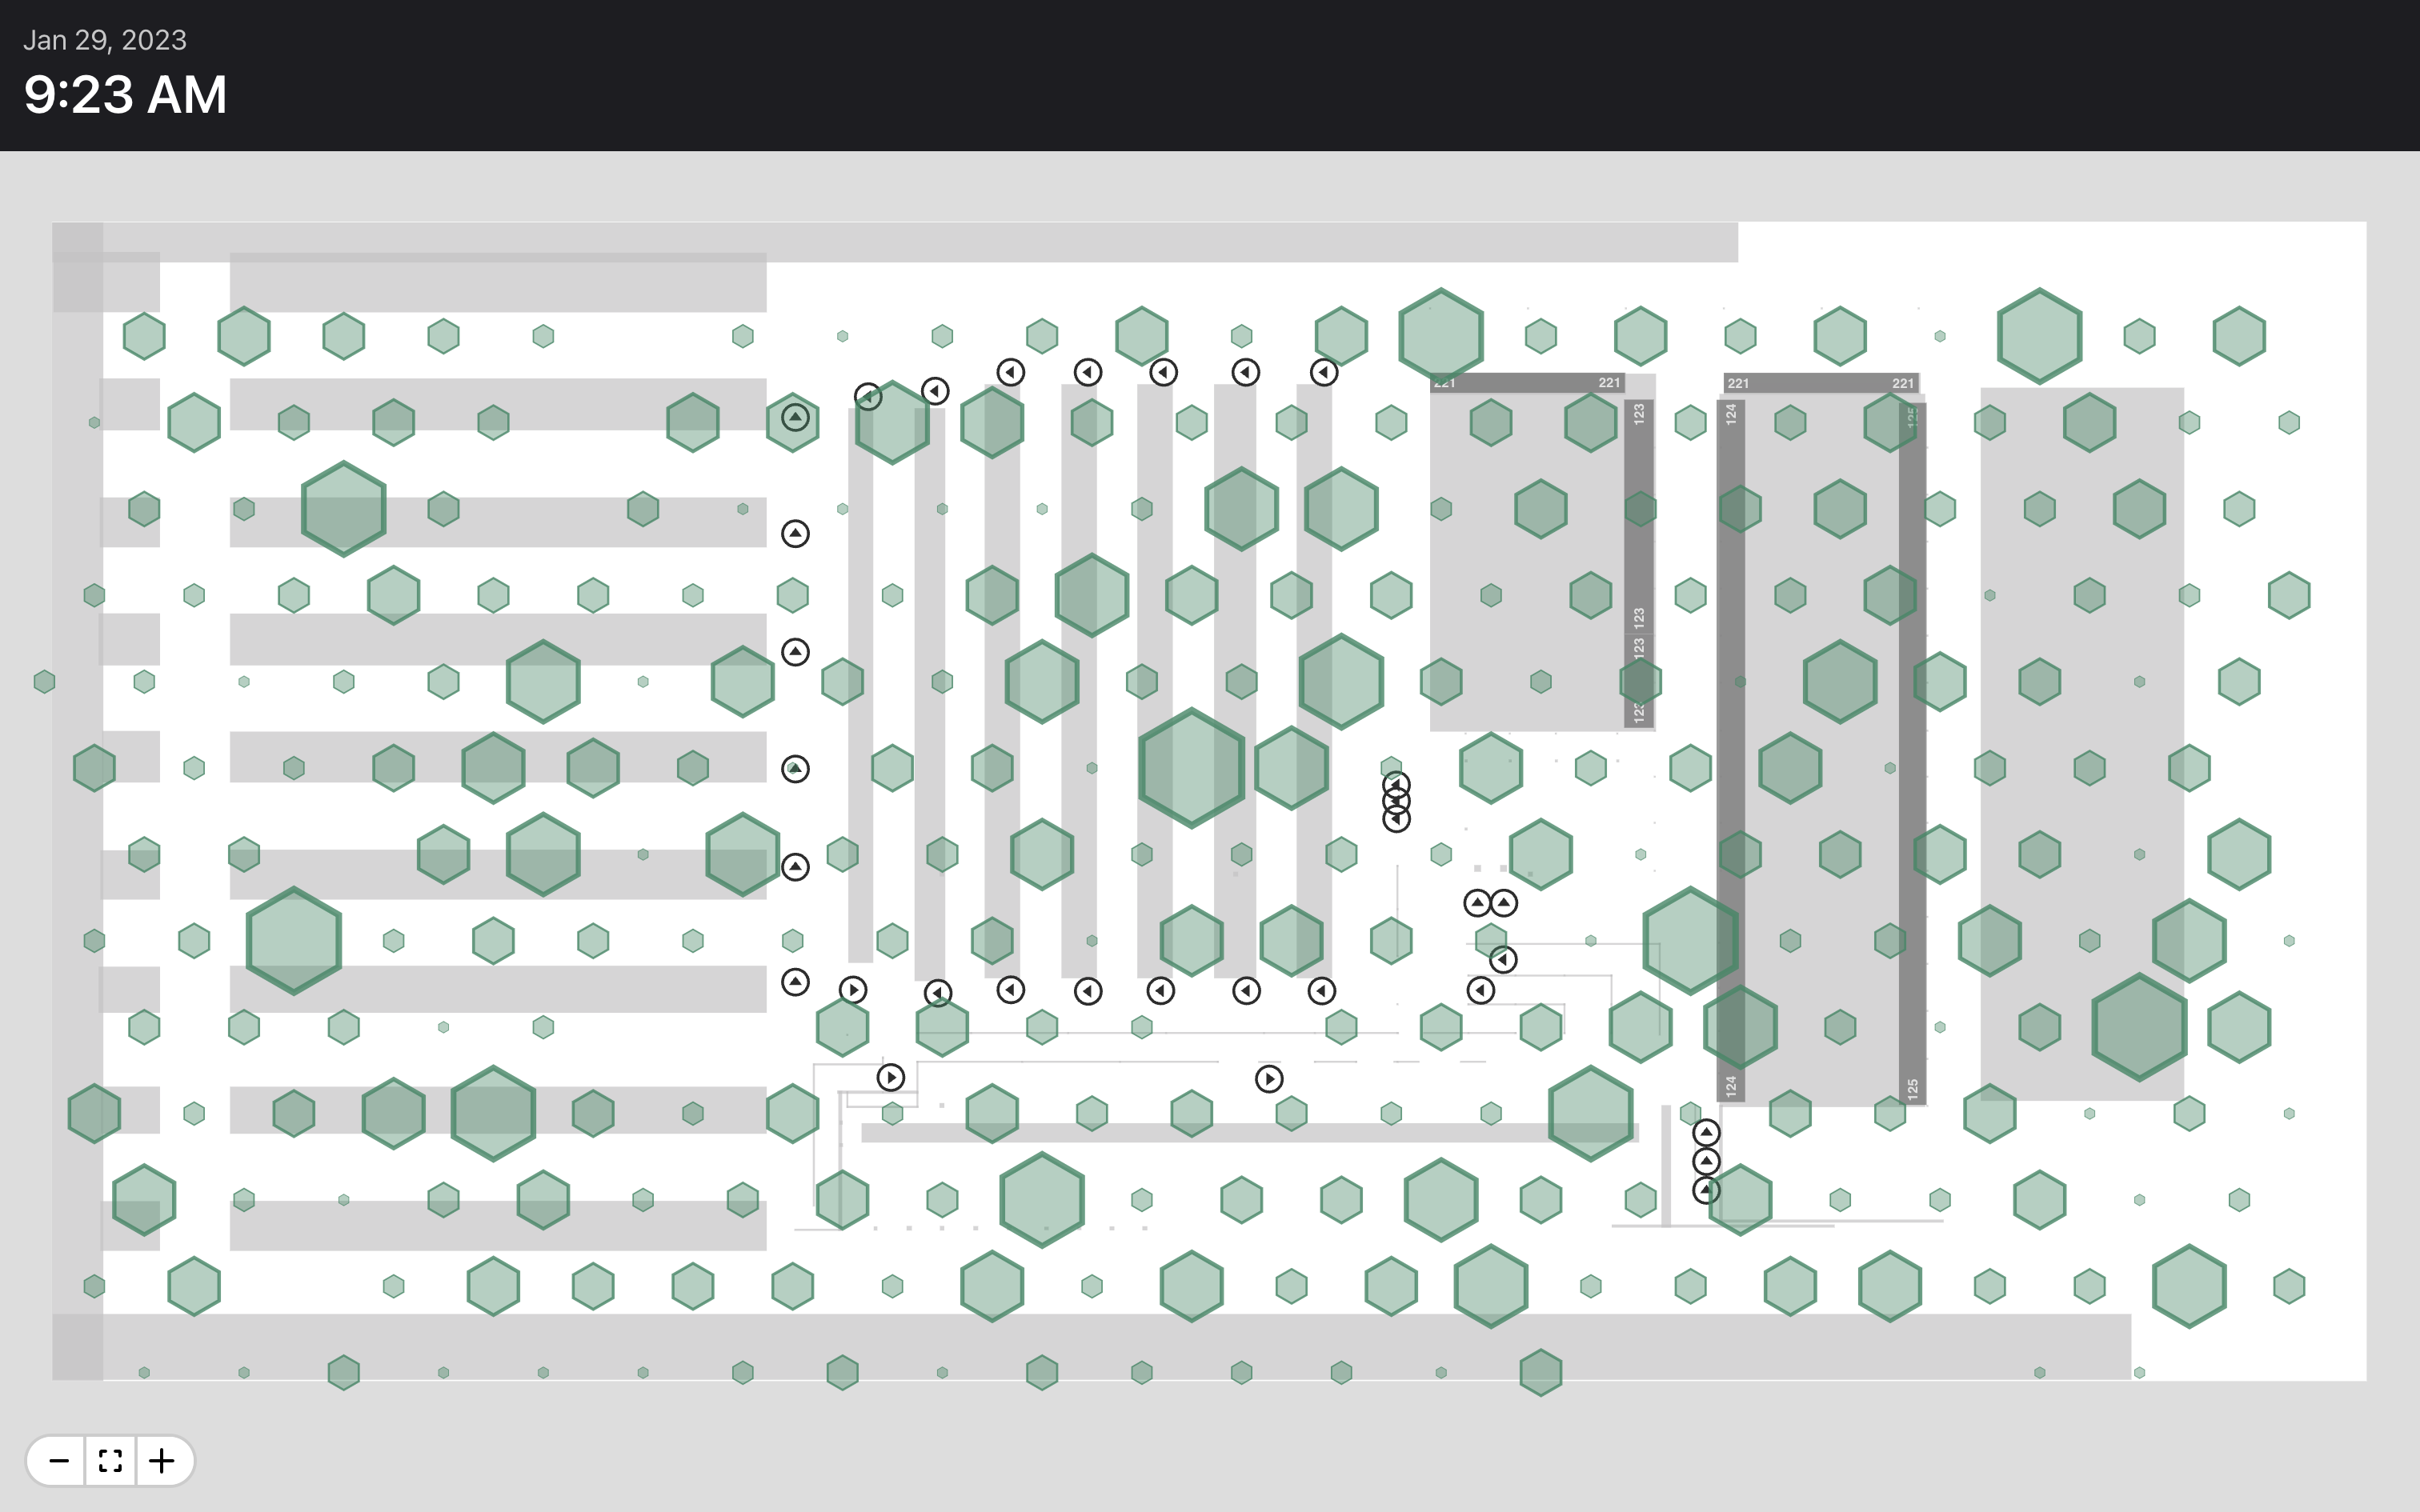
This effect can be corrected with the provided data clustering function that groups data points based on the scale (zoom level) of the map and a search radius determined by you:
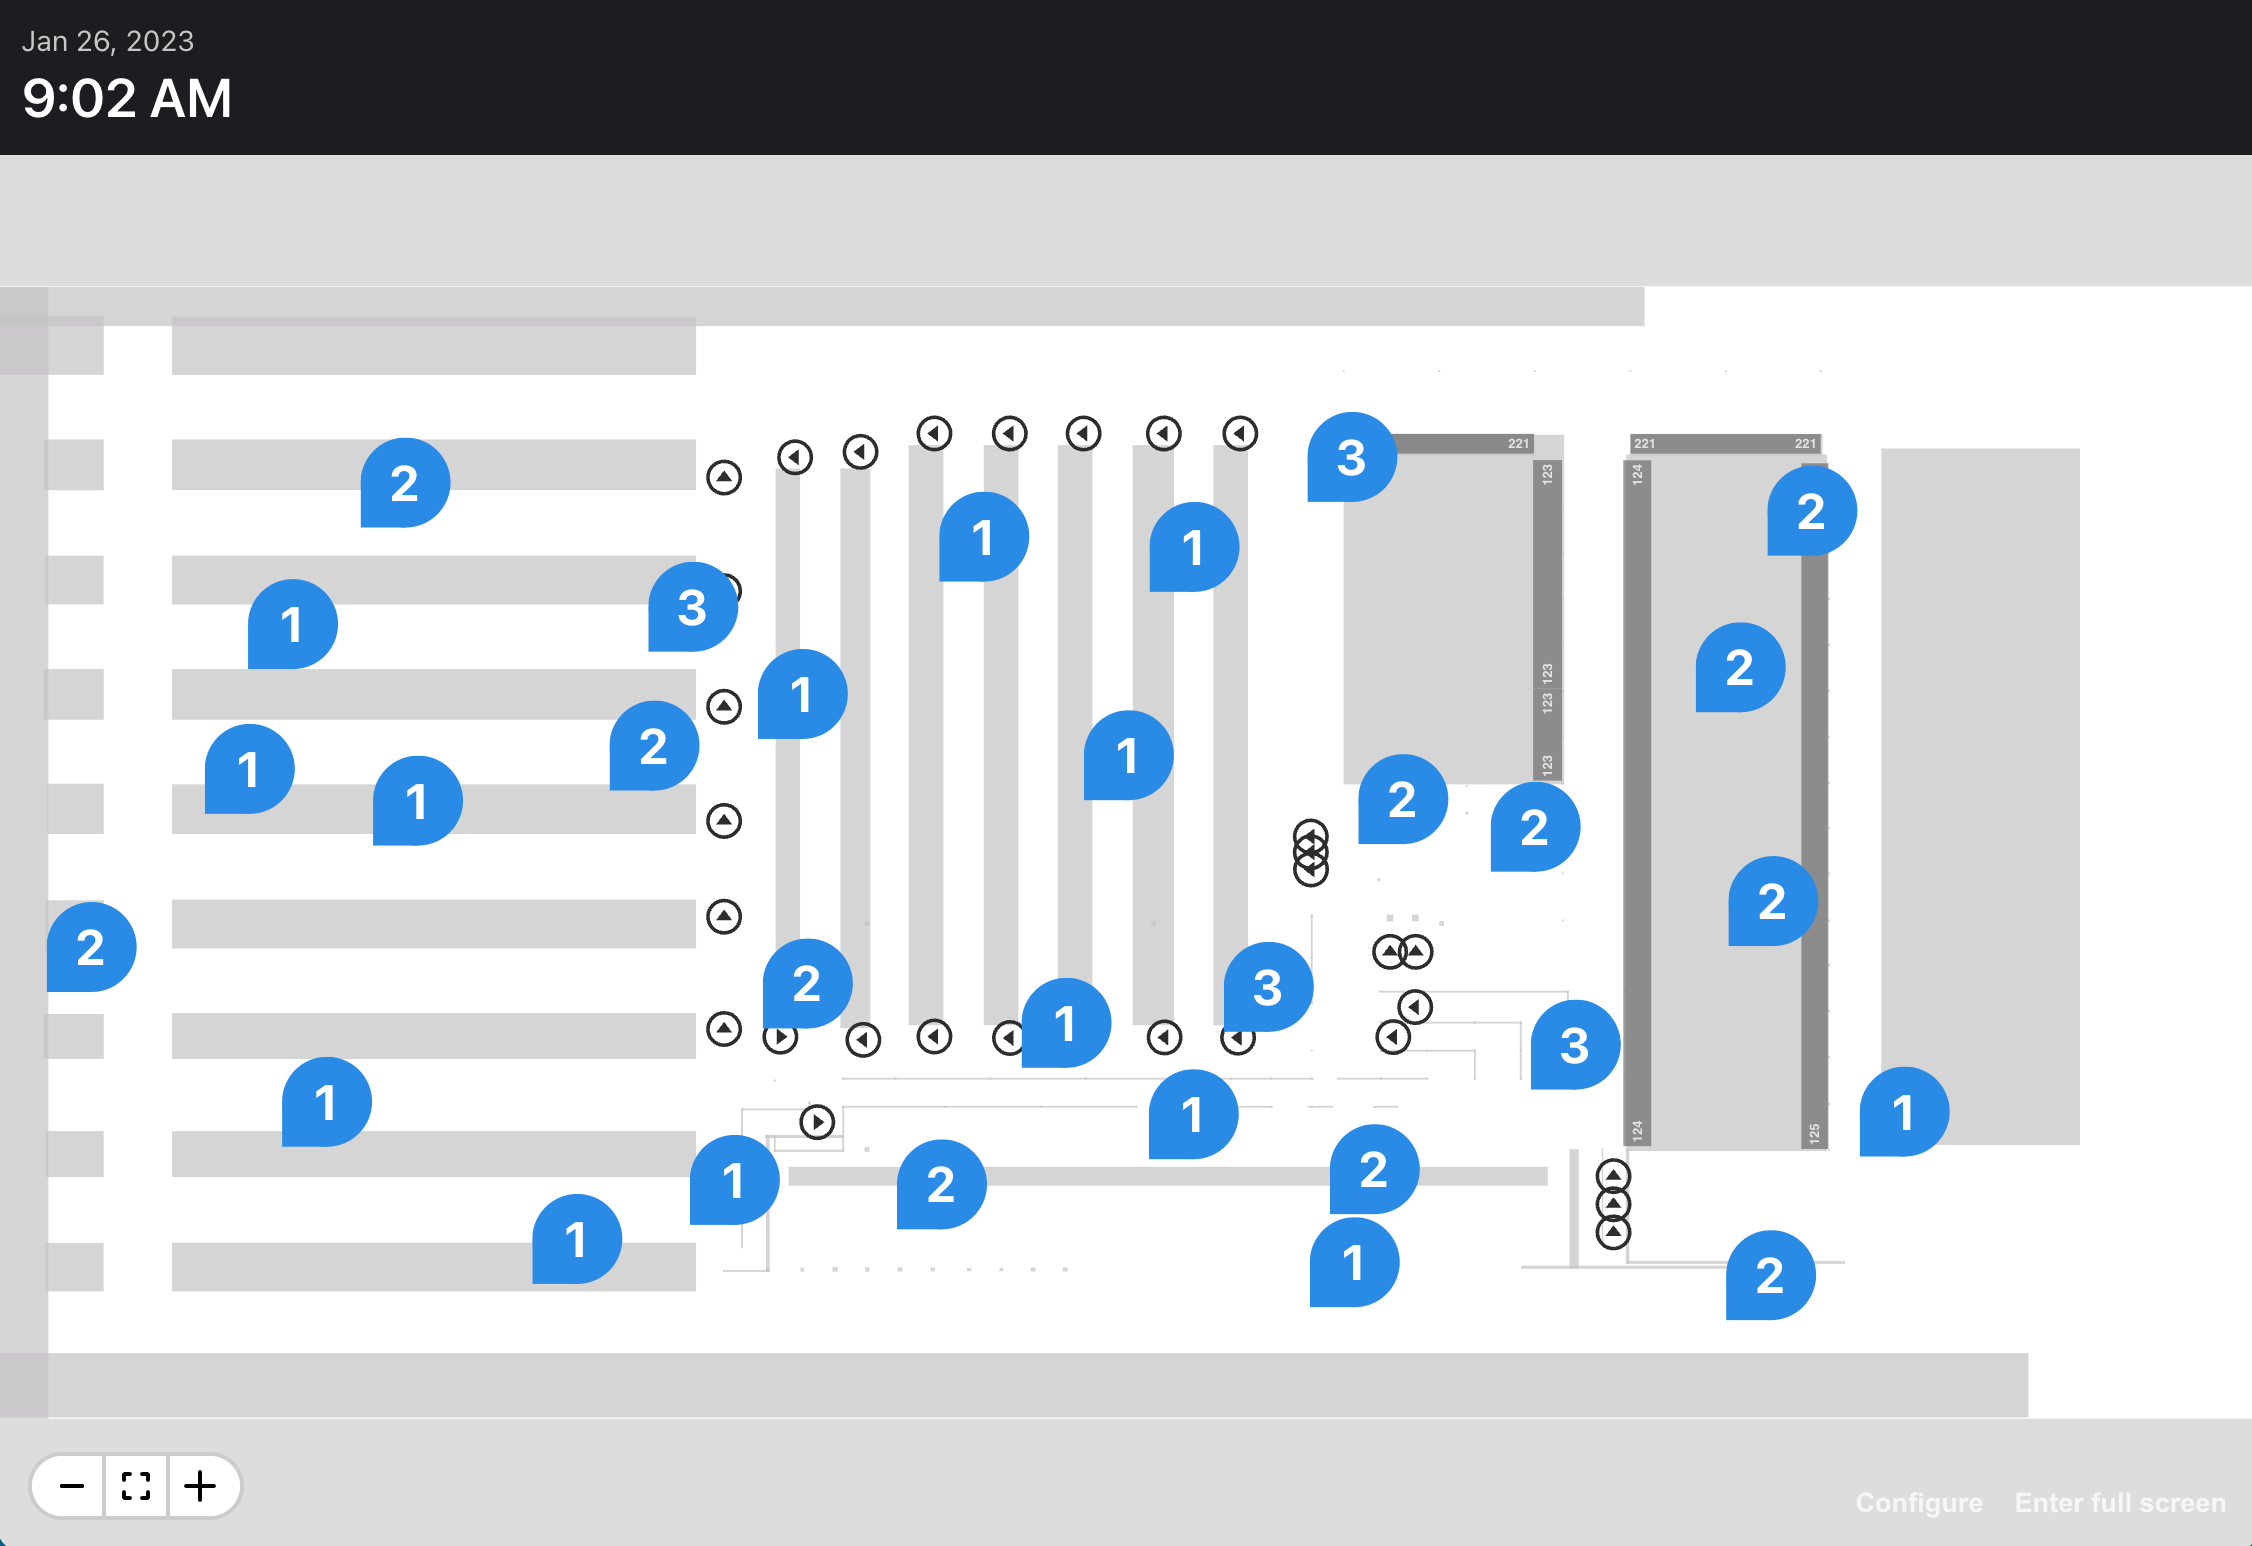
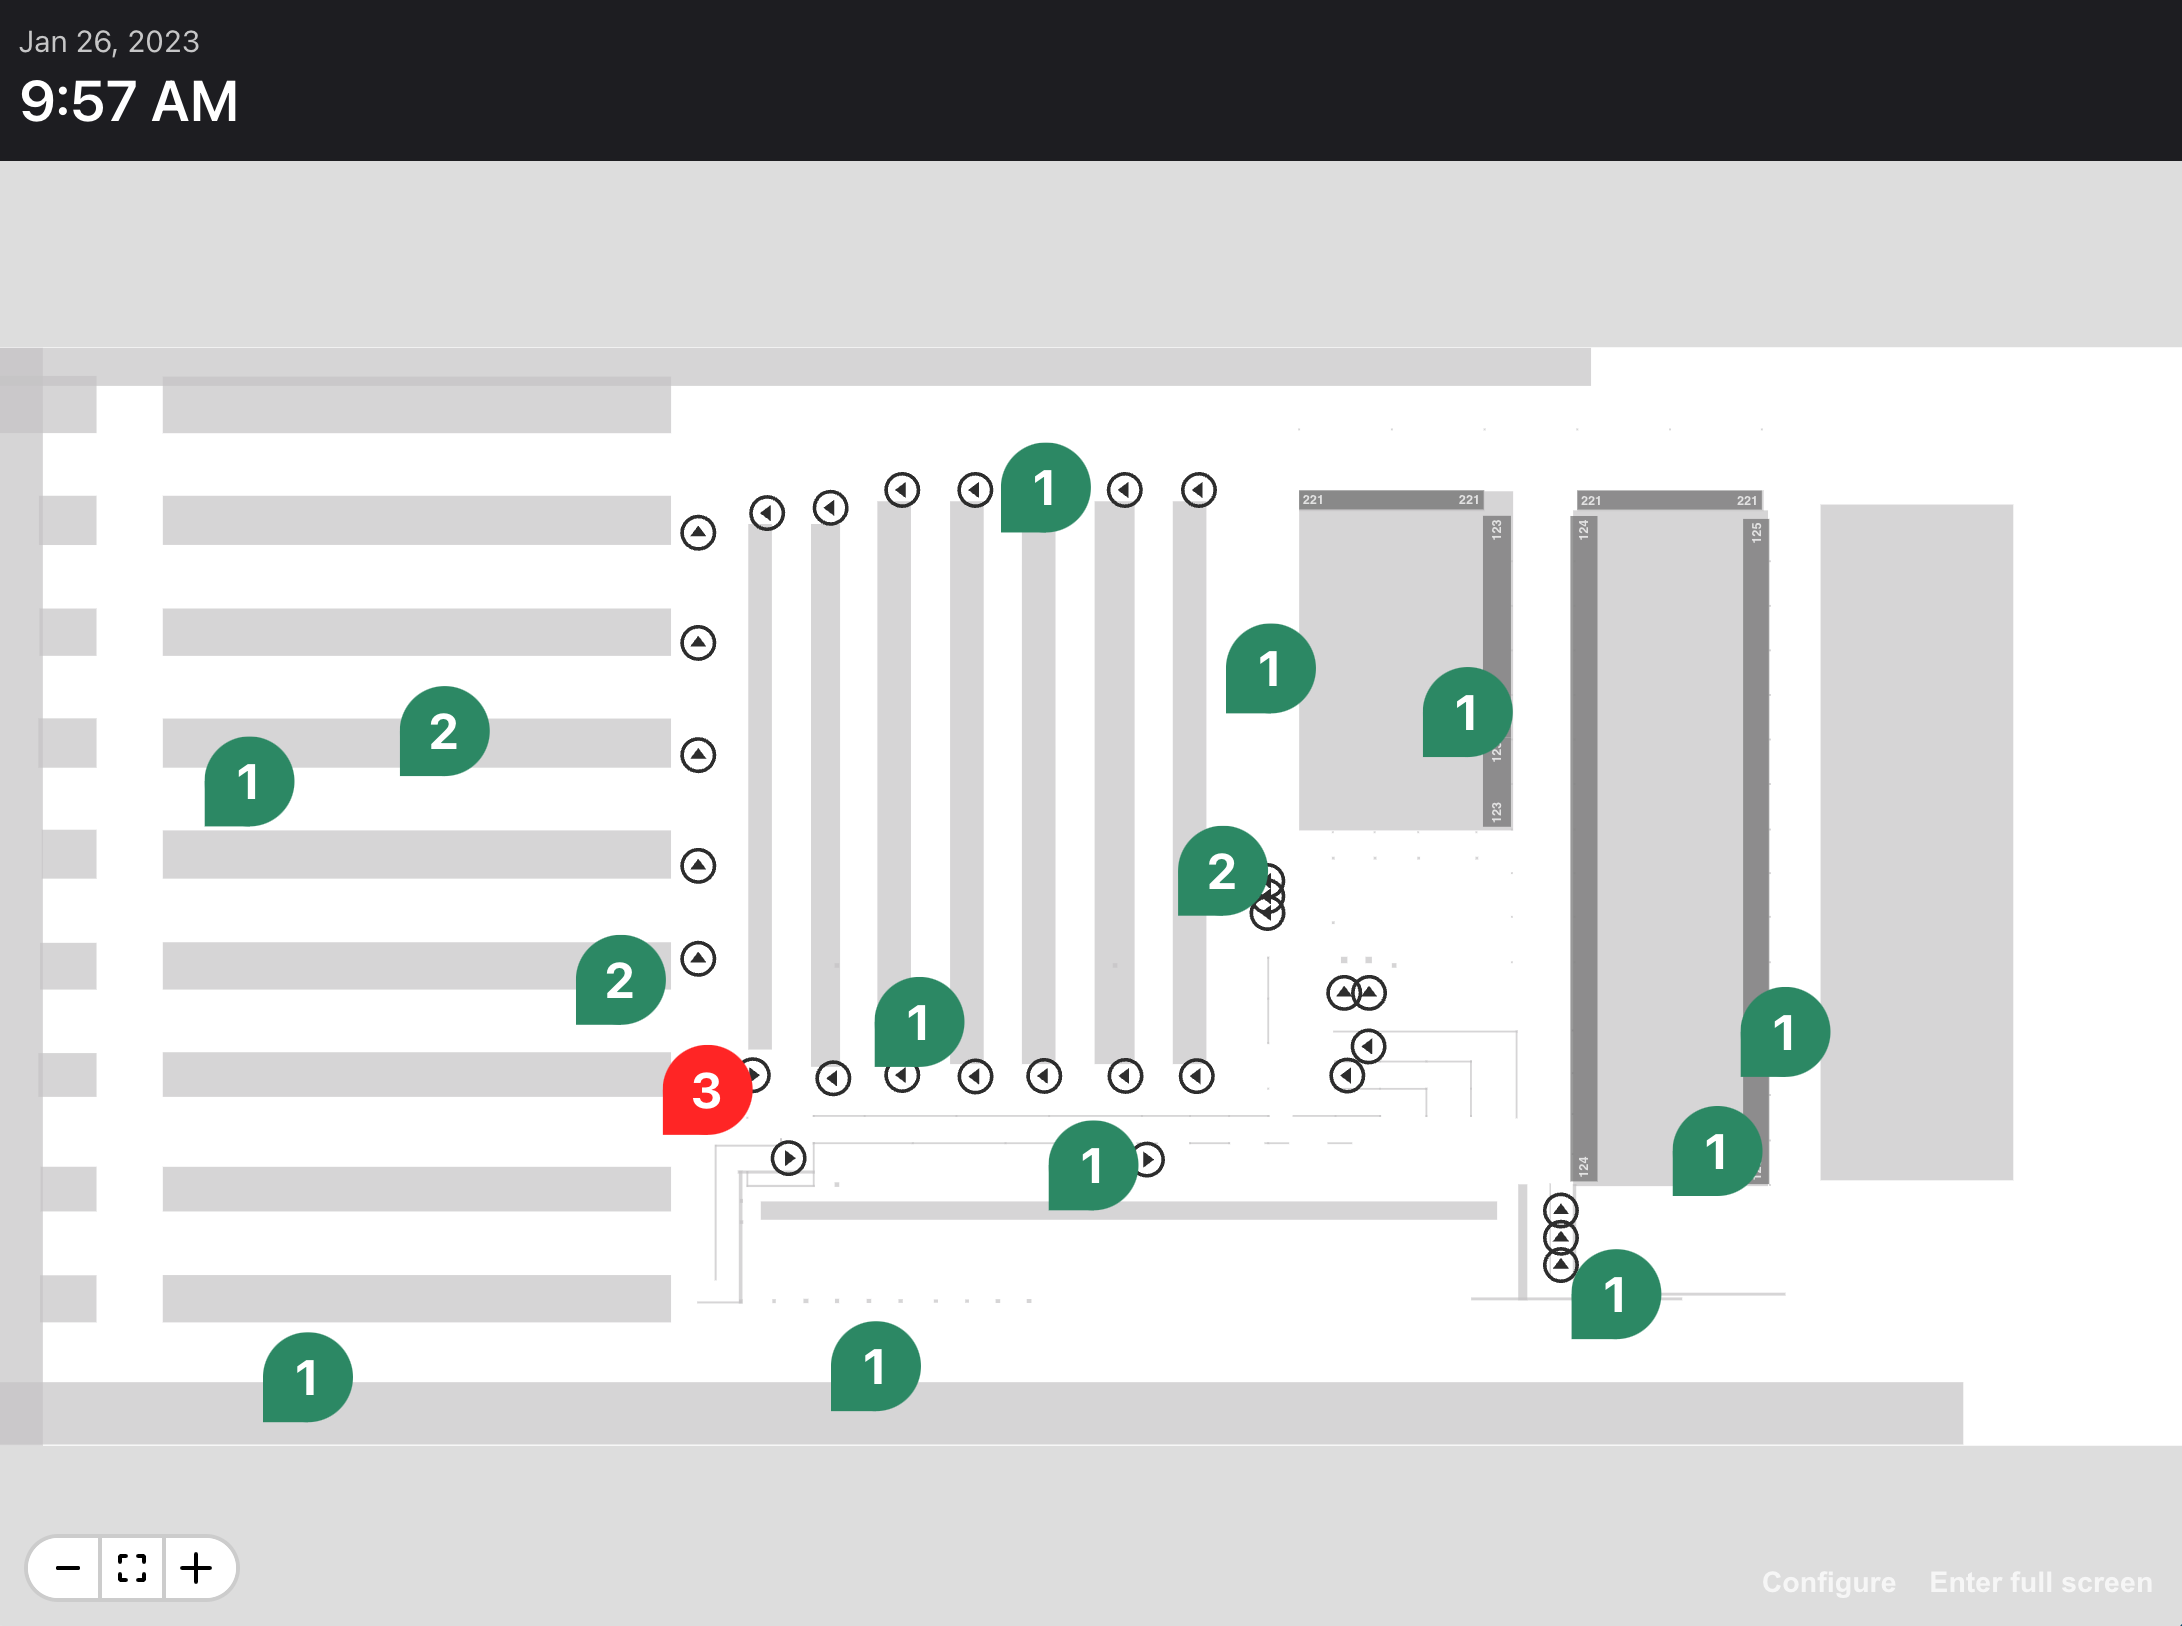
In the following example, we'll create 20 random points, each with a count of 1, and use the cluster function to group them. Then we'll use the resulting data set to drop green and red pins on the map (red if the value is 3 or more). Note we're using the onZoom callback of the map element to get the scale of the map.
import { Annotation, Map as MapElement, ZoomControl } from '@sixriver/map-element';
import { useState } from 'react';

import { Clock } from '../../components/clock/Clock';
import { Dashboard } from '../../components/dashboard/Dashboard';
import { Pin } from '../../components/map-pin/Pin';
import { Directory } from '../../directory';
import { useFetch } from '../../hooks/useFetch';
import { useMapFile } from '../../hooks/useMapFile';
import { Input, Output, cluster } from '../../utils/map-cluster';
import { Color } from '../../utils/theme';

// random input data
const inputs: Input[] = new Array(20).fill(0).map((_, i) => {
  const x = 20 + Math.random() * 100;
  const y = 5 + Math.random() * 50;

  return {
    key: i.toString(),
    point: { x, y },
    count: 1,
  };
});

export function MapDemo() {
  const url = Directory.MAP_MANAGER_URL + '/map.6rms';
  const { data, error } = useFetch<ArrayBuffer>(url, { binary: true });
  const { mapStack } = useMapFile(data);

  // scale of the map
  const [scale, setScale] = useState(3);

  // the size of a pin and the cluster radius
  const pinSize = 5;
  const radius = pinSize * 1.5;

  // clustered output data
  const outputs: Output[] = cluster(inputs, scale, radius);

  // the annotations
  const pins = outputs.map((output) => {
    const color = output.count >= 3 ? Color.Red : Color.Green;

    return (
      <Annotation key={output.key} x={output.point.x} y={output.point.y} scale="ignore">
        <Pin color={color} value={output.count} size={pinSize} />
      </Annotation>
    );
  });

  return (
    <Dashboard layout="one-over-one" breakpoints={0.1} error={error}>
      <Dashboard.Panel padding={1.5}>
        <Clock />
      </Dashboard.Panel>
      <Dashboard.Panel color={Color.LightGray}>
        {mapStack ? (
          <MapElement
            mapStack={mapStack}
            showWorkflowPoint
            showRack
            showImpassable
            enablePanControl
            onZoom={(evt) => {
              if (evt.action === 'zoom') {
                setScale(evt.scale);
              }
            }}
          >
            <ZoomControl position="bottomleft" />
            <g>{pins}</g>
          </MapElement>
        ) : null}
      </Dashboard.Panel>
    </Dashboard>
  );
}Very large data sets may benefit from hexagonal binning using the <HexBin> component. In this approach, data points are aggregated into an evenly-spaced, honeycomb-like pattern showing the general distribution of data:
In the following example, we'll create 1,000 random points, each with a count of 1, then pass this data into the <HexBin> component using a radius of 2 (meters) and the color green. Unlike the clustering technique described above, we don't need to use the <Annotation> component to scale and position content.
import { Map as MapElement, ZoomControl } from '@sixriver/map-element';

import { Clock } from '../../components/clock/Clock';
import { Dashboard } from '../../components/dashboard/Dashboard';
import { HexBin } from '../../components/map-hex/HexBin';
import { Directory } from '../../directory';
import { useFetch } from '../../hooks/useFetch';
import { useMapFile } from '../../hooks/useMapFile';
import { Color } from '../../utils/theme';

// random input data
const pointData = new Array(1000).fill(0).map(() => {
  const x = 20 + Math.random() * 115;
  const y = 5 + Math.random() * 55;

  return {
    point: { x, y },
    count: 1
  };
});

export function MapDemo() {
  const url = Directory.MAP_MANAGER_URL + '/map.6rms';
  const { data, error } = useFetch<ArrayBuffer>(url, { binary: true });
  const { mapStack } = useMapFile(data);

  return (
    <Dashboard layout="one-over-one" breakpoints={0.1} error={error}>
      <Dashboard.Panel padding={1.5}>
        <Clock />
      </Dashboard.Panel>
      <Dashboard.Panel color={Color.LightGray}>
        {mapStack ? (
          <MapElement
            mapStack={mapStack}
            showWorkflowPoint
            showRack
            showImpassable
            enablePanControl
          >
            <ZoomControl position="bottomleft" />
            <HexBin data={pointData} radius={2} color={Color.Green} />
          </MapElement>
        ) : null}
      </Dashboard.Panel>
    </Dashboard>
  );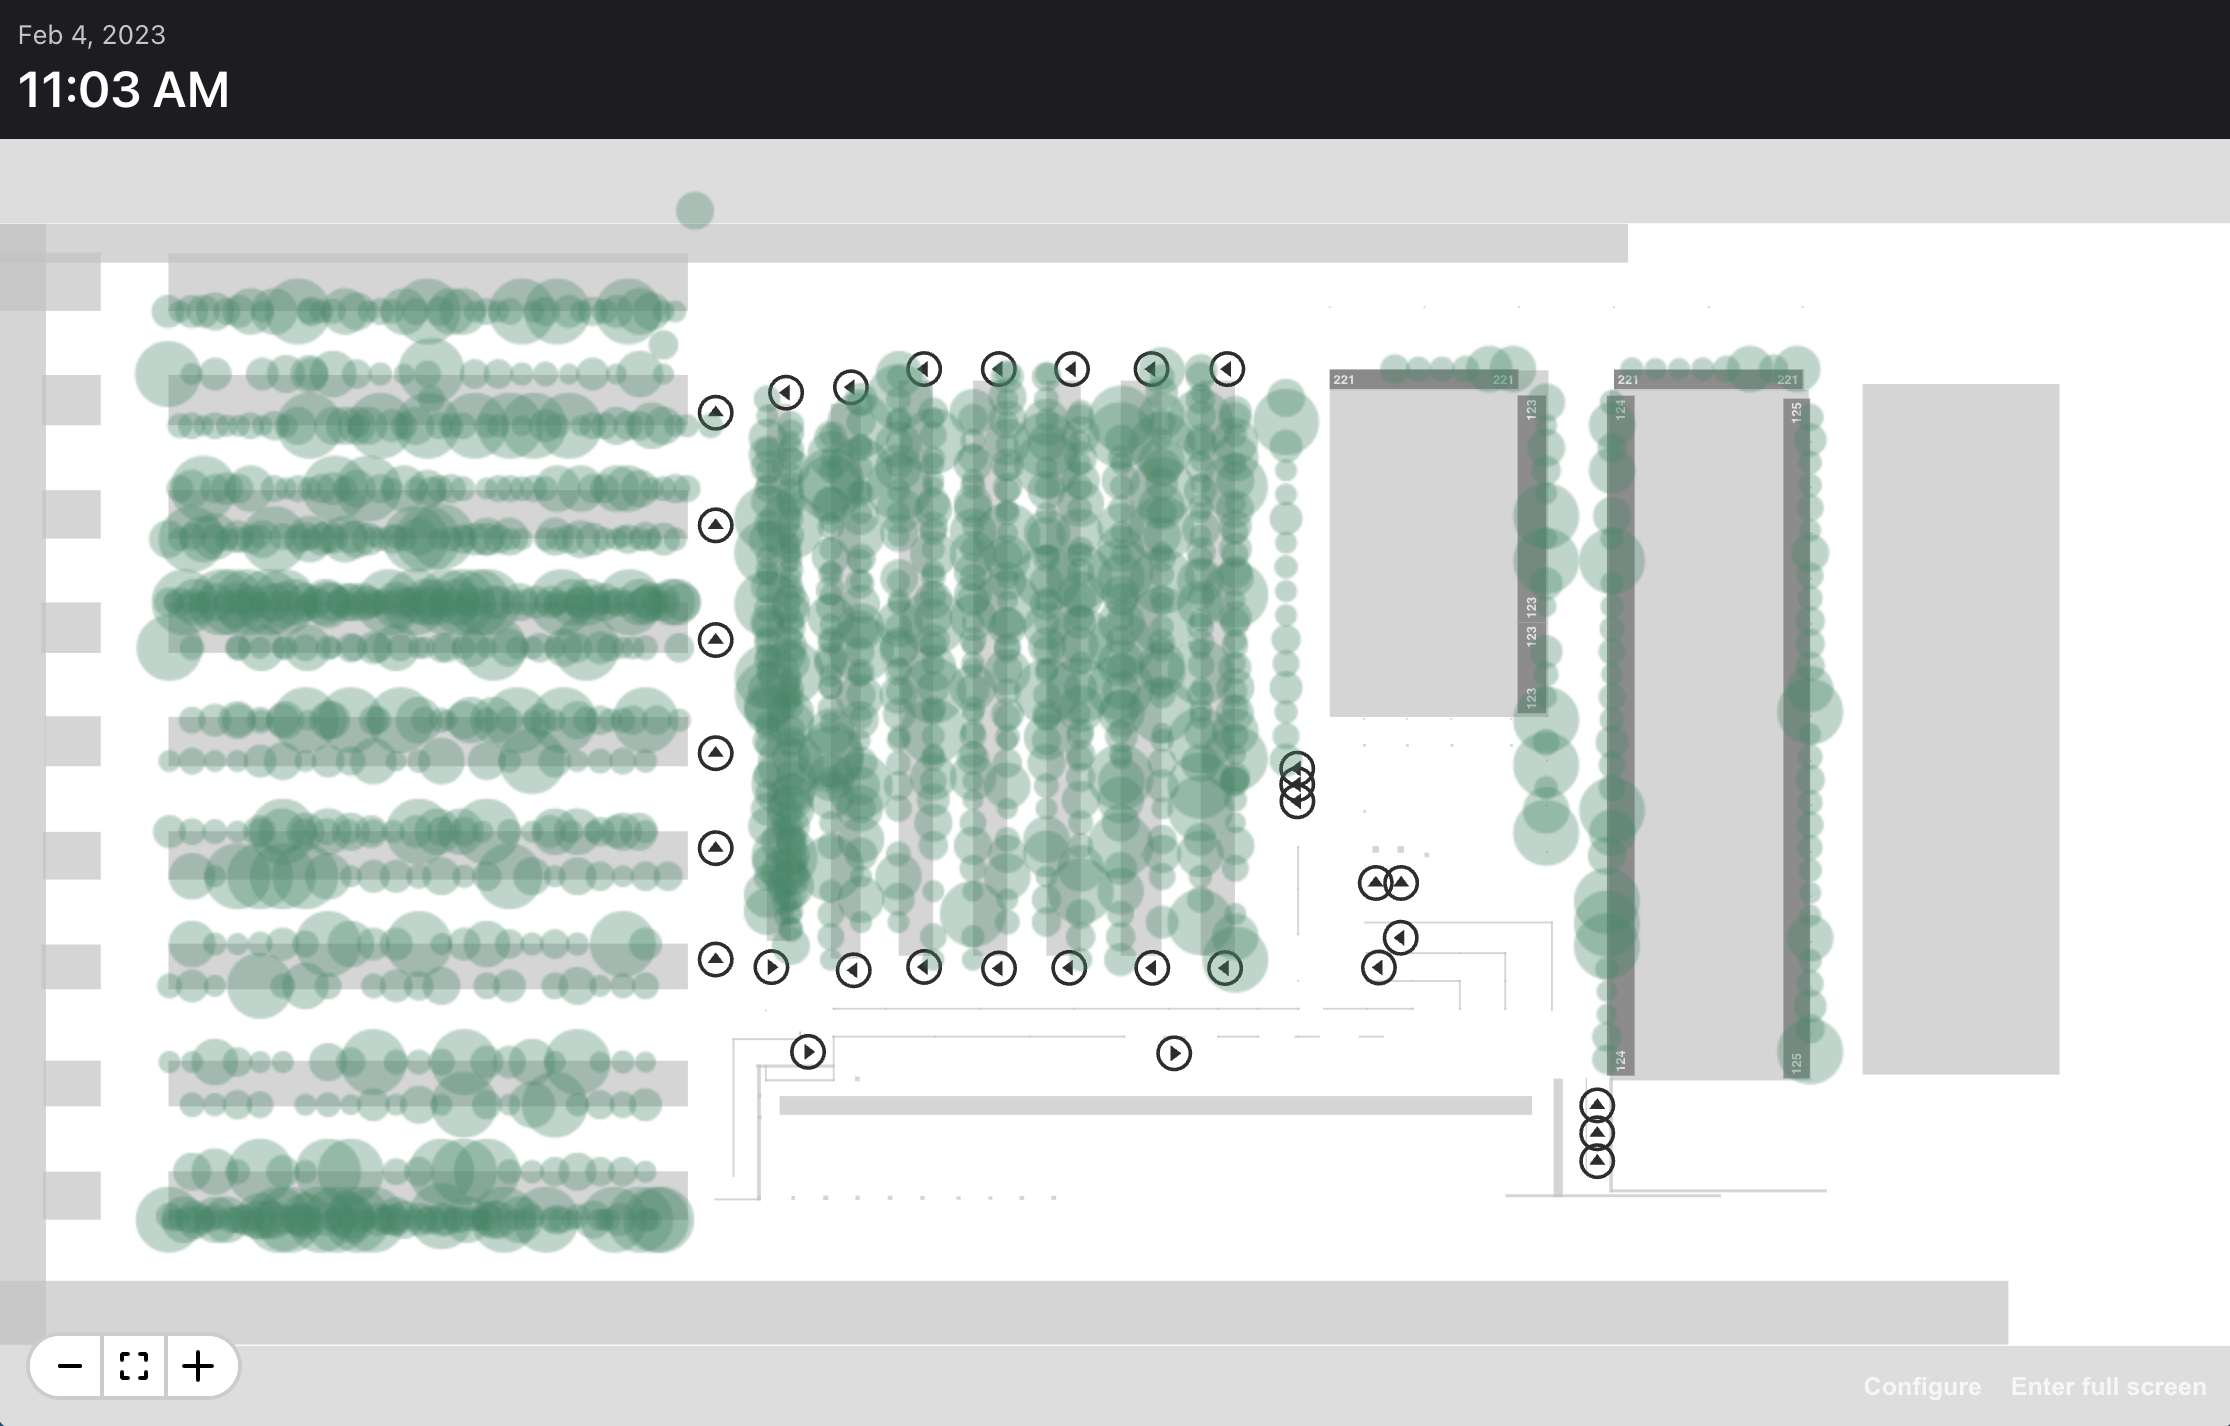
}For complex applications, especially those needing to render thousands of objects, the map provides a low-level drawing canvas along with utility functions for transforming the canvas's coordinate space from pixels to meters.
Using this feature requires an understanding of the Canvas API and its performance implications.
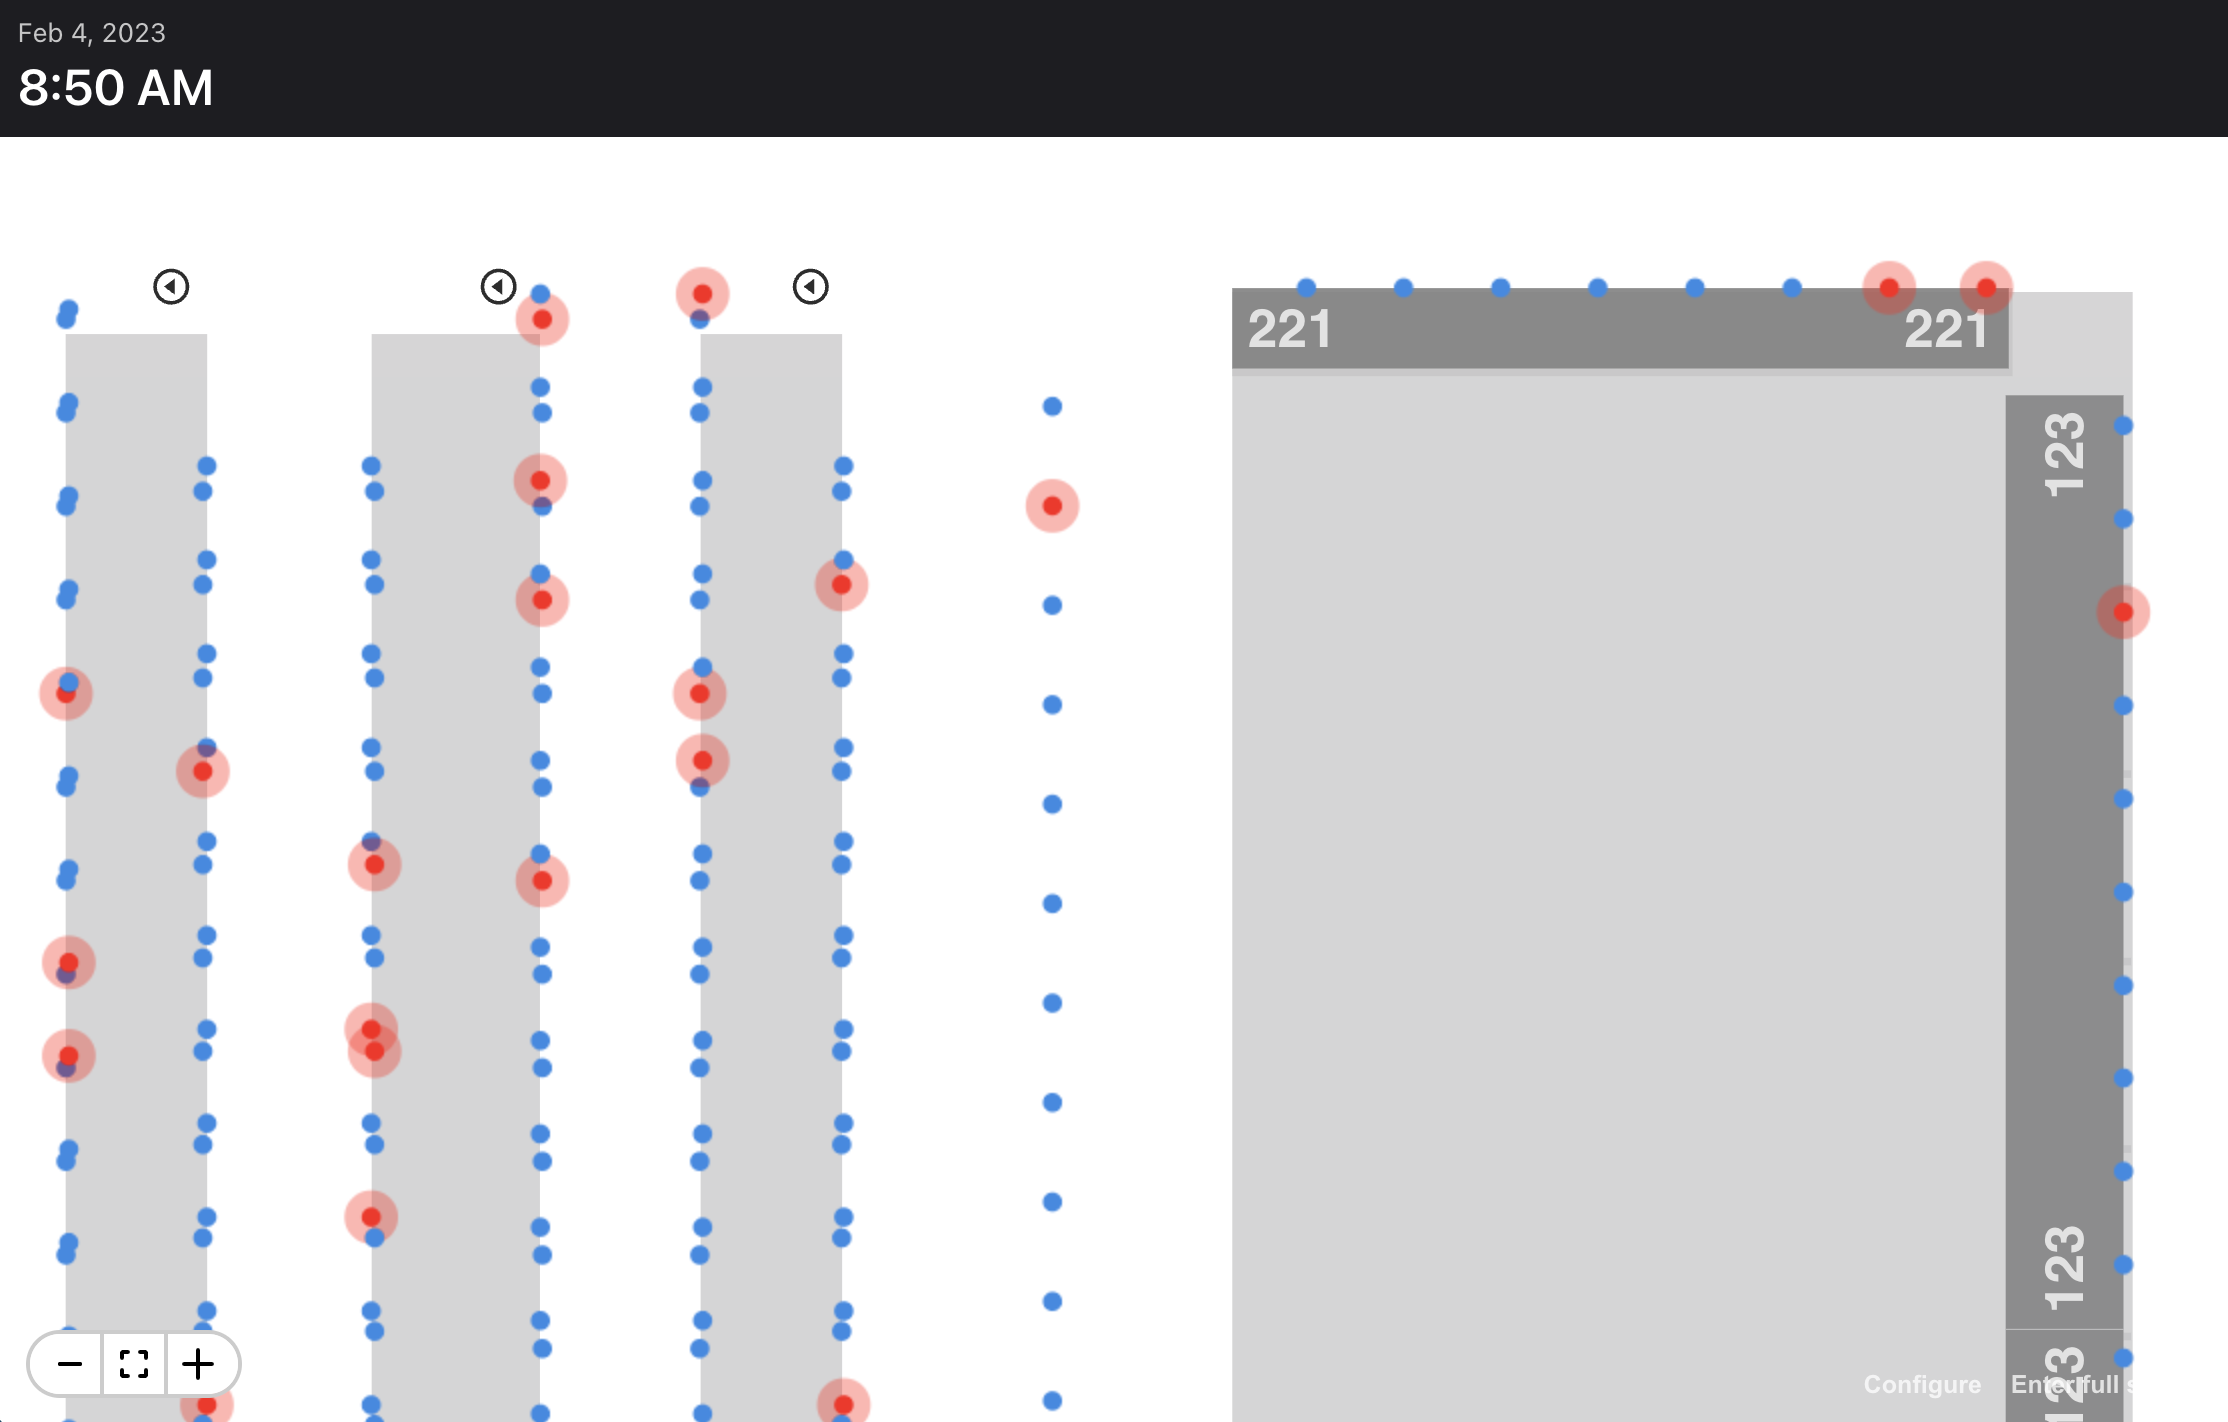
In the following example, we'll load 1,500 distinct location coordinates (x, y), each having a random value (z) between 1 and 10. Then we'll listen for onZoom events from the map. With each event, we'll execute a drawing routine that clears the canvas and renders a semitransparent circle for each point, resulting in a heat map.
import { Map as MapElement, resetContext, useMapCanvas, ZoomControl } from '@sixriver/map-element';

import { Clock } from '../../components/clock/Clock';
import { Dashboard } from '../../components/dashboard/Dashboard';
import { Directory } from '../../directory';
import { useFetch } from '../../hooks/useFetch';
import { useMapFile } from '../../hooks/useMapFile';
import { Point, Dimensions } from '../../utils/math';
import { Color, hexToRgba } from '../../utils/theme';

// Sample data in the form [{x, y, z}, ...]
import locations from './locations.json';

// This function may get called many times per second
function draw(context: CanvasRenderingContext2D, scale: number, center: Point, size: Dimensions) {
  const fillStyle = hexToRgba(Color.Green, 0.35);

  // Let the browser decide when to do the hard work
  requestAnimationFrame(() => {
    // Transform the context so we can provide dimensions in meters instead of pixels.
    // The last argument (true) clears the canvas
    resetContext(context, scale, center, size, true);

    locations.forEach((loc) => {
      // The area of each circle corresponds to its z value. A value of 10 generates
      // a circle roughly 3 meters in diameter
      const radius = Math.sqrt(Math.PI / loc.z);

      context.fillStyle = fillStyle;
      context.beginPath();
      context.arc(loc.x, loc.y, radius, 0, 2 * Math.PI);
      context.fill();
    });
  });
}

export function MapDemo() {
  const url = Directory.MAP_MANAGER_URL + '/map.6rms';
  const { data, error } = useFetch<ArrayBuffer>(url, { binary: true });
  const { mapStack } = useMapFile(data);

  // Obtain a handle to the map canvas ...
  const canvas = useMapCanvas();
  // .. and its 2D context
  const context = canvas?.getContext('2d');

  return (
    <Dashboard layout="one-over-one" breakpoints={0.1} error={error}>
      <Dashboard.Panel padding={1.5}>
        <Clock />
      </Dashboard.Panel>
      <Dashboard.Panel color={Color.LightGray}>
        {mapStack ? (
          <MapElement
            mapStack={mapStack}
            showWorkflowPoint
            showRack
            showImpassable
            enablePanControl
            onZoom={(evt) => {
              // Every time the map moves, we need to redraw
              if (context) {
                draw(context, evt.scale, evt.center, evt.size);
              }
            }}
          >
            <ZoomControl position="bottomleft" />
          </MapElement>
        ) : null}
      </Dashboard.Panel>
    </Dashboard>
  );
}