User's Guide: 2. Conducting an Experiment
After performing the steps from User's Guide part 1, you should have six projects ( CentralizedExample, DecentralizedExample, mobilitytestbed, mobilitytestanalyzer, mobilitytestbeddbtokmlexporter and mobilitytestbedgenerators ) imported into Eclipse and at least one benchmark scenario extracted in the experiments folder.
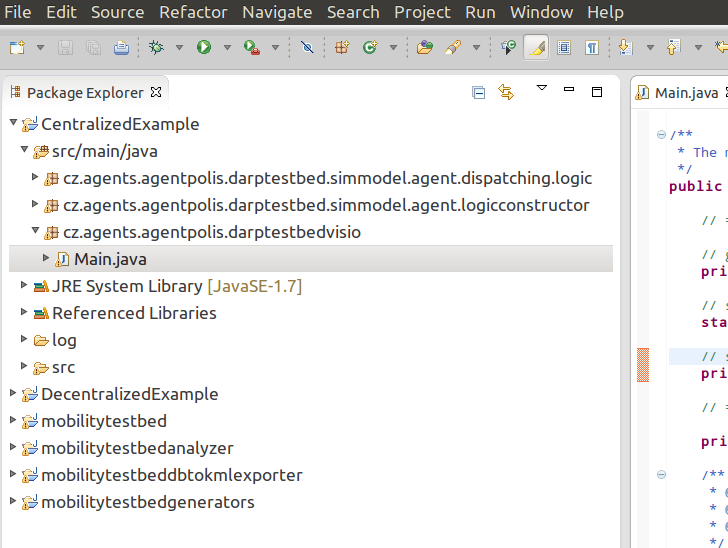
- To run the simulation with Centralized control mechanism and default settings, just browse the CentralizedExample project in Eclipse project explorer (left side of the screen), locate the Main.java file in the cz.agents.agentpolis.darptestbedvisio package, open it and press Ctrl+F11.
By doing this, you will run a simulation on a small benchmark scenario ( hague_20_drivers ), using the example centralized control mechanism, which is implemented by the following class in the CentralizedExample project: DispatchingLogicExample.java (located in the cz.agents.agentpolis.darptestbed.simmodel.agent.dispatching.logic package)
You will learn how to implement your own control mechanisms in following parts of this User's Guide.
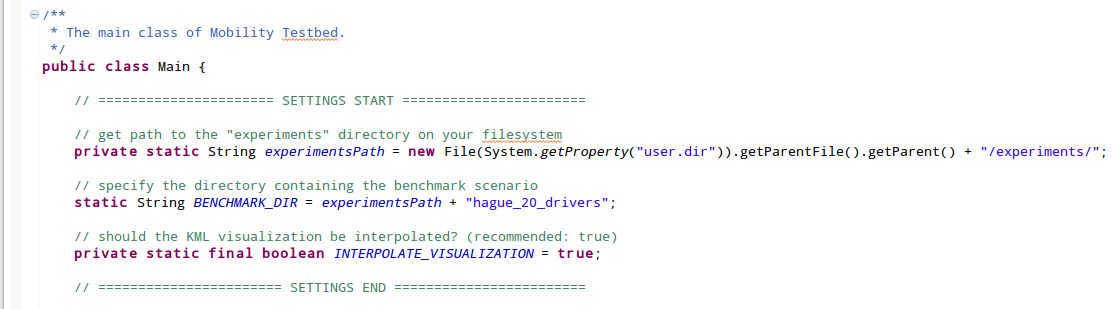
- To change the location of benchmark packages, find the
private static String experimentsPathvariable and point it to any location on your filesystem. - To switch the benchmark scenario, locate the
static String BENCHMARK_DIR = experimentsPath + "hague_20_drivers";line and set the path to some other directory containing the benchmark that you want to use. - To use the decentralized control mechanism instead, you need to locate and run the Main.java class within the DecentralizedExample project.
-
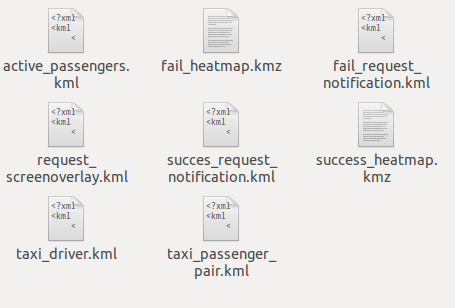
Once the simulation is finished, the testbed should generate a collection of KML and KMZ files in the mobilitytestbed/experiments/your_benchmark_name/results/0/visualizations folder (where "your_benchmark_name" is substituted by the name of whatever benchmark you are using).
-
Now you should open Google Earth and drag-and-drop all those generated files to it.
-
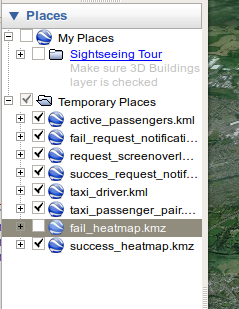
Then you can either click the Play button in the top-left corner to animate the simulation run or adjust the time slider to control the visualization time manually.
-
You can also enable or disable loaded layers using the checkboxes in the "Places" section on the left side of Google Earth window.

- After the simulation, the testbed also computes various aggregated metrics and saves them in the result_simulation_report.txt file in the mobilitytestbed/experiments/your_benchmark_name/results/0/ folder. It contains the information such as average passenger travel/wait time, total distance driven, algorithm's computation times, CO2 emissions, etc. The simulation report looks like this:
------ Simulation result -----------
Average passenger travel time (on-board) is :00:20:32
Max passenger travel time (on-board) is :07:55:51
Median passenger travel time (on-board) is :00:19:04
Average passenger ride time (on-board) is :00:15:03
Max passenger ride time (on-board) is :07:29:15
Median passenger ride time (on-board) is :00:13:37
Average passenger wait time is :00:05:28
Max passenger wait time is :03:20:47
Median passenger wait time is :00:04:46
Total vehicle distance driven (in kilometers):6440.6302740258425
Total values of CO2 [gram]:1004785.9950468318
Total values of CO [gram]:1275912.2064406131
Total values of NOx [gram]:246717.91363082107
Total values of PM10 [gram]:169853.74636538292
Total values of SOx [gram]:446848.52044731117
Total values of fuel [Liter] :450.0449994349306
Alg. real time :03:18:38
Simulation real time :03:24:15
In addition to the simulation settings mentioned above, you can also configure individual benchmark scenarios by changing the values inside the config/config.groovy and config/scenario.groovy files under the benchmark folder.
The scenario.groovy file contains, among others, these settings:
- darpResultFileName: specifies the name of the results file that should be generated (usually "simulation_report" or "darp_simulation_report")
- createVisualizations: allows you to enable or disable the KML/KML visualization generation (default: true)
- driverPopulationPath, passengerPopulationPath, vehicledatamodelPath: contains the path to JSON files containing the passenger population wit requests, drivers and vehicles (defaults are specific for each benchmark)
Learn how to implement your own centralized (DARP) algorithm in User's Guide part 3 or decentralized coordination algorithm in User's Guide part 4.
