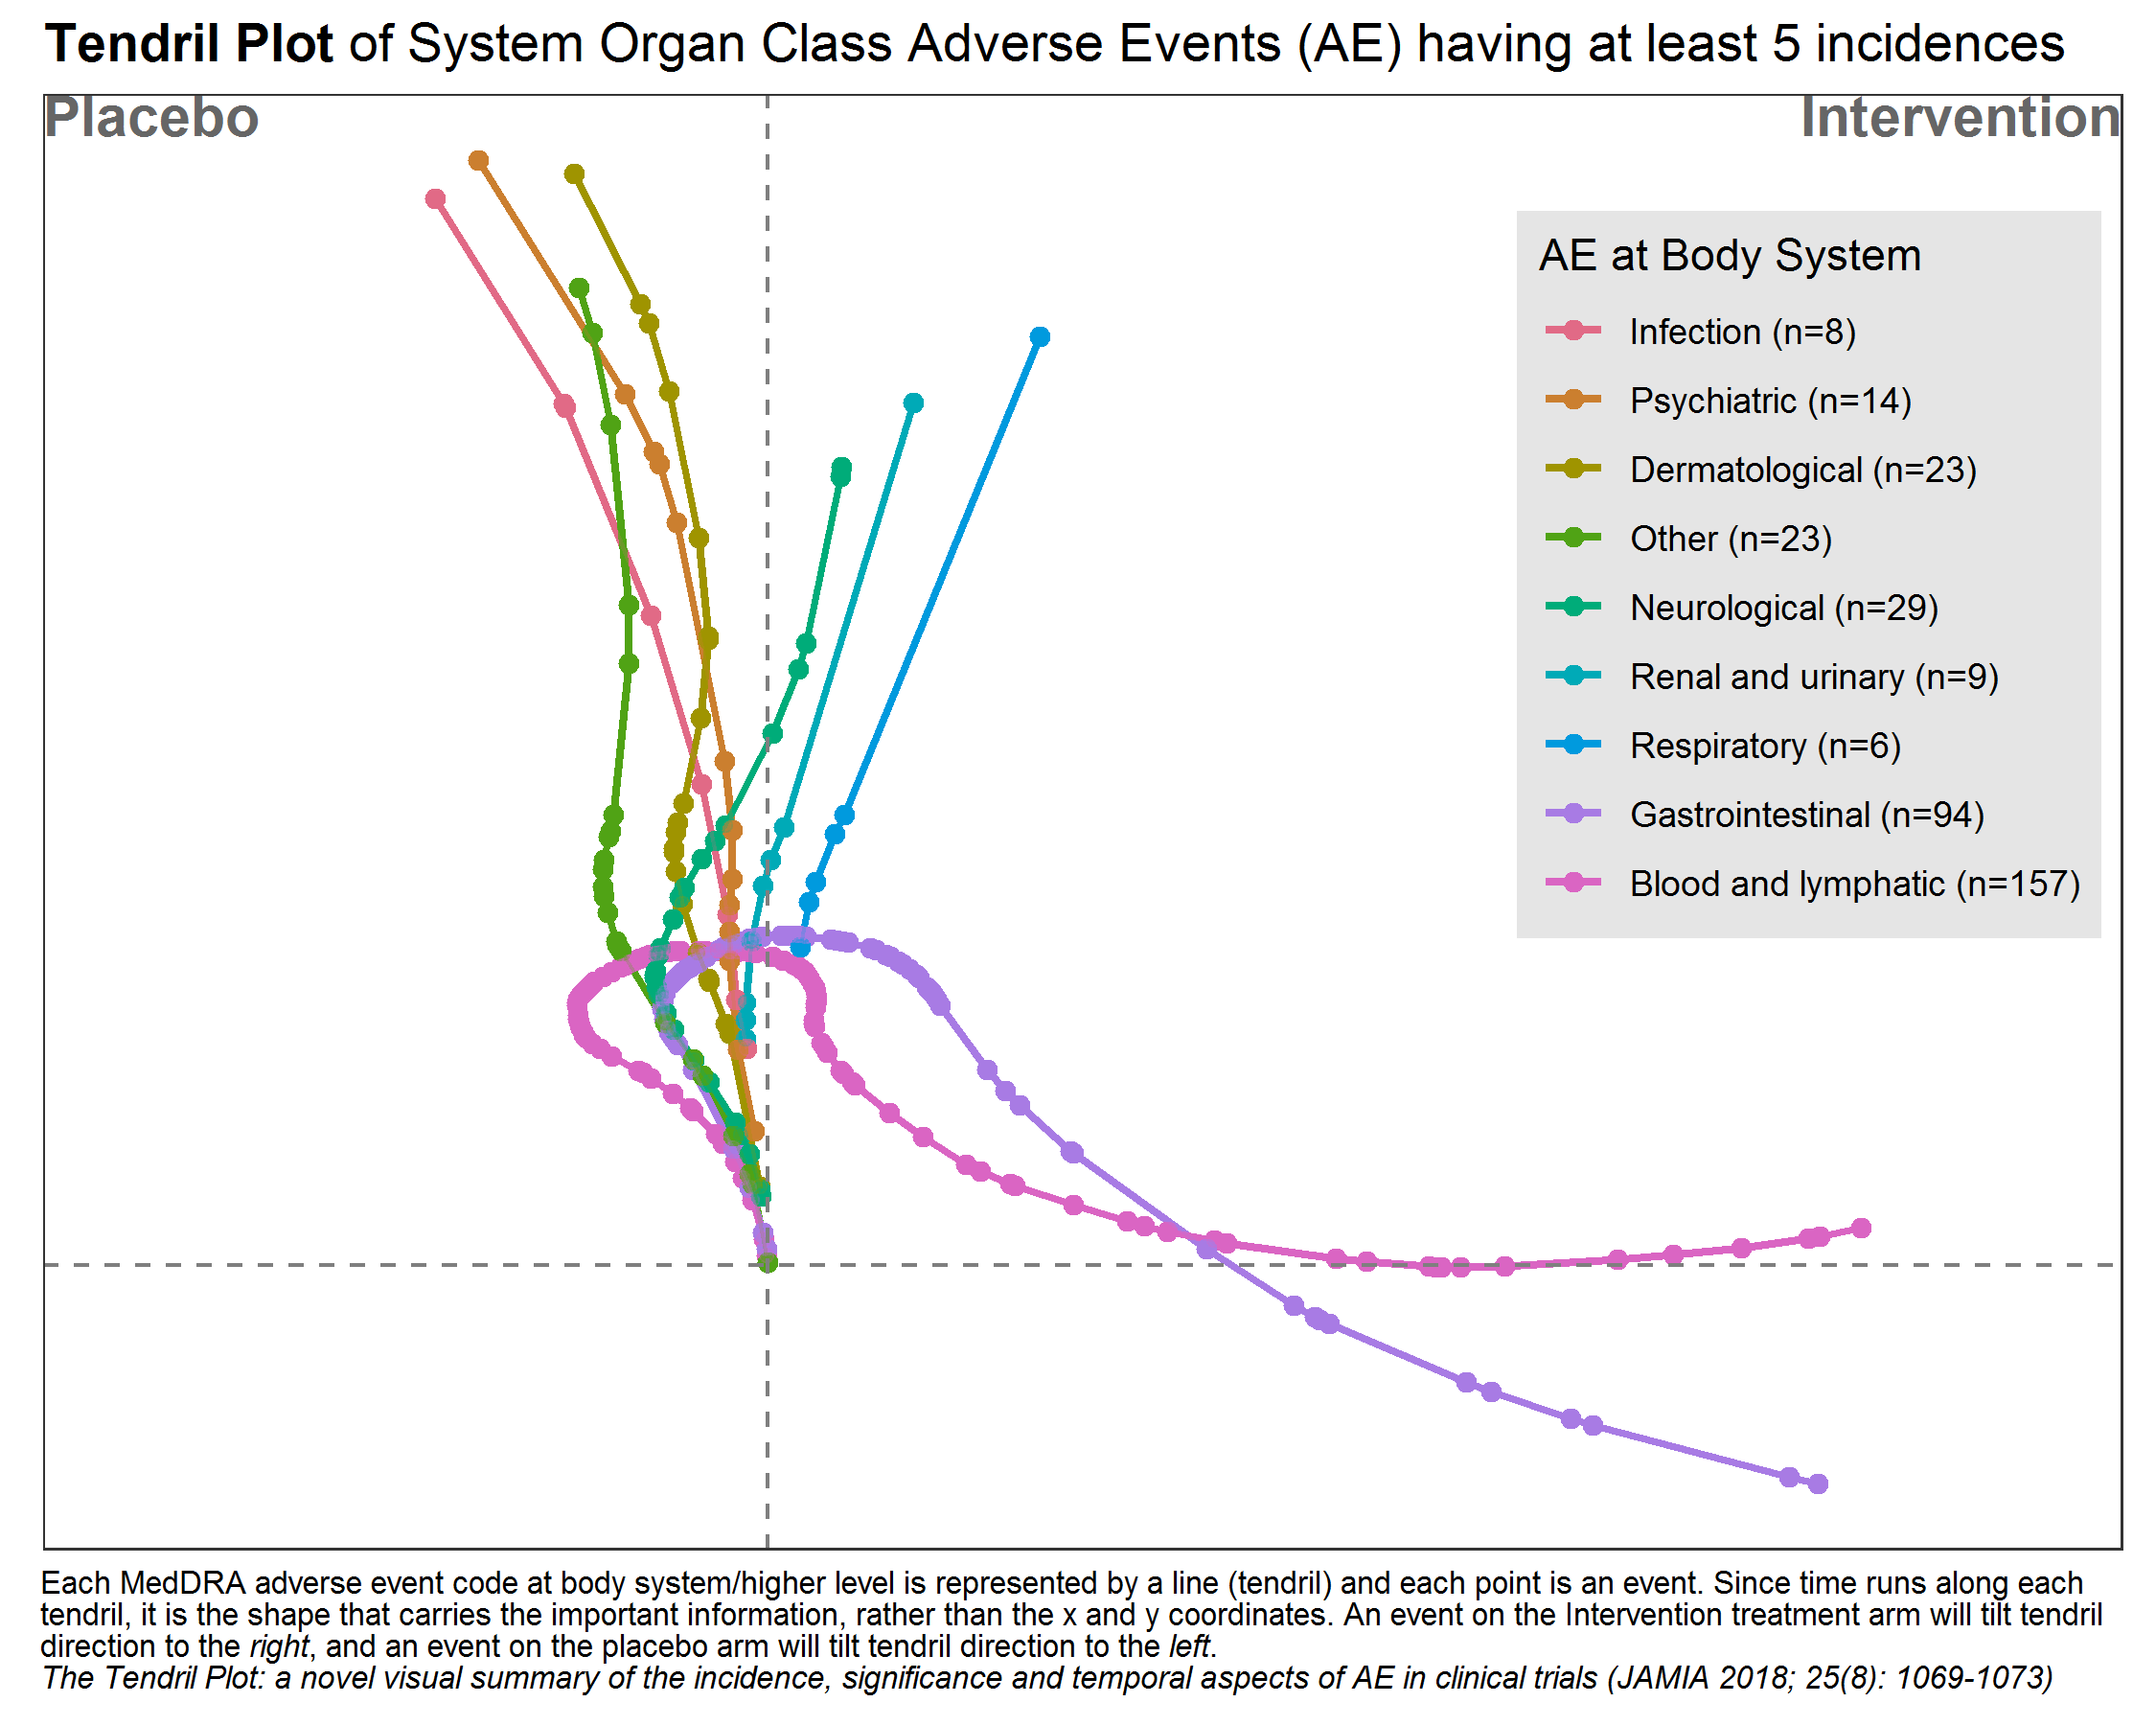
The Tendril Plot—a novel visual summary of the incidence, significance and temporal aspects of adverse events in clinical trials
Adverse events Data Presented on August 12th, 2020
ComplexUpset: Create Complex UpSet Plots Using 'ggplot2' Components
Adverse events II Data Presented on September 9th, 2020

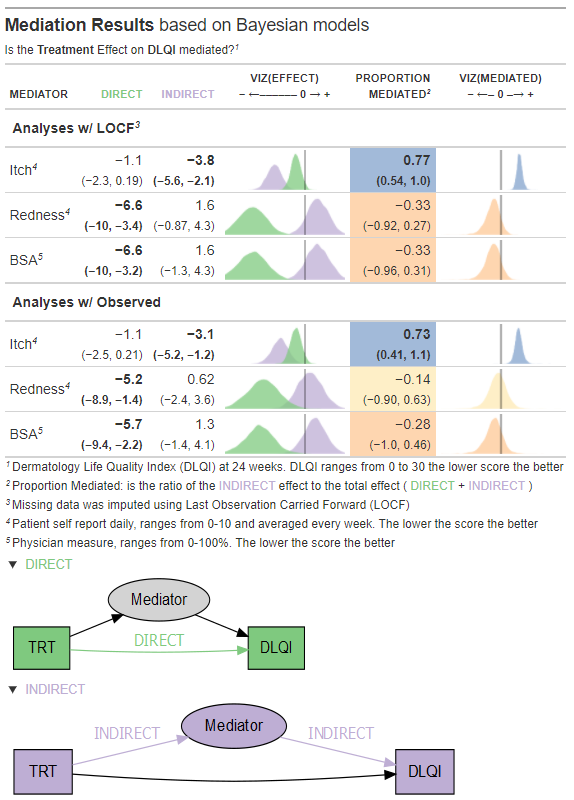
In some situations we may want to invesitage the direct and indirect effect of treament on the outcome. With medition models we introduce a intervening varaible between the treatment and outcome
Mediation data set. Presented on October 14th, 2020
Visualizing Risk Prediction Models. For each predictor, a color bar represents the contribution to the linear predictor. A conversion from the linear predictor to the estimated risk is also given.
Prediction data set. Presented on December 9th, 2020

Prediction data set. Presented on December 9th, 2020

DLQI data set. Presented on January 13th, 2021

Missing data set. Presented on February 10nd, 2021

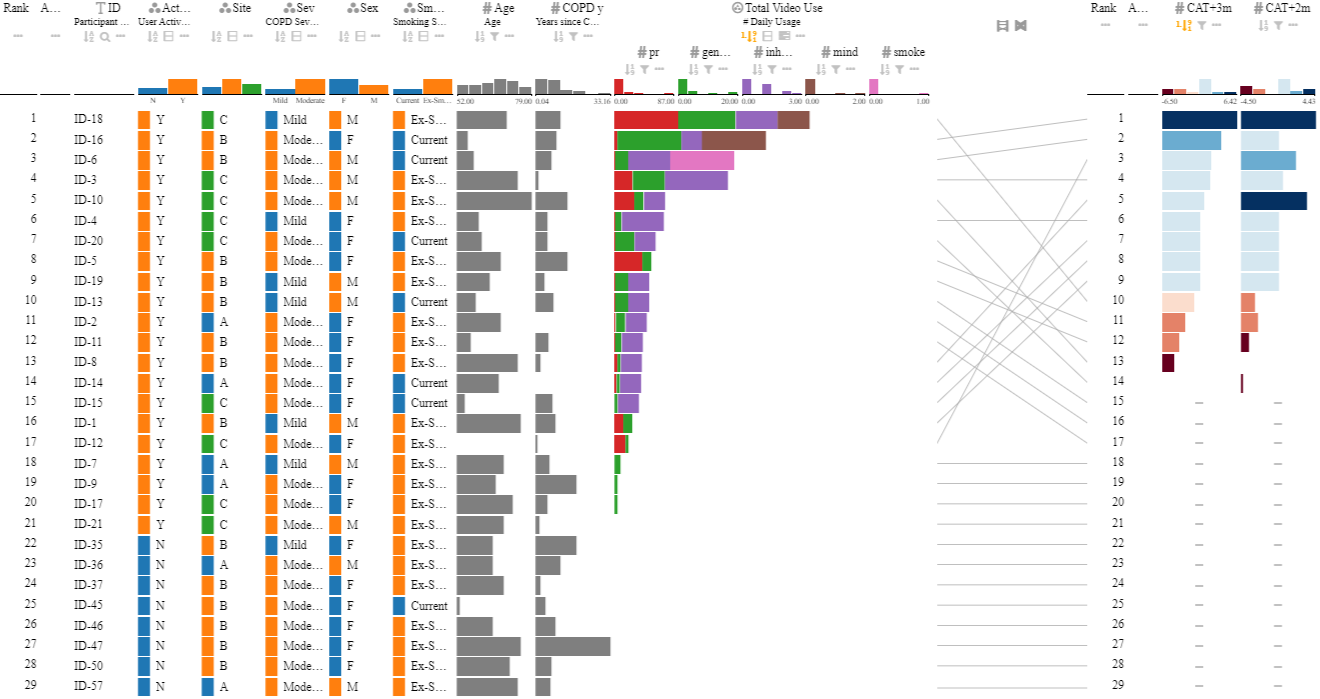
Mobile app data. Presented on March 10th, 2021
Sustained Response data. Presented on April 14th, 2021

Study data set. Presented on May 12th, 2021

Psychometric Overview. Presented on June 6th, 2021
.png)
Study data set. Presented on August 11th, 2021

Study data set. Presented on September 8thth, 2021
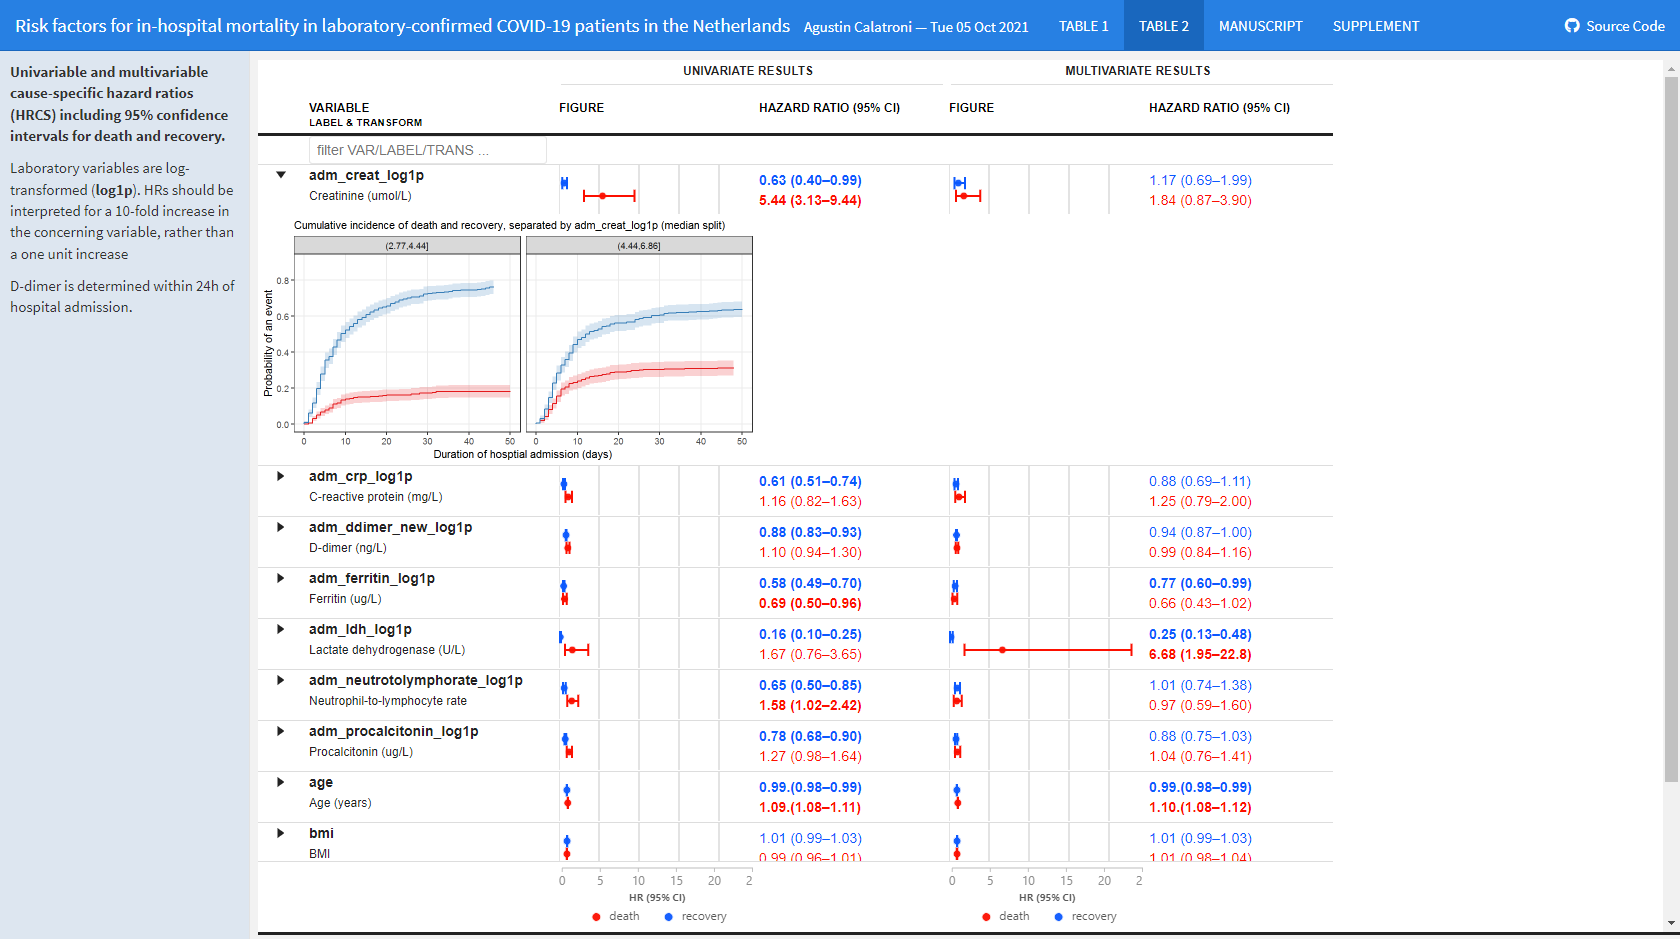
Study data set. Presented on October 10th, 2021

Study data set. Presented on Novermber 10th, 2021

Study data set. Presented on January 12th, 2022

Study data set. Presented on March 9th, 2022
Study data set. Presented on April 13th, 2022

Study data set. Presented on June 8thth, 2022

Study data set. Presented on July 13th, 2022

Study data set. Presented on August 8th, 2022

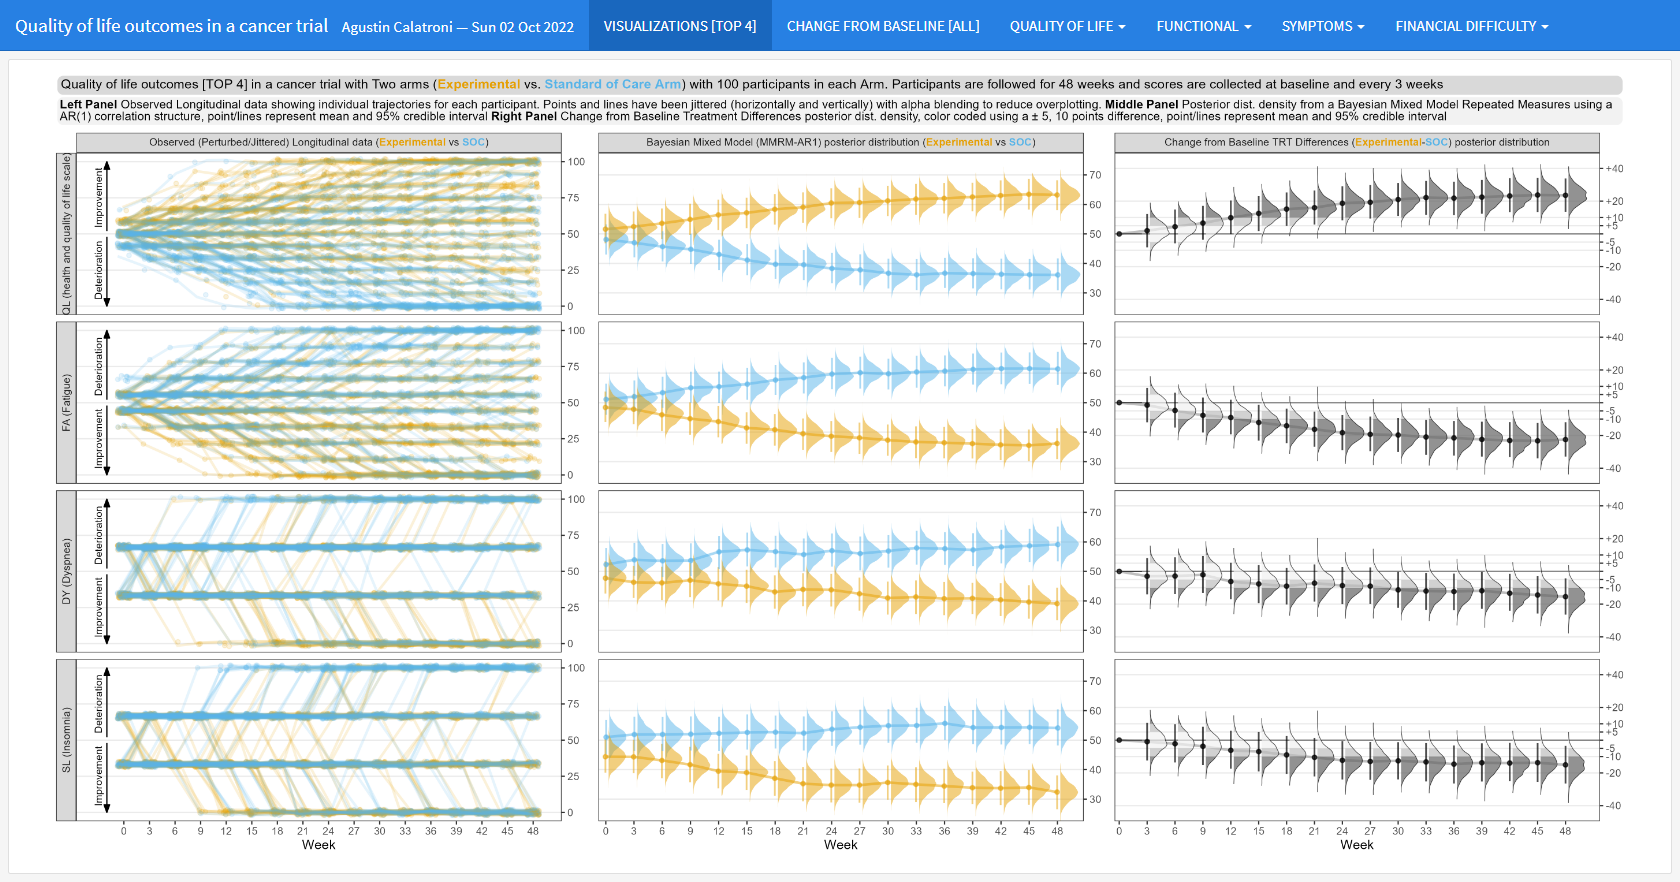
Study data set. Presented on September 14th, 2022
Study data set. Presented on February 8th, 2023

Study data set. Presented on March 8th, 2023
