The dataset is from an ongoing cardiovascular study on residents of the town of Framingham, Massachusetts. The classification goal is to predict whether the patient has a 10-year risk of future coronary heart disease (CHD). The dataset provides the patients’ information. It includes over 4,000 records and 15 attributes.
Download the dataset for this project from following Link https://github.com/ahmedshaik982/Cardiovascular_Risk_Prediction/blob/main/data_cardiovascular_risk.csv
The dataset has 3390 rows and 17 columns
-
id : unique id of a person
-
age : Age of the patient
-
education :
-
sex : male or female
-
is_smoking: whether or not the patient is a current smoker ("YES" or "NO")
-
Cigs Per Day: the number of cigarettes that the person smoked on average in one day.(can be
-
considered continuous as one can have any number of cigarettes, even half a cigarette.)
-
BP Meds: whether or not the patient was on blood pressure medication (Nominal)
-
Prevalent Stroke: whether or not the patient had previously had a stroke (Nominal)
-
Prevalent Hyp: whether or not the patient was hypertensive (Nominal)
-
Diabetes: whether or not the patient had diabetes (Nominal)
-
Tot Chol: total cholesterol level (Continuous)
-
Sys BP: systolic blood pressure (Continuous)
-
Dia BP: diastolic blood pressure (Continuous)
-
BMI: Body Mass Index (Continuous)
-
Heart Rate: heart rate (Continuous - In medical research, variables such as heart rate though in fact discrete, yet are considered continuous because of large number of possible values.)
-
Glucose: glucose level (Continuous)
-
TenYearCHD : 10 year risk of coronary heart disease (1 - Yes, 0 - No)
- Google colab notebook
- Pandas library
- Numpy
- Matplotlib and Seaborn for data visualization
- Scikit Learn for implementing Machine Learning Models.
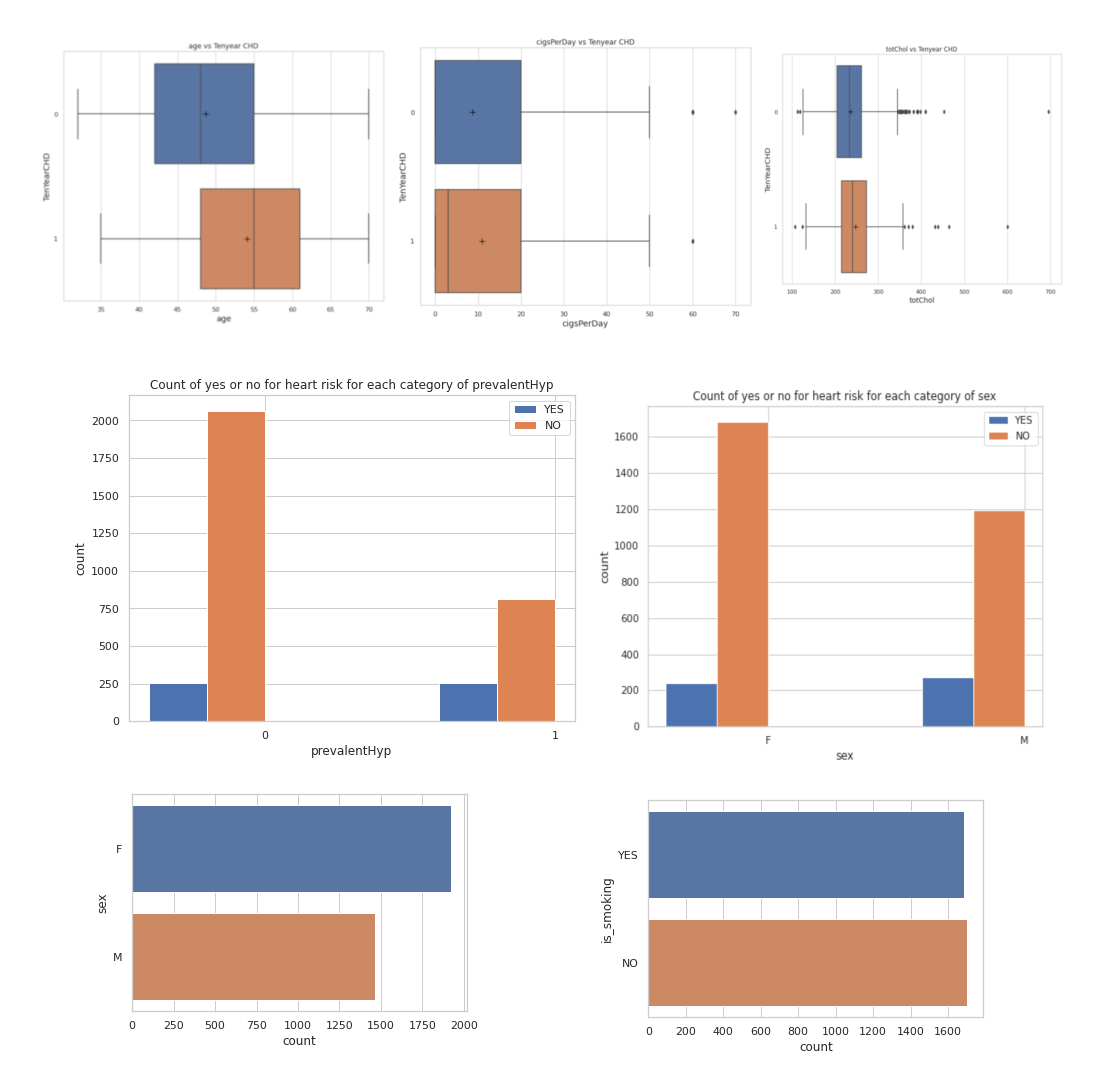
From Exploratory data Analysis, we can conclude that
-
Our dependent feature, is actually an indicator variable with only two possible values; 0 and 1
-
Some featutres like prevalentStroke, prevalentHyp, diabetes, BPMeds, education and target features should be categorical features.
-
Most number of patient's age falls in the range 35 - 45
-
most number of patients belongs to education category '1.0'.
-
Most number of patients smoke cigerette in range of 0 - 10.
-
Most number of patients are not on BP Medications
-
Most number of patients does not have a stroke previously
-
Most number of patients are hot hypertensive.
-
Most number of patients are not diabetic.
-
Most number of patient's Cholestrol falls in the range 200 - 300
-
Most number of patient's Systolic Blood Pressure falls in the range 100 - 150
-
Most number of patient's Diastolic Blood Pressure falls in the range 70 - 90
-
Most number of patient's BMI falls in the range 20 - 30. And a very few has above 40
-
Most number of patient's Heart Rate falls in the range 70 - 90
-
Most number of patient's Glucose levels falls in the range 50 - 100.
-
Most of the patients are females.
-
Almost half of the patients have a habit of smoking
-
Outliers present in continous features except age column.
-
The feature 'cigsPerDay' is equally distributed, which means the feature is not a good predictor.
-
The patients who have more age, totChol, sysBP, diaBP, BMI, heartRate, glucose are tending towards risk of coronary heart disease
-
58.4 % of females and 41.5 % of males have no risk of CHD
-
46.7 % of females 53.22 % of males have risk of CHD
-
50.9 % of people who doesnt smoke have no risk of CHD
-
49 % of people who smoke have no risk of CHD
-
46.1 % of people who doesnt smoke have risk of CHD
-
53.8 % of people who smoke have risk of CHD
By fitting the data into various classification models and evaluating with test data, we can conclude that,
-
For our problem statement, we have two cases
-
Case 1 : if a person has a disease but the model shows the person has no risk. For this case recall is the best evaluation metric
-
Case 2 : if a person has no risk of disease but the models predicts the person has a risk. For this case, precision is the best evaluation metric
-
When both of the above cases are important, we can use F1_score evaluation metric
-
If Recall is important, i.e., if we want to focus on case 1, then Logistic Regression and KNN models are preferrable
-
If Precision is important i.e., if we want to focus on case 2, then Naive Bayes model is preferrable
-
If F_Score is important, i.e., if we want to focus on both case 1 and case 2, then Logistic Regression model is preferrable
-
For Random Forest Classifier, 'age' feature has more importance and least is 'PrevalentStroke'.
-
For SVM Classifier, 'age' feature has more importance and least is 'prevalentStroke'.
-
For Decision Tree Classifier , 'age' feature has more importance and least is 'prevalentStroke', 'diabetes'.
-
For logistic regression, 'age' feature has more importance and least is 'BMI', 'diabetes', 'heartRate'.