Table of Contents
Using code to make art. Many neat mathematical art patterns can be easily generated with few simple lines of code defining basic math rules
run python runfile.py after editing run.txt to produce the image.
Edit run.txt file to generate images, the below format is the required syntax:
Notice that in canvas, always make sure to specify SIZE first
SIZE = (WIDTH, HEIGHT)

CODE HERE
You have control over the color of every pixel on the canvas in the run.txt file, of customizable size (default (1000, 1000)). As such, a lot of manipulation can be done in order to produce unique images. The color of a pixel at (x, y) is can be accessed via image[x, y]. For example, if we wanted to color the point (0, 0) white, we would use the RGB value for white (255, 255, 255):
SIZE = (1000, 1000)
image[0, 0] = (255, 255, 255)
Example, if we wanted to color the entire canvas white:
SIZE = (1000, 1000)
image[x, y] = (255, 255, 255)
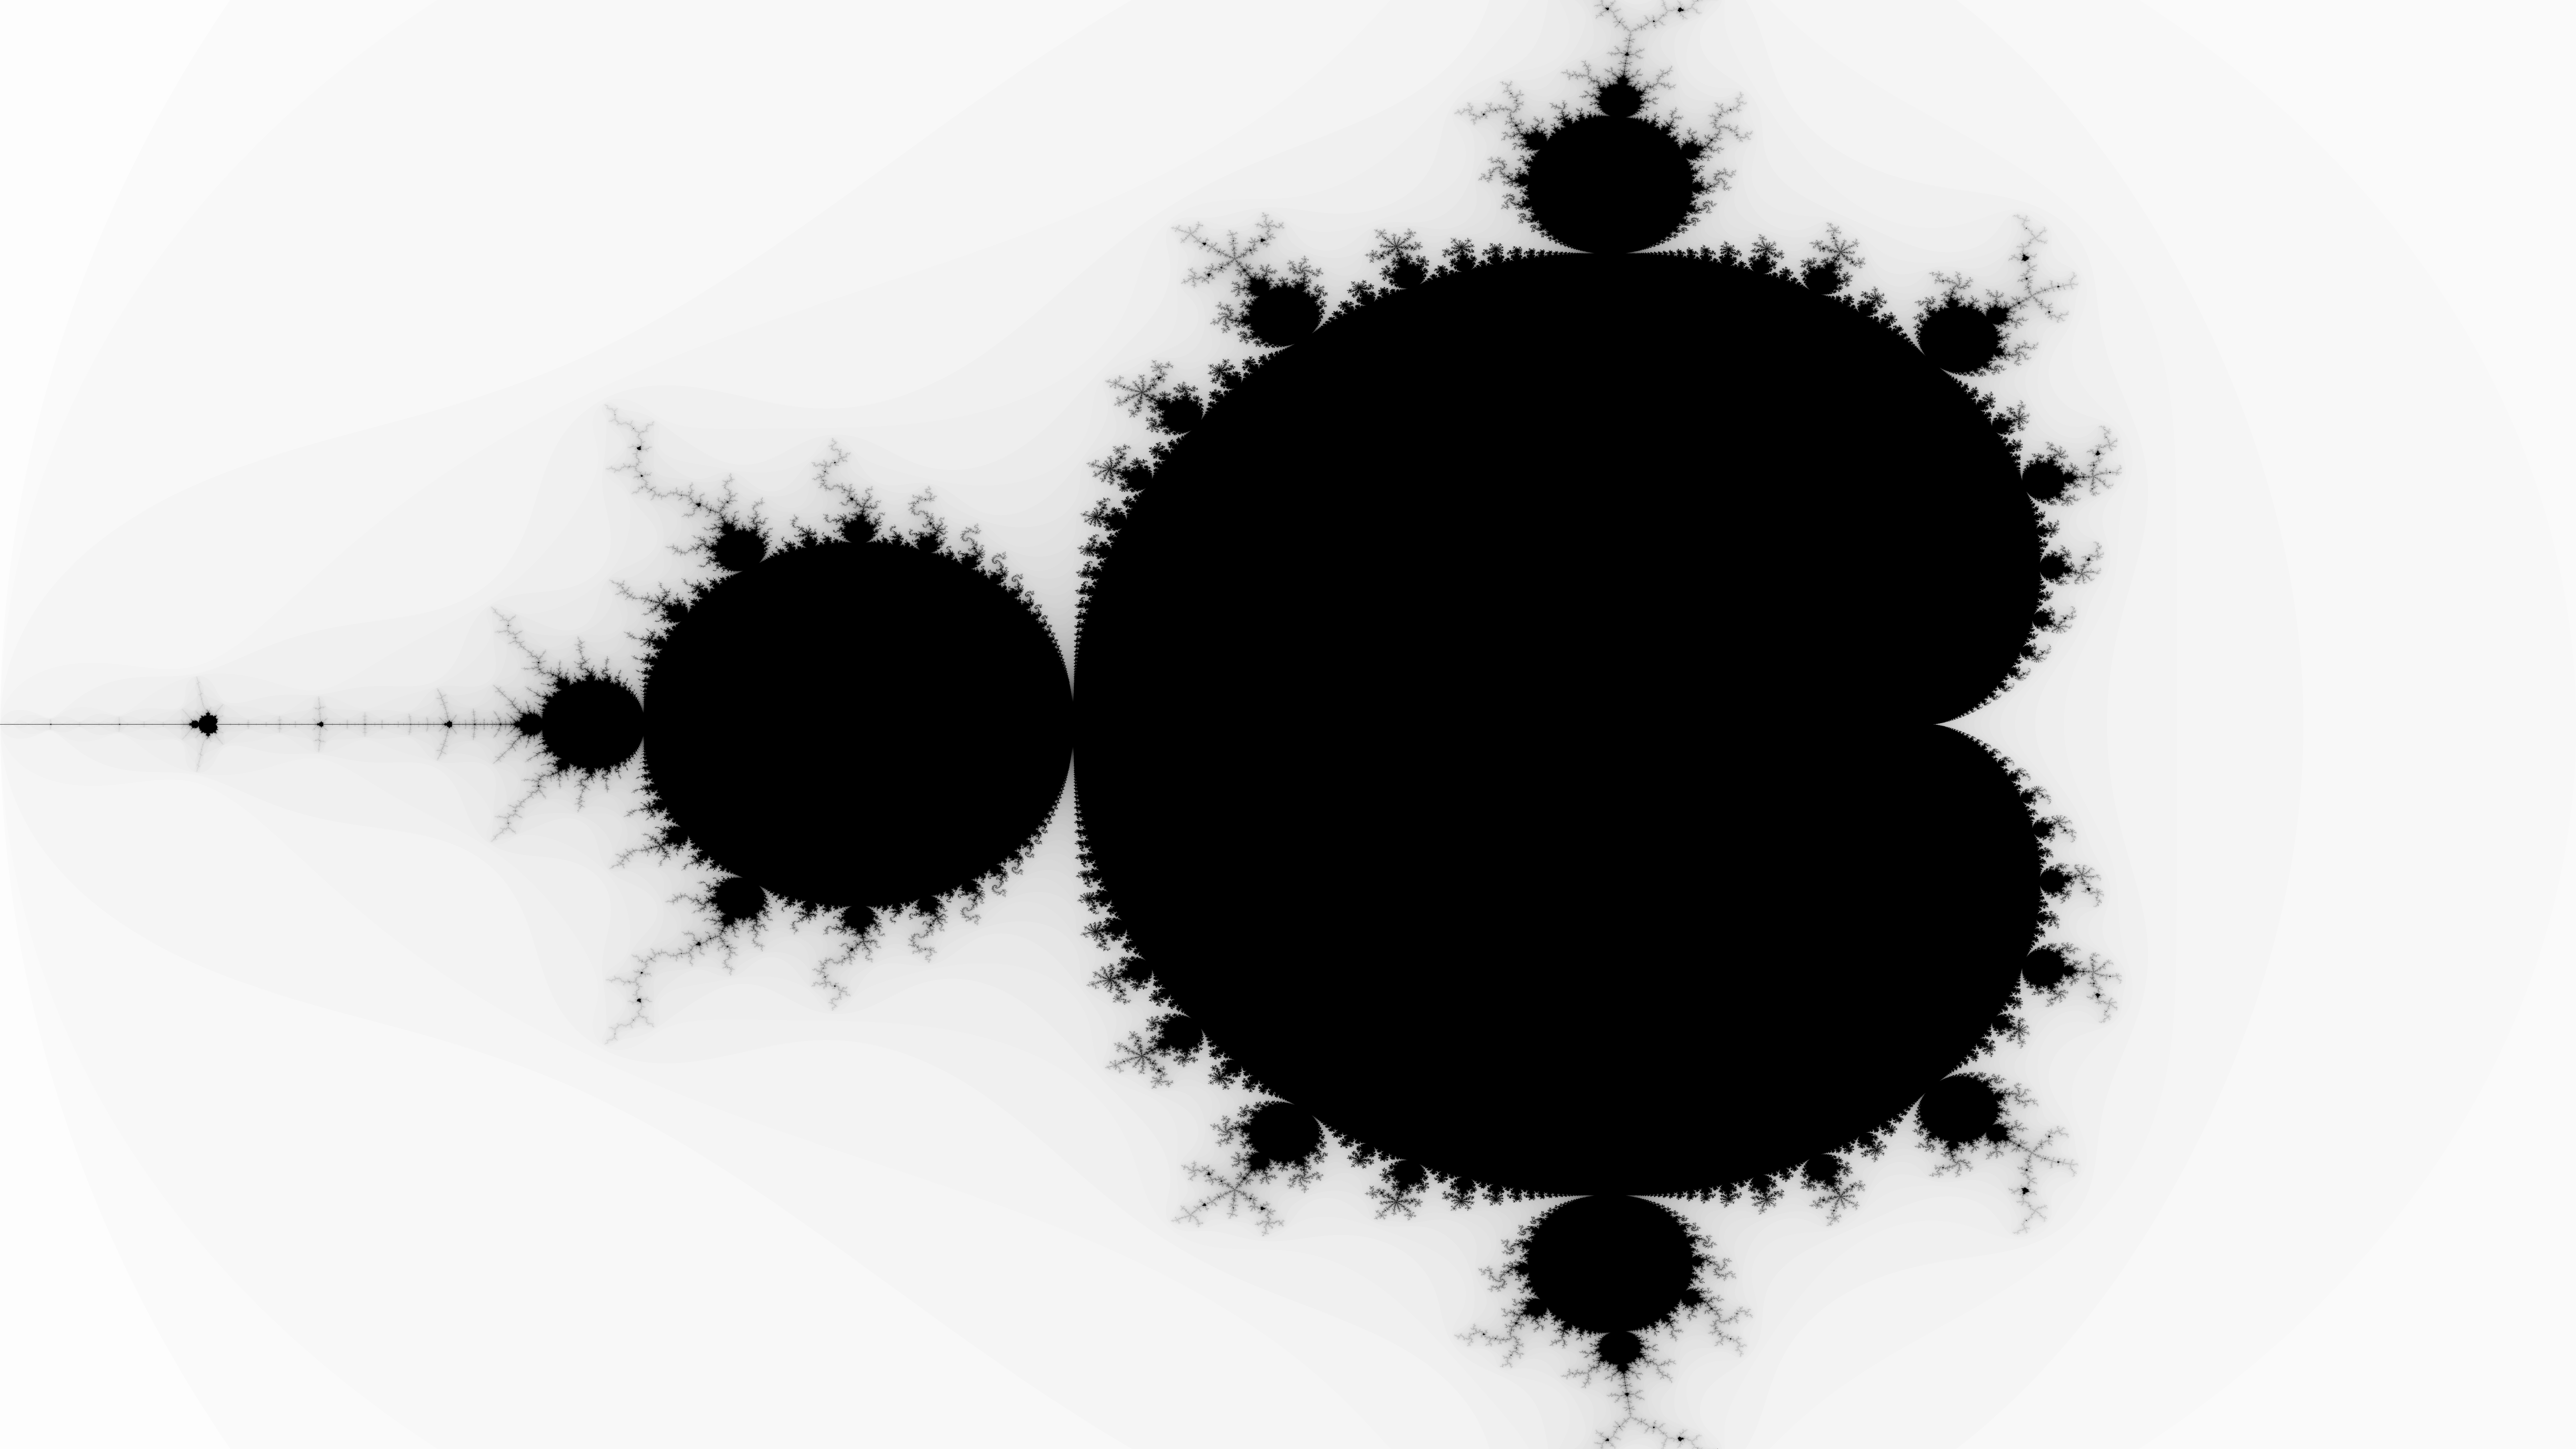
Plotting the mandelbrot set is relatively simple in run.txt file
--> Iterate over all the pixels of your image --> Convert the coordinate of the pixel into a complex number of the complex plane --> Call the function mandelbrot --> If mandelbrot returns MAX_ITER, plot a black pixel, otherwise plot a pixel in a color that depends on the number of iterations returned by mandelbrot This is called the "Escape time algorithm"
WIDTH = 100
HEIGHT = 100

RE_START = -2
RE_END = 1
IM_START = -1
IM_END = 1
SIZE = (WIDTH, HEIGHT)

for x in range(0, WIDTH):
	for y in range(0, HEIGHT):
		c = complex(RE_START + (x / WIDTH) * (RE_END - RE_START), IM_START + (y / HEIGHT) * (IM_END - IM_START))
		m = util.mandelbrot(c)
		# The color depends on the number of iterations
		color = 255 - int(m * 255 / util.MAX_ITER)
		image[x, y] = (color, color, color)
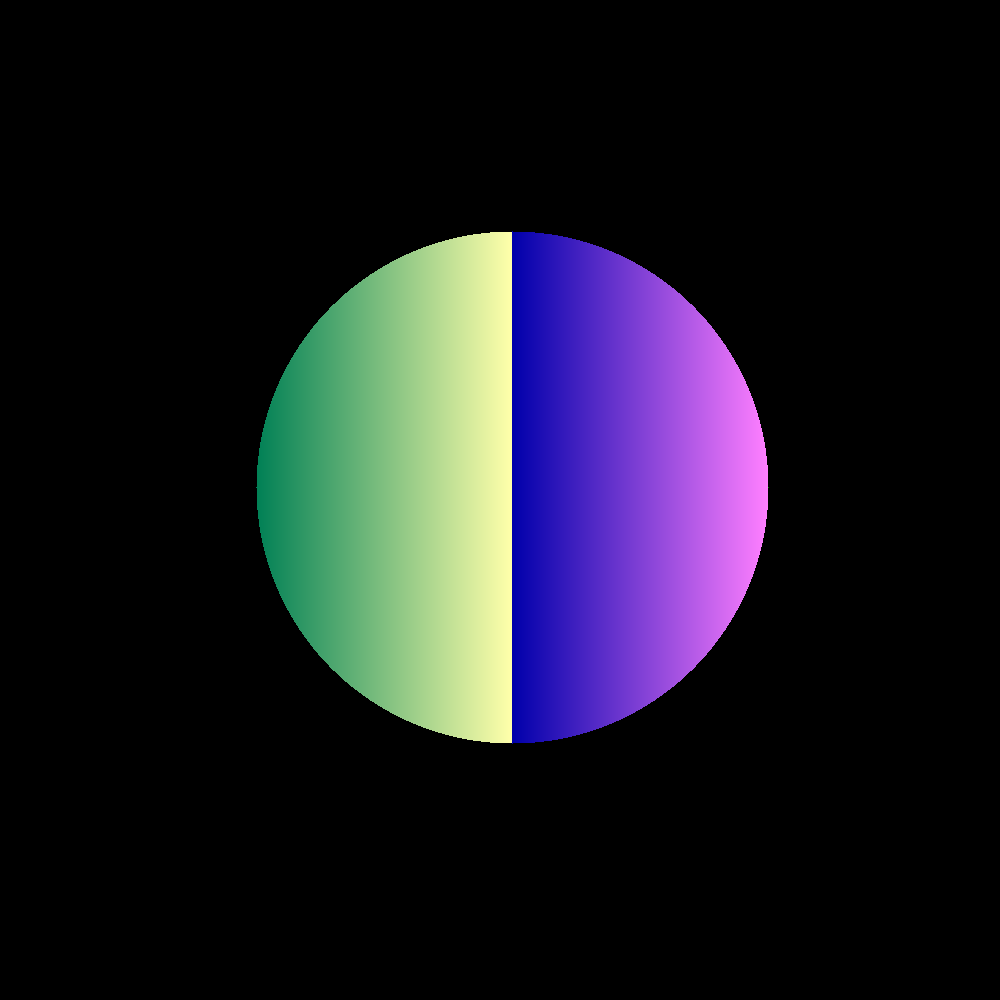
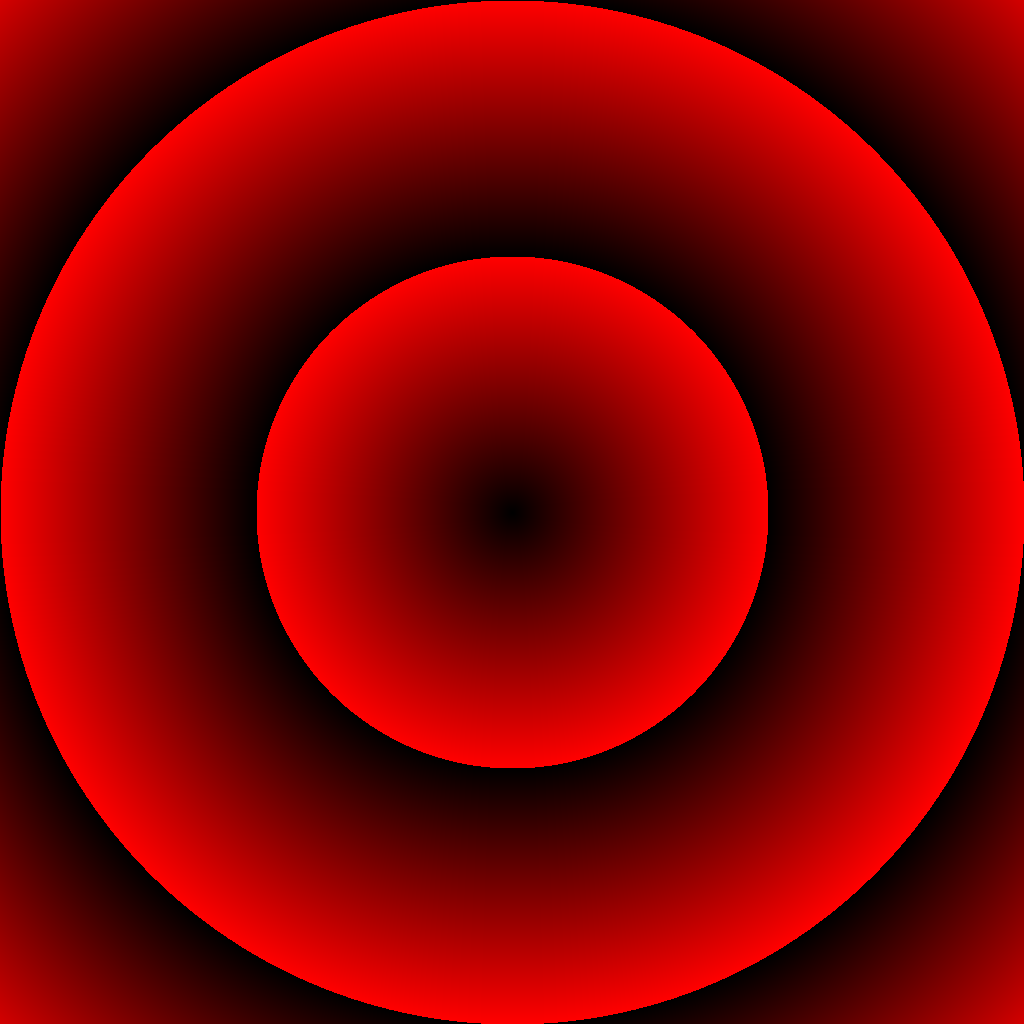
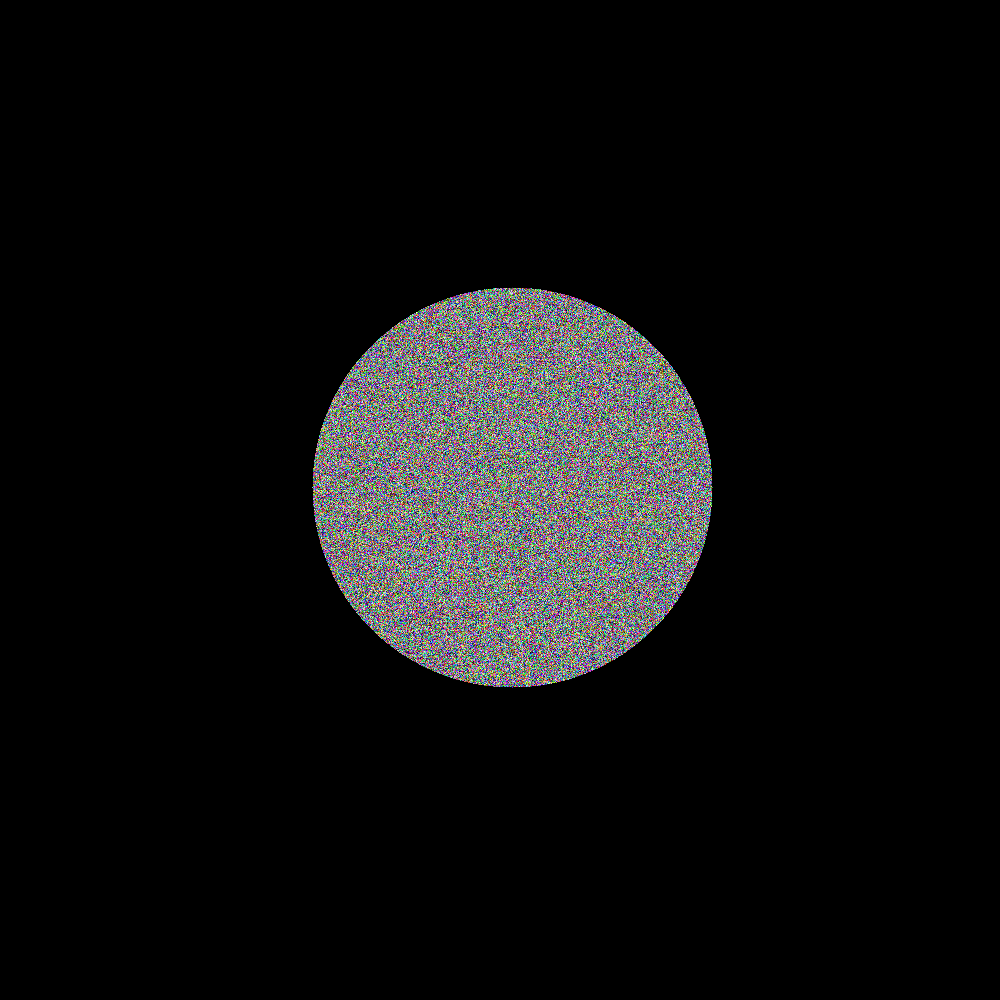
These are just few examples:


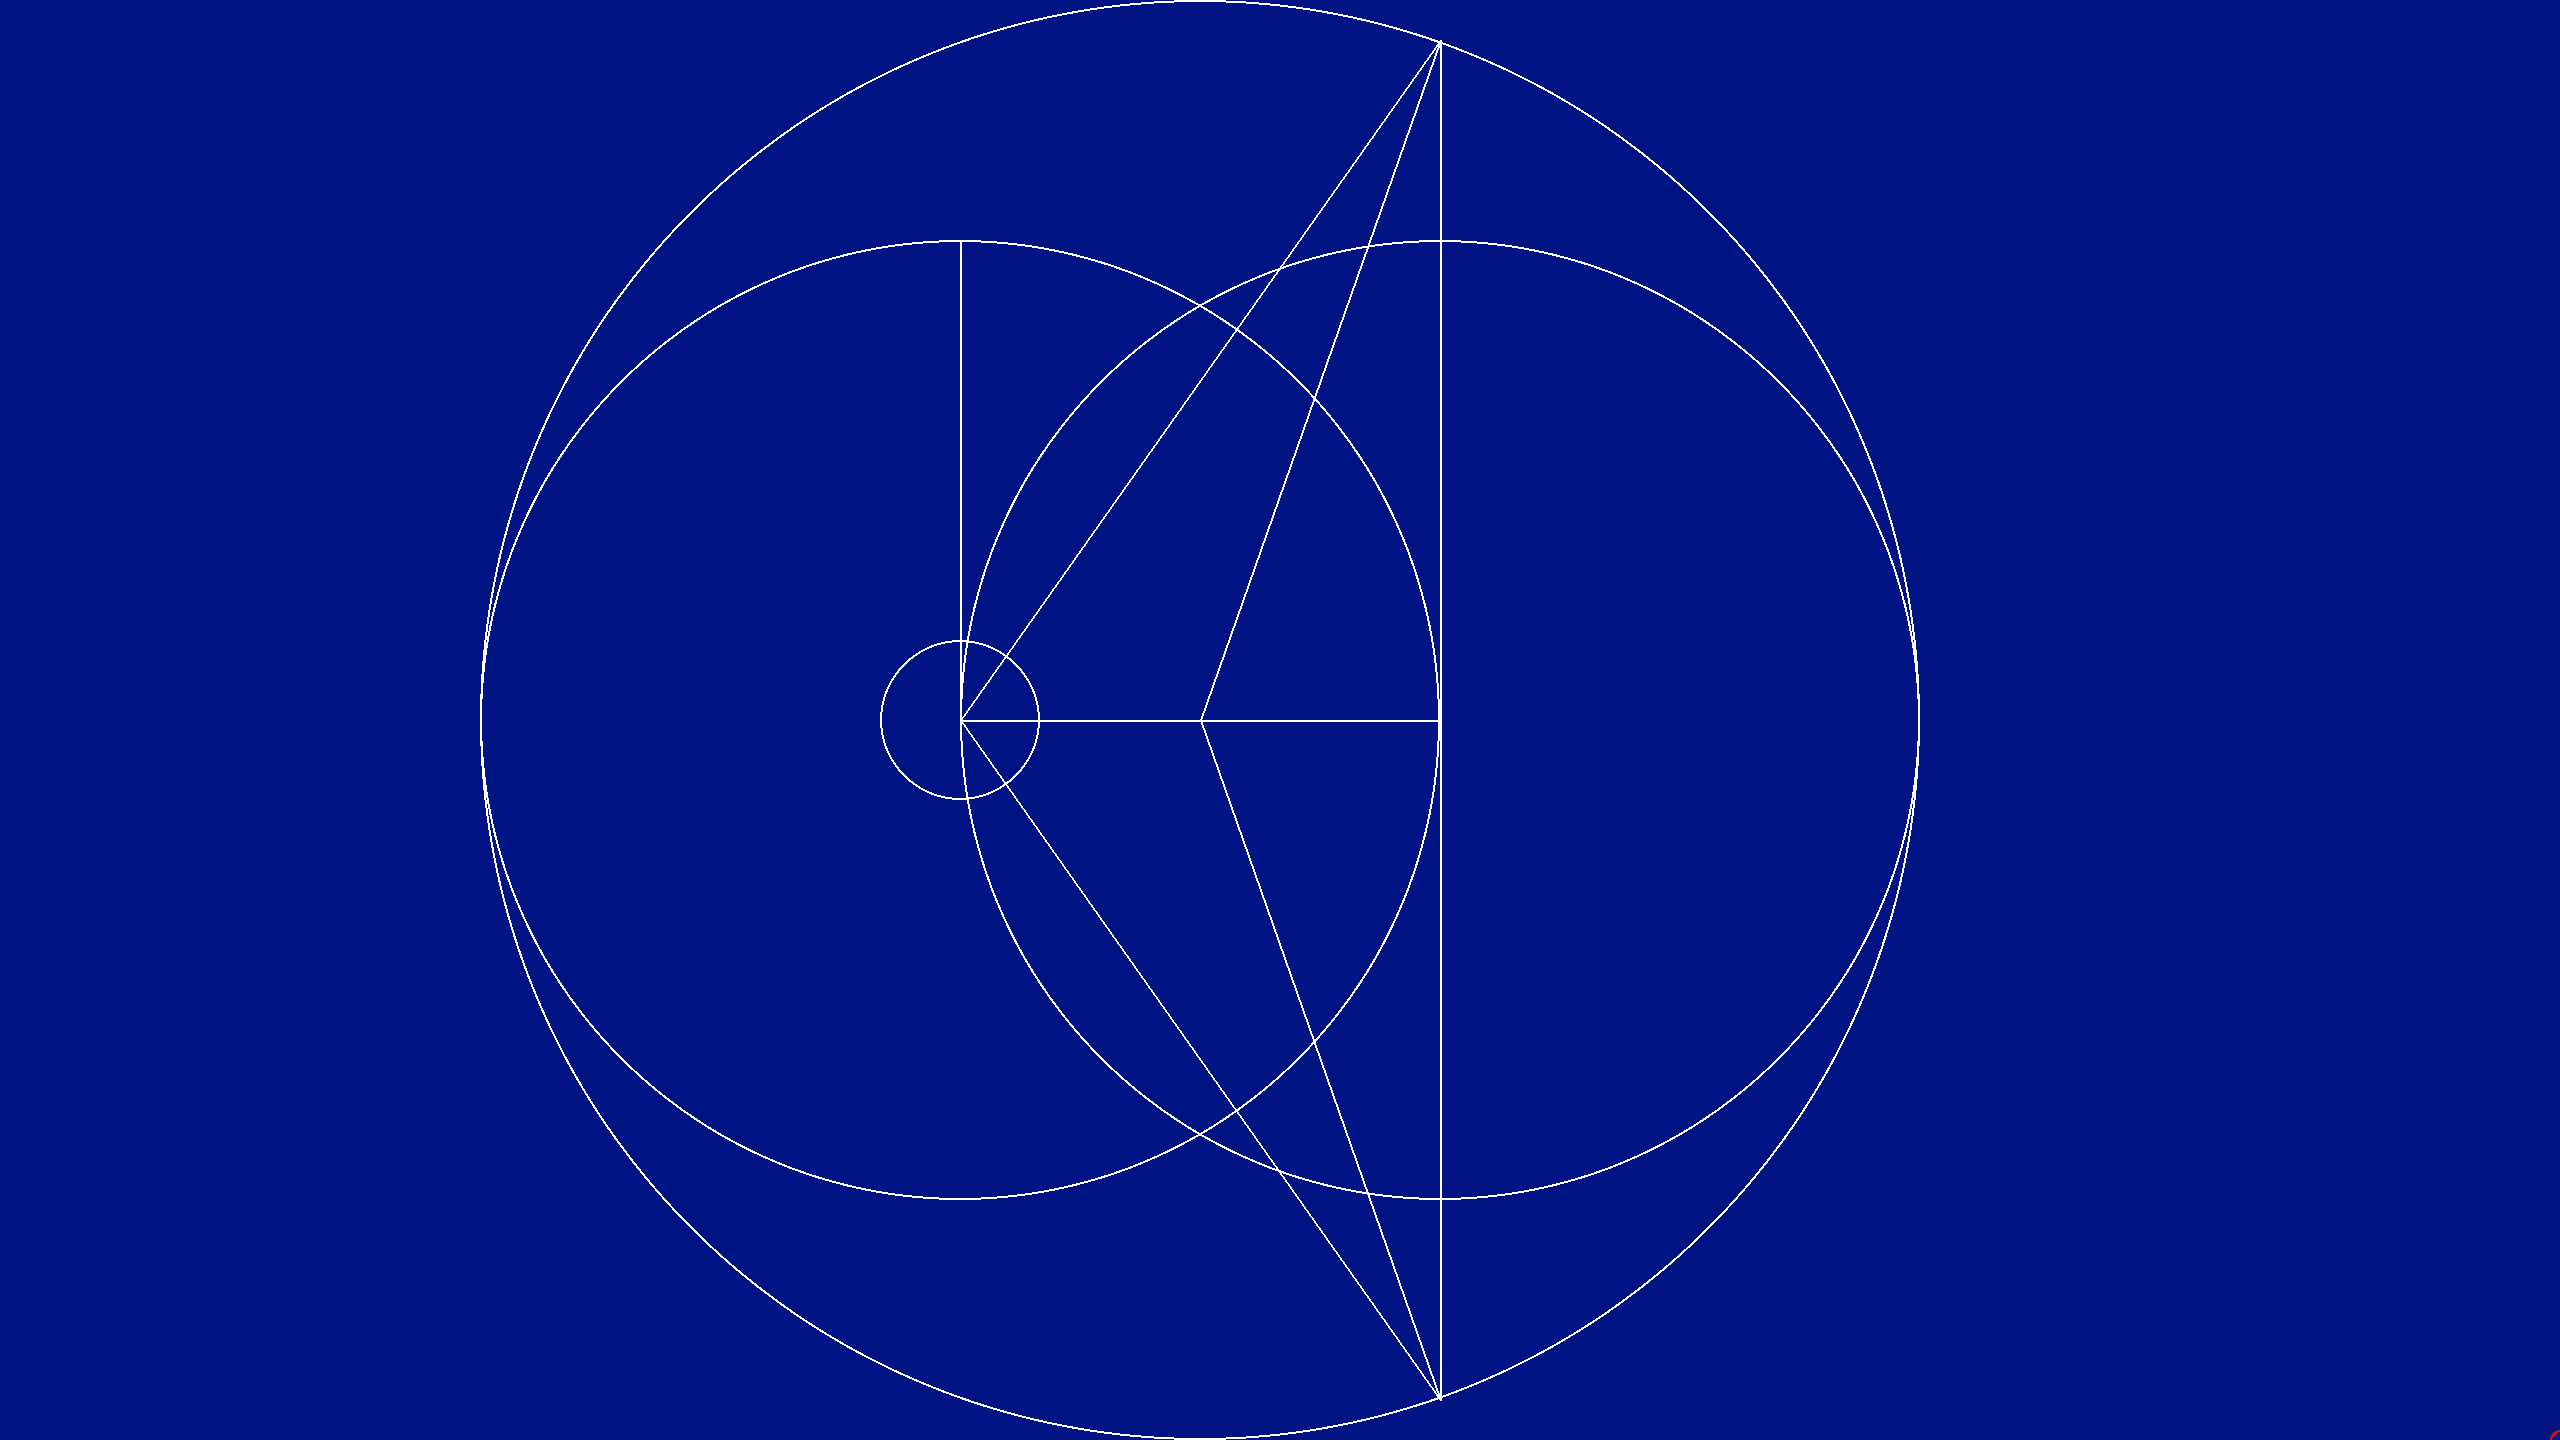
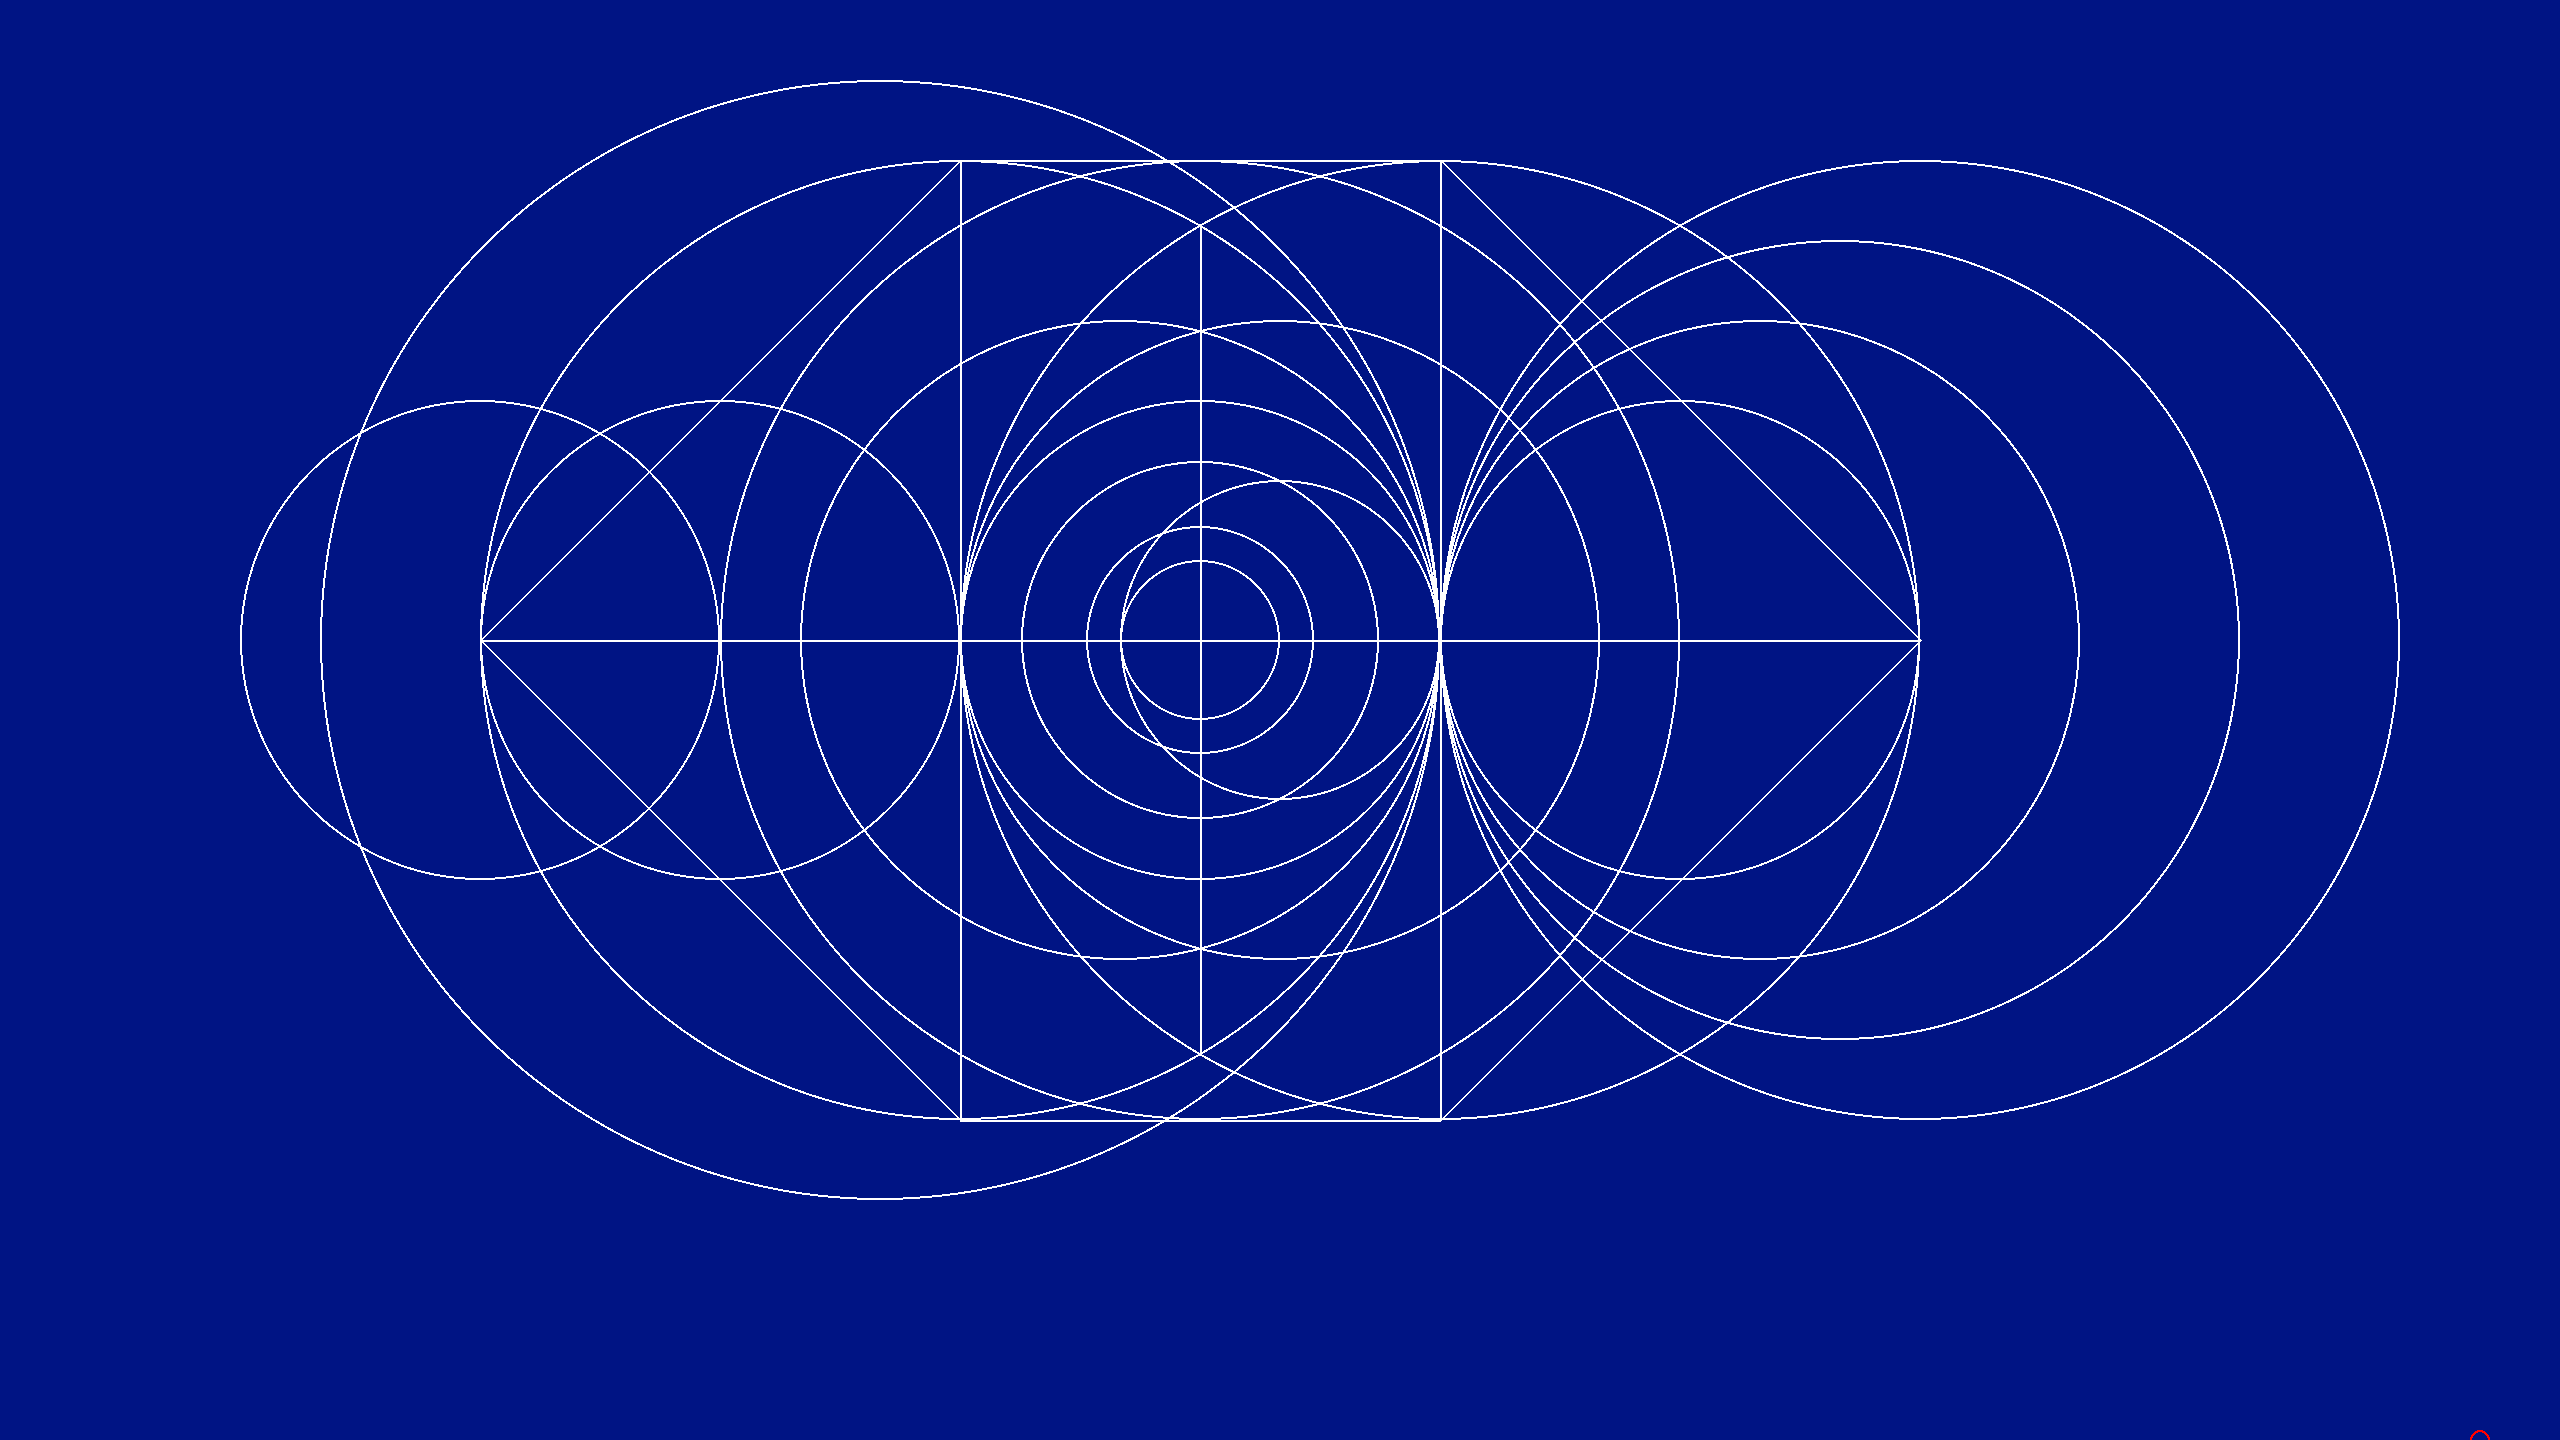
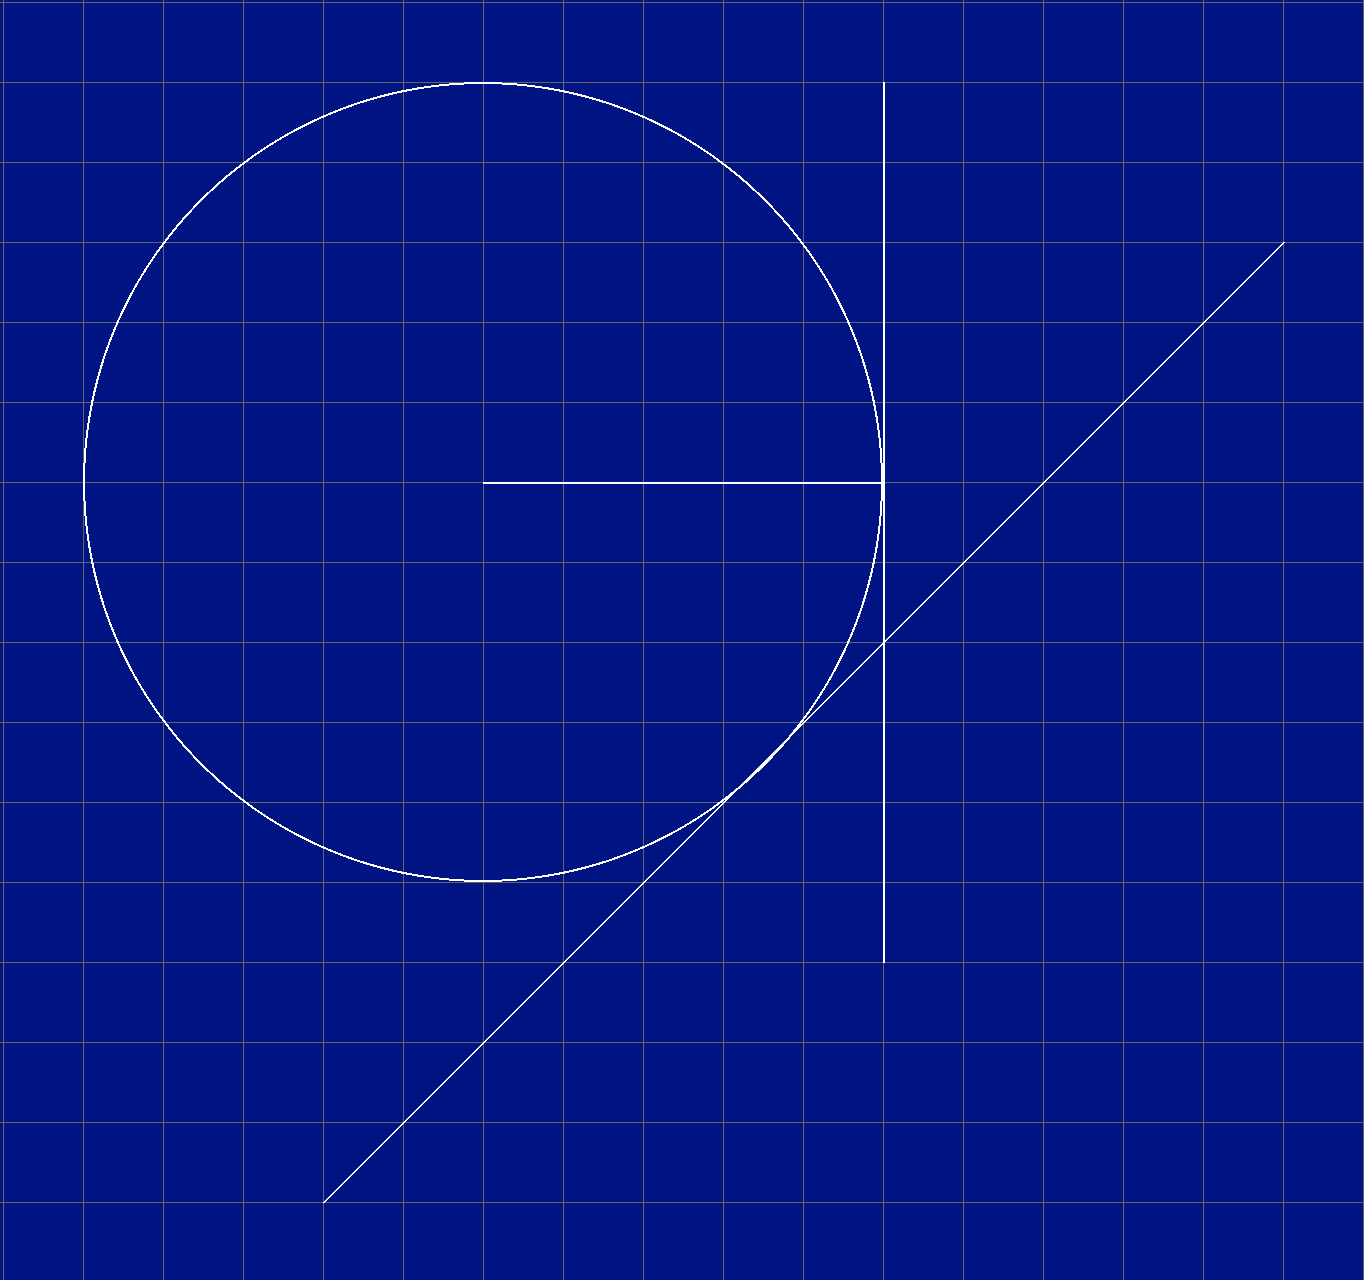
A simple shape construction & geometrics visualistaion app built using pygame library, you can visualise many different mathematical curves & geometrical shapes using this.
To run the python file, go to bluePrintArt/src and run main.py file, type "M" after the image screen shows up to toggle to default view menu.
- Press following keys to enter the respected mode after toggling to menu view