This is a sample stack of functions for FaaS to track the count of stars added to a Github repository over time.
It shows:
- that FaaS works well on a Raspberry Pi or 32-bit ARM architecture
- how to integrate with Github webhooks via the FaaS API Gateway
- how to use a Raspberry Pi LED matrix to show data from the built-in Prometheus metrics
- how to build functions for the Raspberry Pi
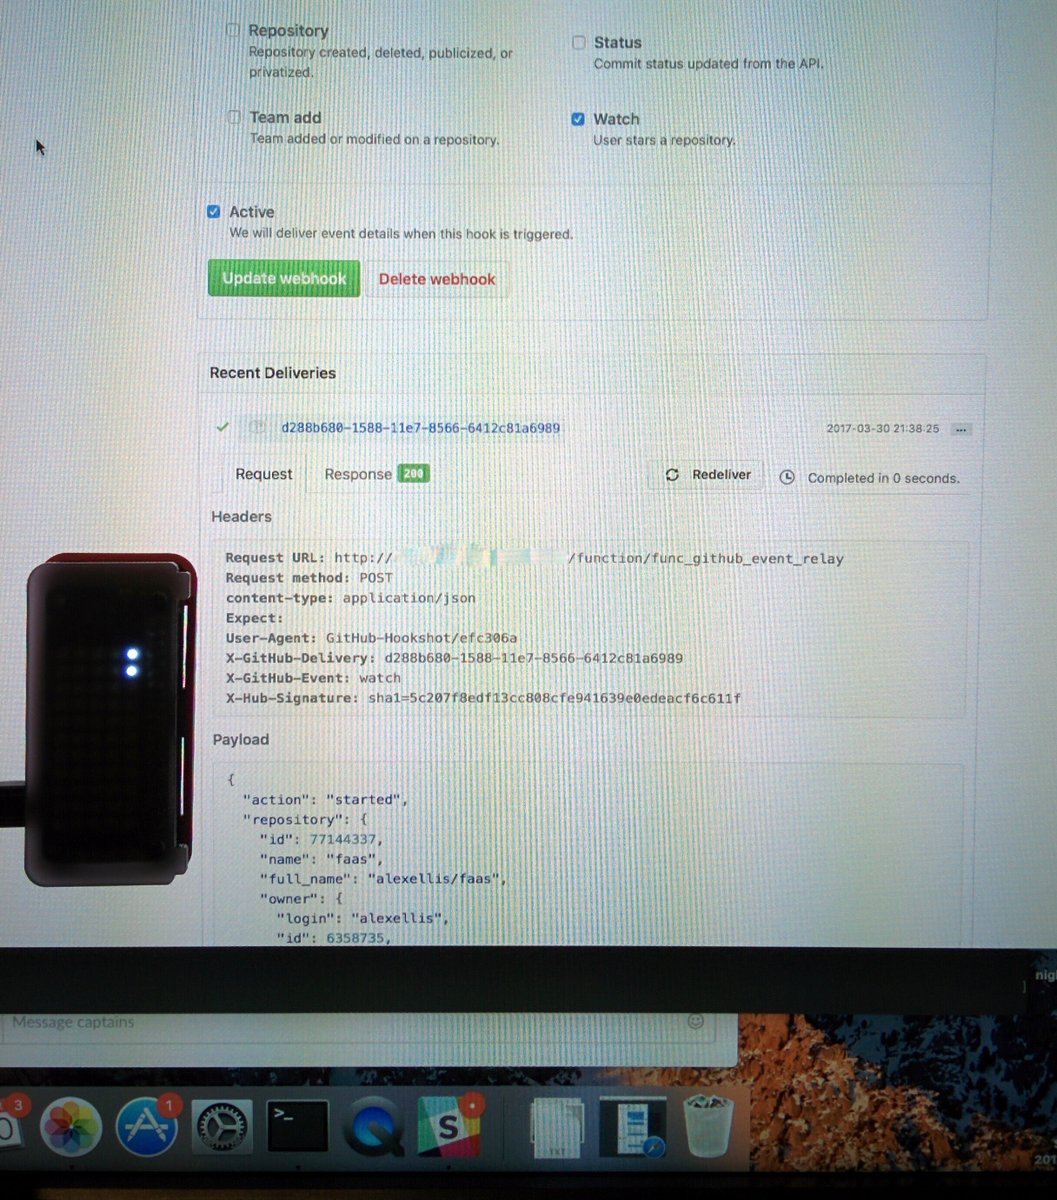
In the photo you can see two LEDs lit up which means that two stars were added to the repository on Github over the last 30 minutes. As more stars are added the matrix will fill up. The page in the background is showing the webhook event that Github sent to the FaaS API Gateway through the github_event_relay function.
Find out more about the FaaS framework for Docker
Pre-reqs:
- Raspbian Lite and a Raspberry Pi
- Docker 1.13+
- For a physical display - enabled i2c and connect a Pimoroni scroll-phat
Clone this repository
$ git clone https://github.com/alexellis/github_counter_faas

$ cd github_counter_faas
Initialize Docker swarm:
$ docker swarm init
Tutorial: Build an RPi swarm
Deploy the FaaS stack:
The docker-compose.yml file defines all the long-running services and functions in the stack.
Deploy the stack like this:
$ docker stack deploy func --compose-file=./docker-compose.yml
Tutorial: Learn about Docker Stacks
If you have several Raspberry Pis in a Docker Swarm then FaaS can automatically spread your functions across the hosts.
Head over to Github settings for your repository and enter your URL into a new Webhook. Select only specific events, then "watchers".
You can now either set up a NAT/port forwarding rule on your home router or run ngrok to create a quick tunnel and expose your FaaS API gateway on the internet. Your URL will be something like:
http://ngrok.io/function/func_github_event_relay
- Method 1 - view the FaaS Portal UI
The gateway is deployed on port 8383 on the IP address of the Raspberry Pi. Go to that URL in a web-browser and you will see all the functions listed on the left hand side. Click a function to see its invocation count - the count refers to the amount of times Github has called this endpoint.
- Method 2 - view the data in the Prometheus UI
Prometheus is deployed on port 9090. Load the web-age and view the increase in star events via the func_stars function. This query shows the increase over the last 30 minutes (in PromQL):
increase(gateway_function_invocation_total{code="200",function_name="func_star",instance="gateway:8080",job="gateway"}[30m])
- Method 3 - built-in Pimoroni scroll-phat display (pictured)
If you have connected a scroll-phat from Pimoroni then you can build and run the following code to start a container that monitors the Prometheus query above and displays the total as a number of pixels.
$ cd prometheus_scroll
$ docker build -t prometheus_scroll .
$ docker rm -f scroll
$ docker run --name scroll --privileged --restart=always -d prometheus_scroll